Synthetic Monitoring requires virtual environments on the hosts running the tests. By default, Checkmk uses RCC (originally developed by Robocorp) for this purpose—as described in the article Checkmk Synthetic Monitoring with Robotmk (RCC). If RCC does not work for you, you can alternatively use our in-house tooling CSM/Micromamba—as described here in the article „Checkmk Synthetic Monitoring with Robotmk (CSM)“. |
1. Synthetic monitoring with Robot Framework
![]() Checkmk Synthetic Monitoring is available in the commercial Checkmk editions, but it requires an additional subscription.
You can however test the function with up to three tests free of charge and without a time limit.
Checkmk Synthetic Monitoring is available in the commercial Checkmk editions, but it requires an additional subscription.
You can however test the function with up to three tests free of charge and without a time limit.
With Checkmk you can monitor your own infrastructure very closely — right down to the question of whether a particular service, such as a web server, is running properly. If your website is operated via a third-party cloud service, you will not have access to the service itself, but you can use an HTTP check to verify whether the website is accessible. But will that say anything about the user experience? The fact that an online store is accessible does not mean that navigation, ordering processes and the like work smoothly.
This is where Checkmk Synthetic Monitoring comes in. With the Robotmk plug-in, Checkmk offers genuine end-to-end monitoring, i.e. the monitoring of running applications from the user’s perspective. The actual testing is carried out by the open-source software Robot Framework — of which Checkmk GmbH is also a member.
The automation software can be used to fully replicate a user’s behavior, for example to simulate order processes in online stores, 'click-by-click'.
The special thing about Robot Framework is that tests are not written in a fully-fledged programming language, but are defined using easy-to-use keywords such as Open Browser or Click Button.
An Open Browser checkmk.com is sufficient to call up the Checkmk website.
Several test cases are then combined in so-called test suites (in the form of a .robot file).
Robotmk can now deploy these Robot Framework test suites on the host and monitor their execution and results as services in Checkmk. In the Checkmk web interface you will then find the status, associated performance graphs and the original evaluations of Robot Framework itself.
1.1. Components
Multiple components work together to create this end-to-end monitoring, so here is a brief overview.
Checkmk server
Checkmk Synthetic monitoring is realized via Robotmk, which uses an agent plug-in as a data collector, and the Robotmk scheduler (on the monitored host) for triggering Robot Framework projects. Synthetic monitoring is activated and configured via the Robotmk Scheduler rule. Here you specify which test suites should be executed and how exactly Robot Framework should start them — summarized in a plan. Once deployed, the Robotmk scheduler on the target host ensures the scheduled execution of your Robot Framework suites.
In the monitoring, a number of new services will be generated: RMK Scheduler Status shows the status of the scheduler itself, i.e. whether test suites could be started successfully. There are also services for all configured test plans (such as RMK MyApp1 Plan) and individual tests from test suites (such as RMK MyApp1 Test). The services of the individual tests also include the original Robot Framework reports.
Then there are two optional service rules: Robotmk plan and Robotmk test provide for fine-tuning the plan and test services — for example, to effect status changes at certain runtimes.
Last but not least, there are two rules for KPI monitoring: KPI stands for Key Performance Indicator and in this context means individual keywords. Using the Robotmk KPI discovery rule, keywords can be brought into the monitoring as separate services and evaluated accordingly via Robotmk KPI monitoring. We will show you exactly how keyword monitoring works in a separate chapter below.
Somewhat apart from the normal rules, there is also the Managed robots feature in the Setup area. The short version: Robots that are managed on the Checkmk server and deployed via the Checkmk agent — again, a separate chapter is available for more details on this.
Test machine
You can provide the Robot Framework test suites on a Windows (from Windows 10 or Server 2019) or Linux host. For execution, Robot Framework requires access to their dependencies (Python, libraries, drivers for browser automation and so on). This configuration is independent of Checkmk and can be stored declaratively in a portable package.
This is performed with the open-source command line tool CSM (Checkmk Synthetic Monitoring). You can use CSM on an arbitrary computer. This tool uses your configuration files in YAML format to build virtual Python environments including dependencies and the Robot Framework itself. The Robotmk scheduler running as a background process triggers this build and then executes the tests itself. By the way, all these tasks could also be done with Micromamba alone, but with rather complicated commands. That’s why we developed CSM, a wrapper that makes your work much easier.
Such an automation package with the definition of the execution environment (robotmk-env.yaml), post-installation instructions (robotmk-setup.yaml) and the test suites (tests.robot) is also called a robot.
The scheduler and Micromamba are always distributed with the Checkmk agent, while the automation package is only optional but may already be present on the test host.
CSM, on the other hand, is not required on the test host at all, as it is only used to create and package the configuration.
The great advantage of this Micromamba solution is that the executing test host itself does not require a configured Python environment.
The agent itself is only required for the transfer of results, logs and screenshots. This also enables the monitoring of very long-running or locally very resource-intensive suites — provided that your test host has the corresponding capacities.
And even if it is not directly related to Checkmk: The browser library of Robot Framework uses Playwright — and Playwright does not run on all Linux systems supported by Checkmk. Note the corresponding system requirements (whereas Node.js is provided by CSM/Conda in our case).
System requirements for the test machine:
CPU: at least 4 cores, 8 cores recommended
RAM: 8 gigabytes, 16 gigabytes recommended
Internet access (if packages are to be downloaded)
For web-based tests (Robot Framework browser library, based on Playwright) Debian 12/13, Ubuntu 22.04/24.04
CSM is an interface for the Micromamba package manager, developed in-house by Checkmk. Micromamba is a portable mini version of Mamba, which is a re-implementation of Conda. In everyday language, virtual environments are often simply referred to as Conda environments. This refers to the Conda format, not the tooling! A Conda environment can therefore originate from Micromamba, as in our case. In this article, we therefore refer to a Conda environment, although the technically correct term would be a Conda-compatible environment via Micromamba. |
2. Monitoring test suites with Robotmk
In the following, we will show you how to include a test suite in the monitoring. As an example we will use a simple Hello World suite which only outputs two strings and which waits briefly between each. An introduction to Robot Framework is of course not the subject of this article, but a brief look at the automation package and the demo test suite is necessary so that you can see which data ends up where in the monitoring.
The example runs on the basis of CSM/Conda, so that the Windows host does not have to be configured separately.
The micromamba.exe is deployed with the agent and can be found under C:\ProgramData\checkmk\agent\bin\.
Our demo test suite will be created using CSM, including all of the necessary configuration files to help you get started. First, CSM must be installed on any computer:
Download from CSM.
Unpack the archive
Copy the CSM executable to a directory that is in your system’s
PATH.
To test:
Now the complete demo automation package mybot1 can be created with a single command:
The suite directory:
.gitignore
robot.toml
robotmk-env.yaml
robotmk-setup.yaml
sample.robot
The suite’s file directory will now contain several files:
robotmk-env.yaml: Definition of the execution environmentrobotmk-setup.yaml: Instructions that will be processed after the execution environment has been createdsample.robot: Demo test suiterobot.toml: Optional configuration file for the VS Code plug-in RobotCode.robot.toml: Overwrites therobot.tomlsetting on the local computer if necessary (should therefore not be included in the version control system)..gitignore: Excludes some standard files/folders for Git (such as Robot Framework reports, archives, etc.)
In this case, only the Python, Pip, and Robot Framework (compatible up to version 7.3) dependencies will be installed for the environment.
The environment build later appears in the monitoring as RCC/Conda environment build status (as a reminder: RCC was the at first implemented solution before Micromamba/Conda). The tests can only be processed and consequently monitored if the environment has been built successfully.
The actual test suite now looks like this:
*** Settings ***
# Import Libraries, Resource files, and other settings here
*** Variables ***
# Define variables here
*** Test Cases ***
# One or more test cases
Test1
Show Greeting
*** Keywords ***
# User-Defined keywords
Show Greeting
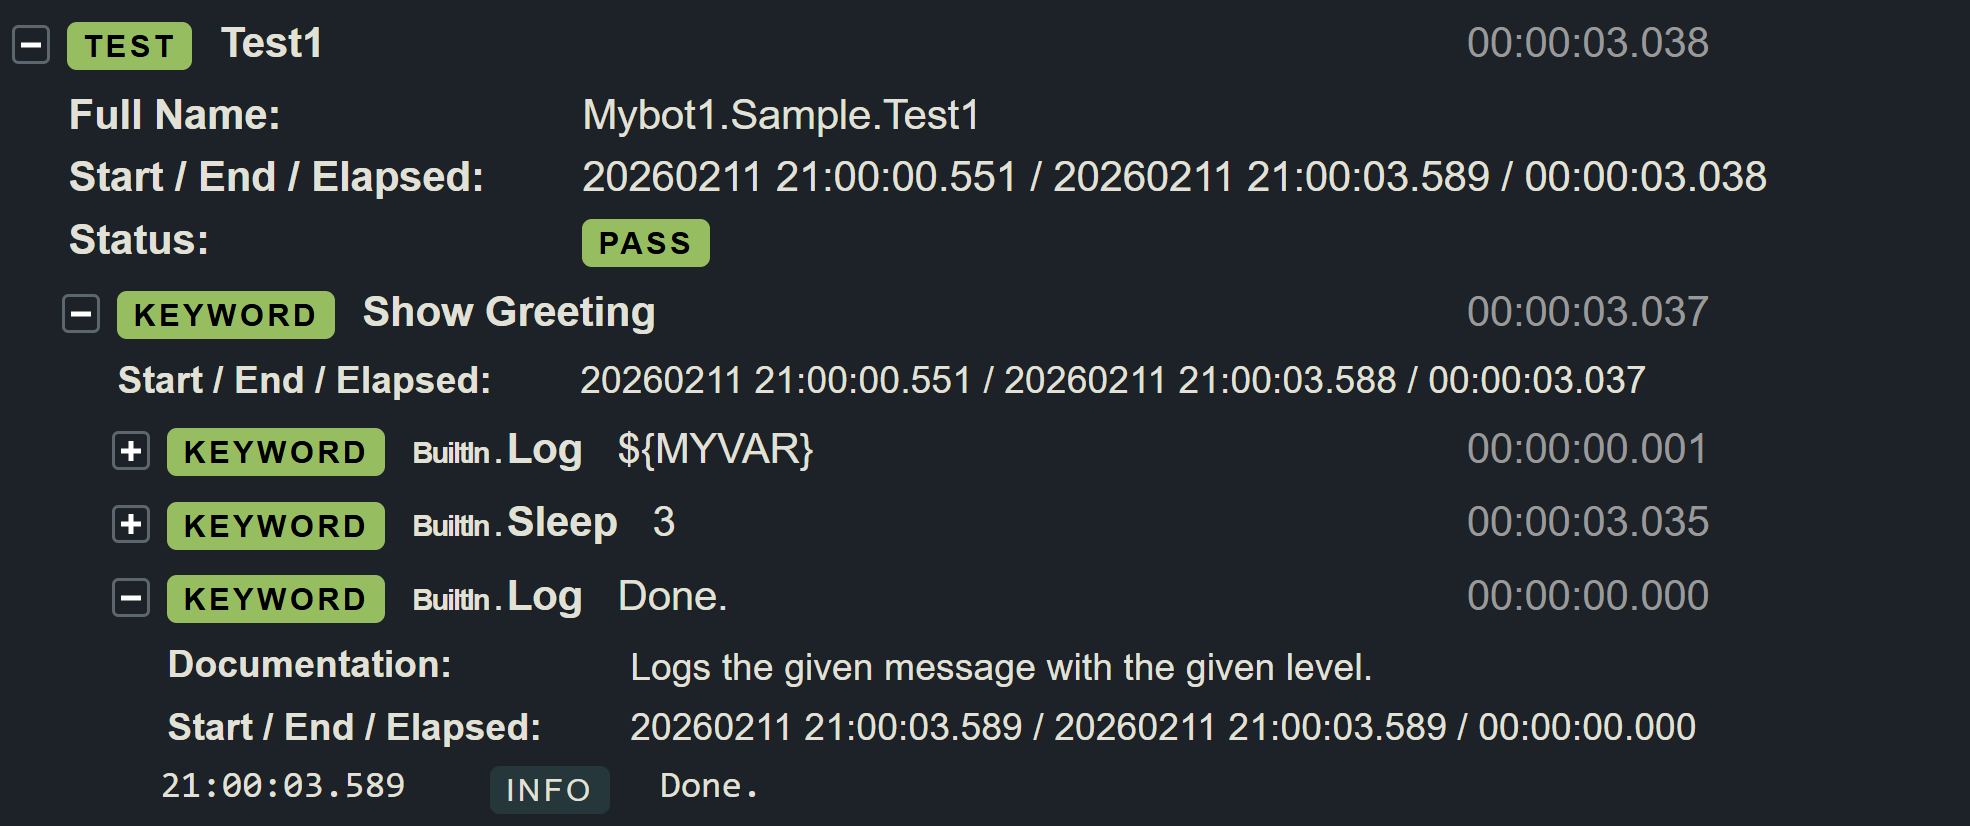
Log Hello World!So here, only the usual “Hello World!” is returned.
For this article, we have modified the test slightly so that we can show a few informative images from the monitoring and variables later on. Here is the updated part of the test:
...

*** Variables ***
# Define variables here
${MYVAR}    Hello Checkmk!

...

Show Greeting
    Log  ${MYVAR}
    Sleep    3
    Log      Done.
Now the value of the variable MYVAR is outputted, then there is a 3-second wait, and finally Done is outputted.
You can set the value of the variable later in the Checkmk web interface — otherwise, the default value Hello Checkmk! set here will be used.
2.1. Running the test suite manually
You can also run test suites directly with CSM without Checkmk. However, the tool must first be set up for this purpose — specifically for the shell you are using. You can specify your shell manually or let CSM detect it itself:
CSM provides detailed instructions on how to integrate it into your shell — here using PowerShell as an example:
CSM is essentially a wrapper for Micromamba. The Init command is used to configure the relevant settings and write them directly to the shell configuration so that the settings remain in place throughout the session. If you want to see which code is generated and written to the shell configuration, simply execute the CSM command solo for your shell:
CSM is now ready for use, and you can start working with virtual environments. In the folder containing your CSM automation package, execute the following command to create the environment:
A useful first command would be to list the available virtual environments:
If your system contains other virtual environments in Conda format, for example from the RCC tool previously used in Checkmk or another Venv manager, the command may result in error messages regarding missing permissions — after all, CSM cannot access external files. This does not affect the other functions of CSM. |
Now it is time to activate the environment you have created:
Once activated, you can execute Robot Framework commands directly in the virtual environment (robot --version).
But of course, this can also be done without manual activation:
In practice, the Robotmk scheduler operates directly with Micromamba on the test host without CSM.
2.2. Configure a rule for the agent plug-in
You can find the Robotmk scheduler under Setup > Agent rules > Robotmk scheduler (Windows). As the rule is quite extensive, here is a look at the empty configuration:
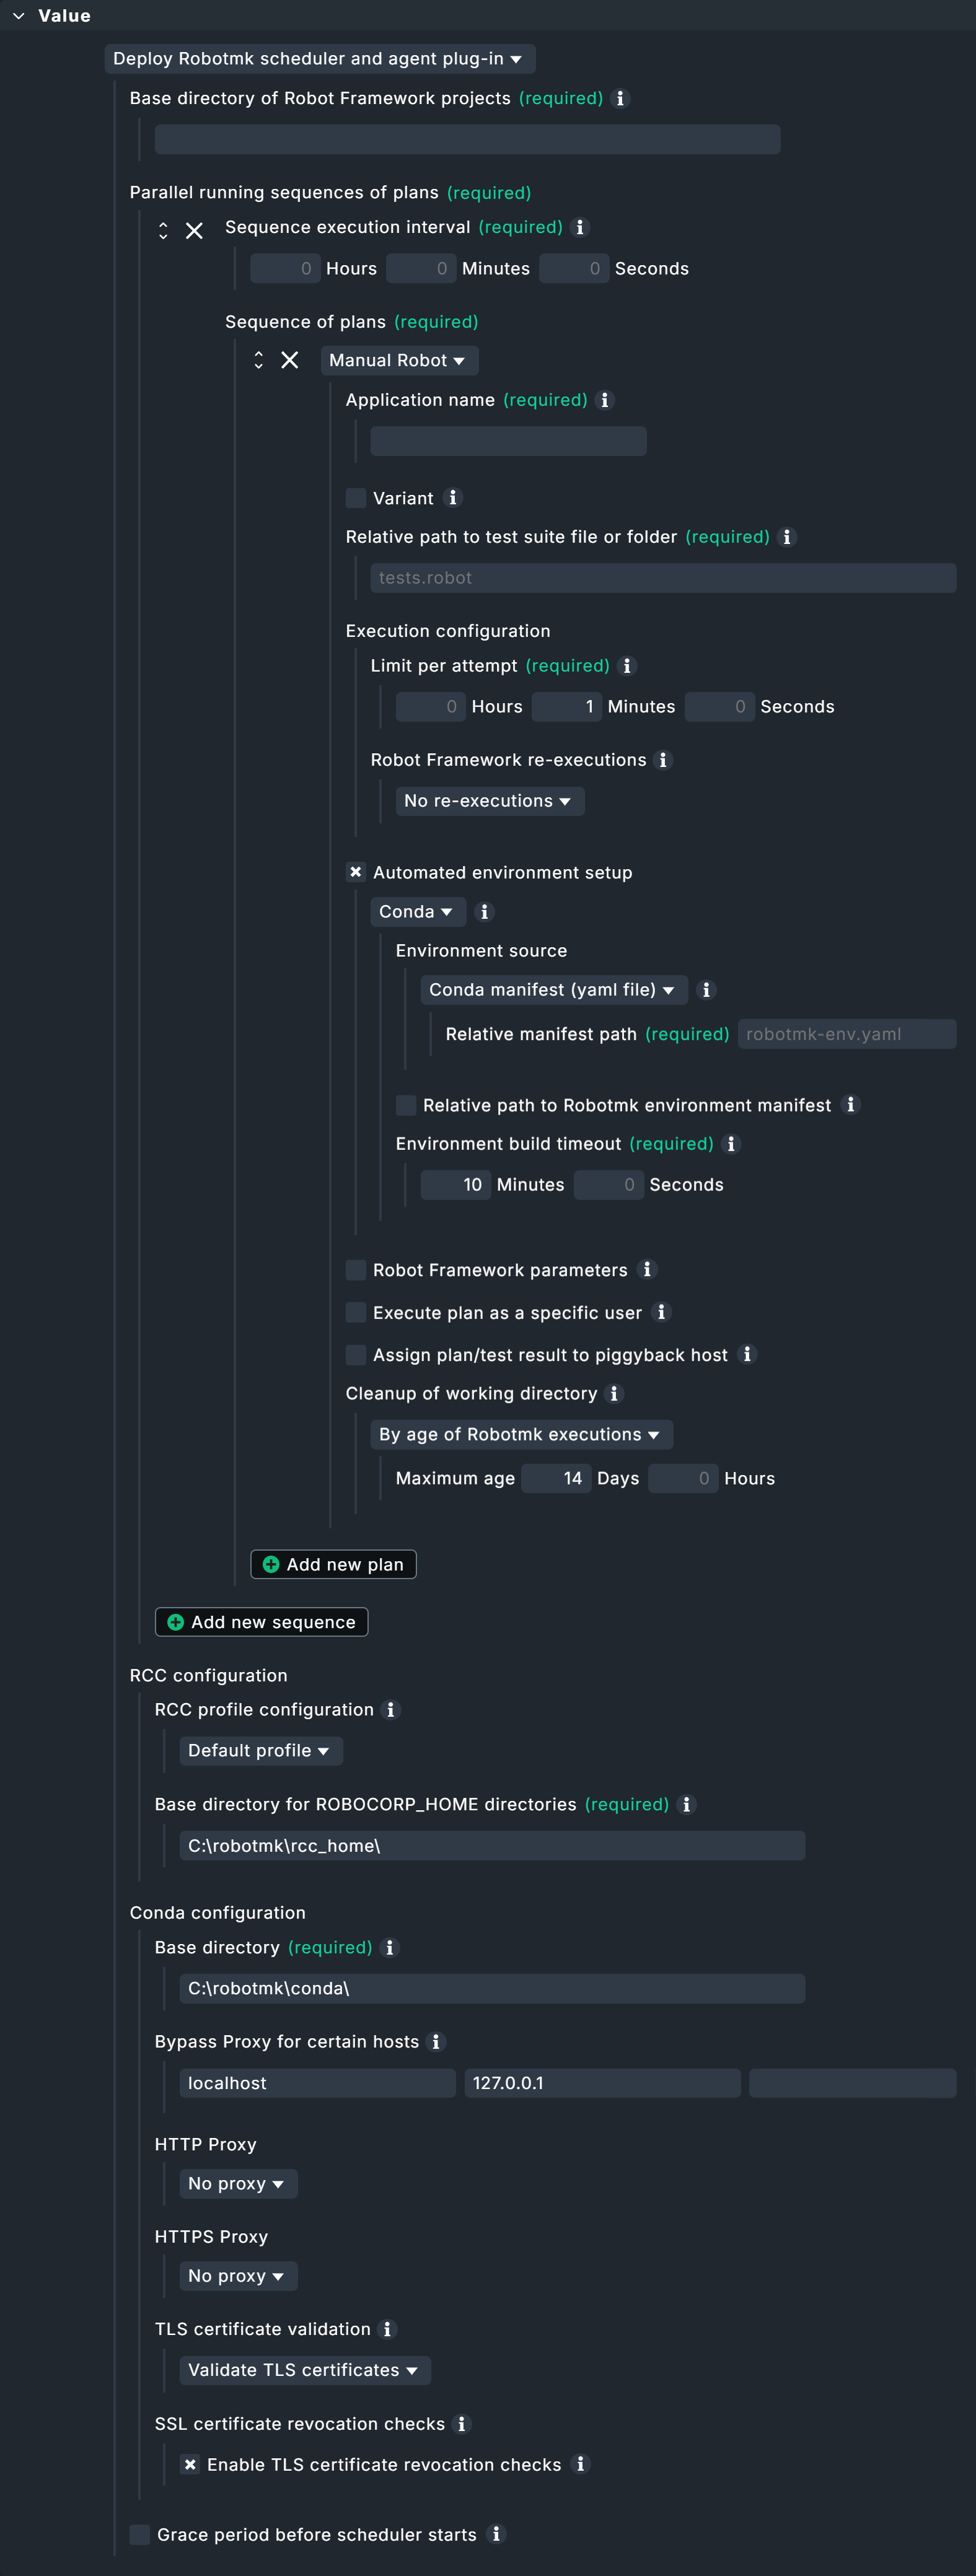
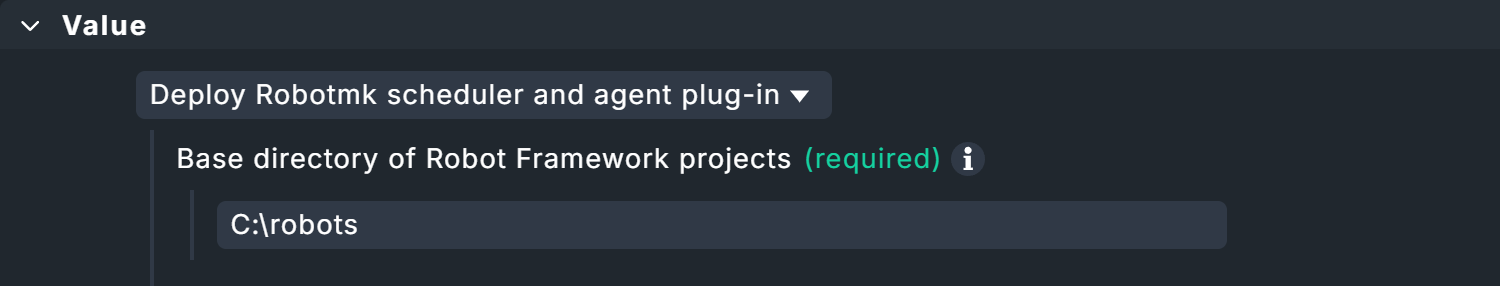
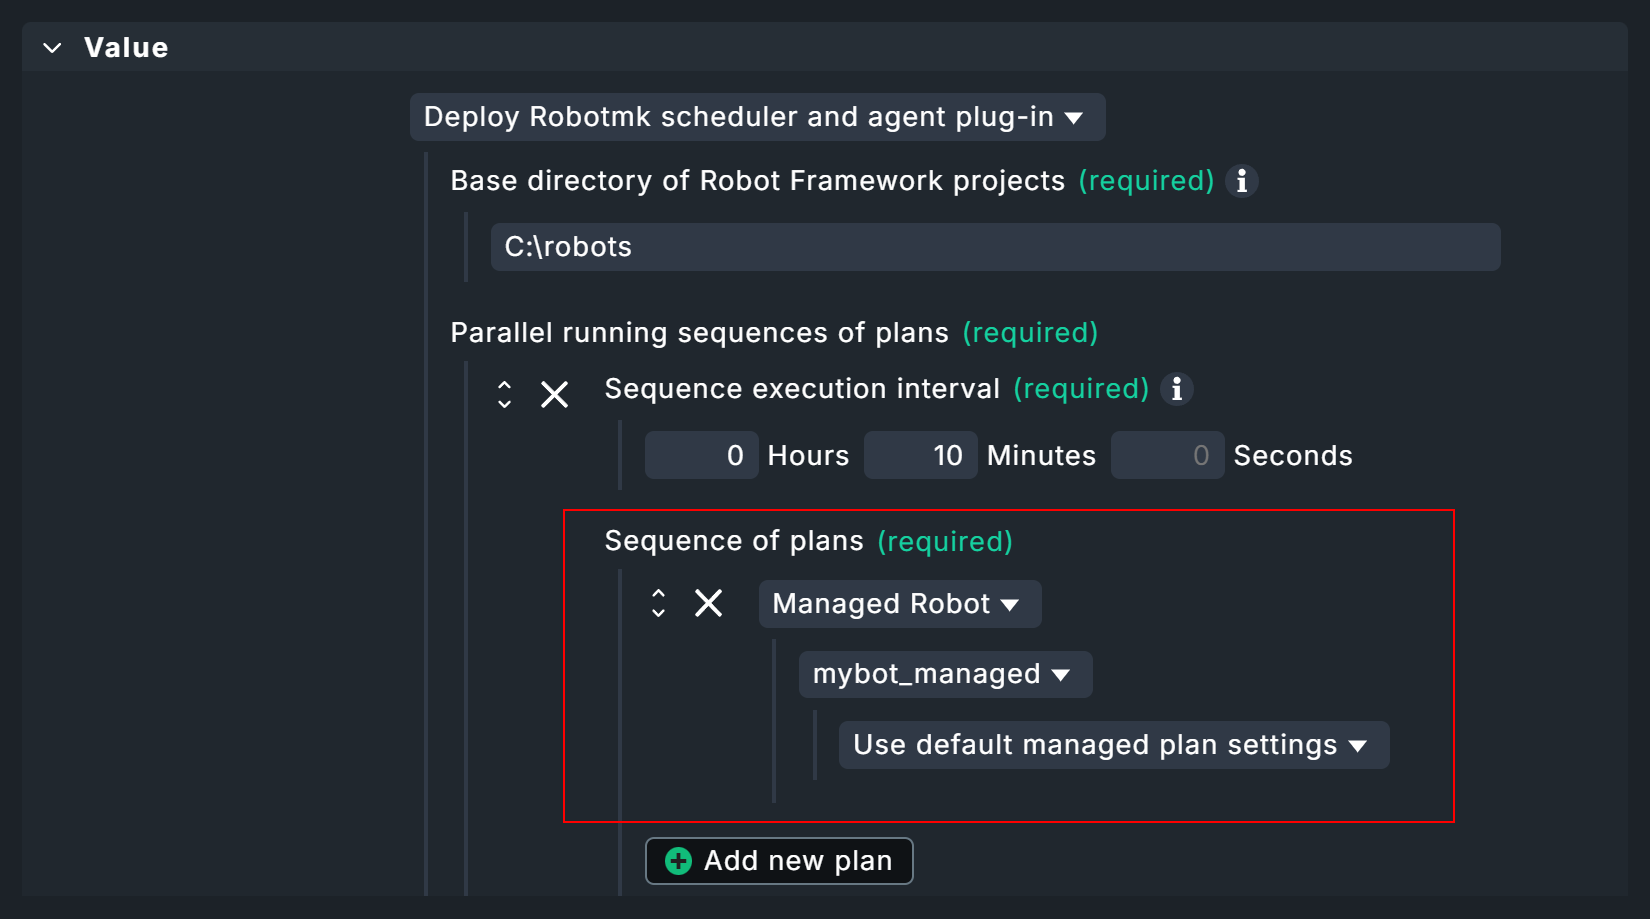
First, the scheduler requires the base directory in which all your test suites are located.
Enter this arbitrary, explicit file path under Base directory of suites, for example C:\robots.
The Parallel running sequences of plans that are shown now are a Checkmk-specific concept.
To explain this, we must first go down one hierarchy level: Here you can see the item Sequence of plans. Such a sequential plan defines which suites are to be executed with which parameters. Robot Framework will process these suites one after the other. The reason for this is simple: in practice, tests are sometimes run on the desktop and several test suites could get in each other’s way at the same time (think of them stealing each other’s control of the mouse cursor).
The Parallel running sequences of plans are now an encapsulation for multiple of such sequences — and are themselves executed in parallel. Again, the reasoning is simple: this allows test suites that do not rely on the desktop to be executed in their own sequences without delay — the test suite used in this article is a good example of such processing.
Back to the dialog: The only explicit setting is the execution interval, which you set under sequence execution interval.

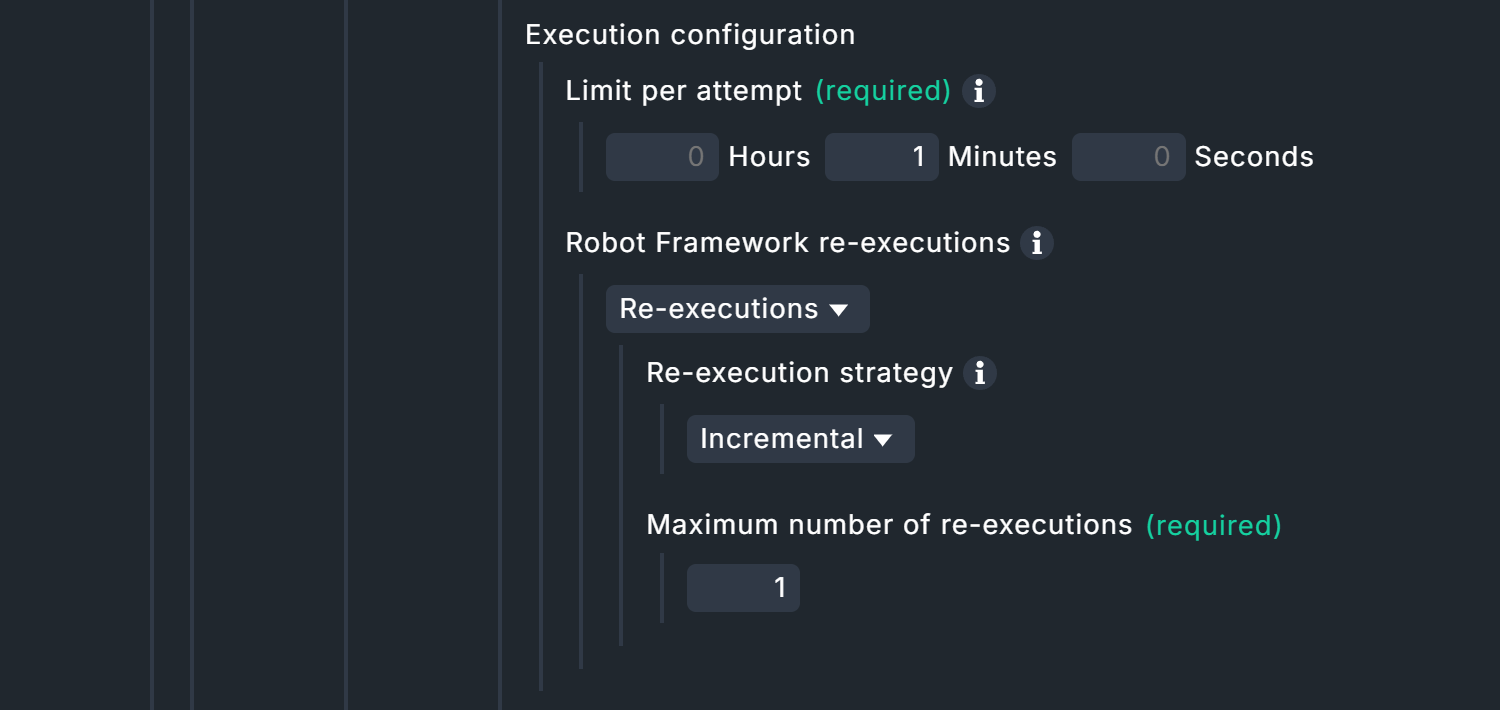
The plans in the sequence naturally have their own runtimes, determined by the timeout of a single execution and the maximum number of repeated executions in the event of failed tests. The execution interval of the sequence sequence must therefore be greater than the sum of the maximum runtimes of all plans in the sequence. The maximum runtime of a sequence is calculated as follows: Limit per attempt × (1 + Maximum number of re-executions). |
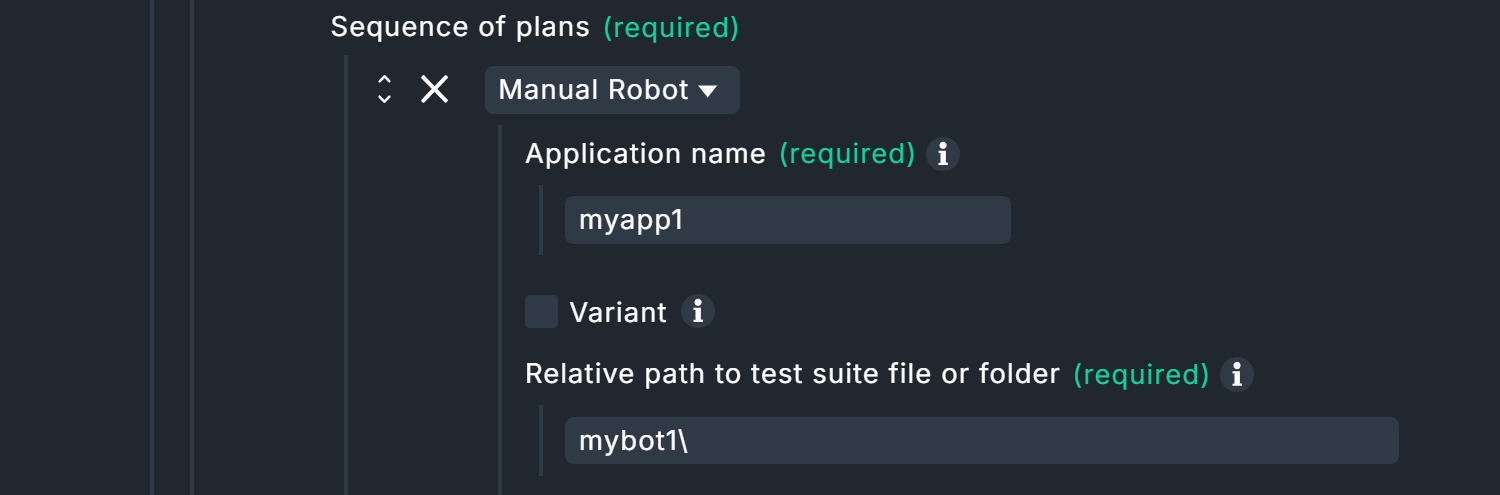
Now it’s time to configure the first plan.
You can enter any name under Application name.
This name does not have to be unique!
The name of the application to be monitored makes sense here, for example OnlineShop, or here in this example simply MyApplication.
Of course, it can happen that this online store is tested several times, either by other test suites or by the same test suite with different parameters.
In such cases, the Variant field is used to achieve unambiguous results despite identical names.
For example, if the application OnlineShop is tested once in German and once in English (via corresponding parameters), you could use corresponding abbreviations here.
The monitoring will then return results for My OnlineShop_en and My OnlineShop_de.
However, the specification under Relative path to test suite file or folder is necessary.
The path is relative to the base directory specified above, e.g. mybot\test.robot for C:\robots\.
Alternatively, a directory (with several robot files) can also be specified here, in which case it would simply be mybot.
Continue with the Execution configuration. Under Limit per attempt you define the maximum elapsed time — per attempt — that a test suite may run. With Robot Framework re-executions you can now instruct Robot Framework to repeat test suites completely or incrementally if tests fail. If the individual tests in a test suite are independent of each other, the incremental strategy is the best way to save time. If, on the other hand, the test suite tests a logical sequence, such as "Login > Call up product page > Product in shopping cart > Checkout", the test suite must of course be completely reprocessed. In the end, there is always only one result.
In the case of complete retries, only the results from self-contained suites are taken into account for the final result: If a test fails on its final retry, the test suite is counted as a failure. In the case of incremental retries, the final result is made up of the best partial results: If some tests only run successfully on the third attempt, the final result is also counted as a success. Reminder: The combination of attempts and maximum run times of all plans in a sequence determines their minimum execution interval.
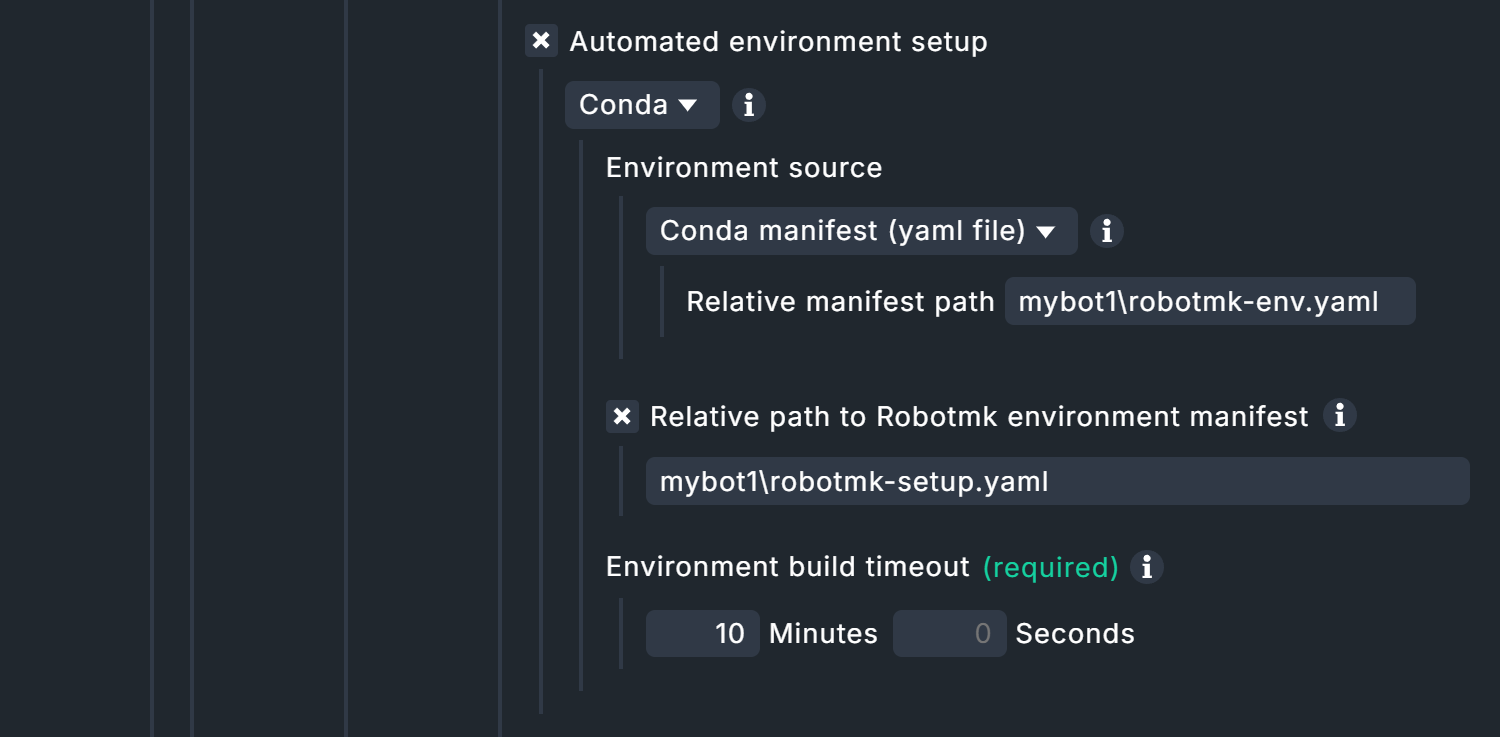
By default, execution via Conda is activated under Automated environment setup, for which you must enter three values.
Firstly, Conda requires the specification of where the robotmk-env.yaml file is located.
This file is responsible for setting up the Python environment, i.e. installing Python and dependencies.
This specification is relative to the base directory that you have set above under Relative path to test suite file or folder.
The YAML files can be saved in subdirectories, but best practice is the top suite directory.
For the above base directory C:\robot\ and the suite directory C:\robot\mybot1 it is accordingly mybot1\robotmk-env.yaml.
This is followed by the path specification for robotmk-setup.yaml, which contains instructions to be executed after the Conda environment has been built — but only if you are using this file, of course.
With regard to the following time limit Environment build timeout for building the Python environment, please note that large volumes of data may need to be downloaded and set up. The required browsers in particular can quickly add up to several hundred megabytes — but only during the initial run.
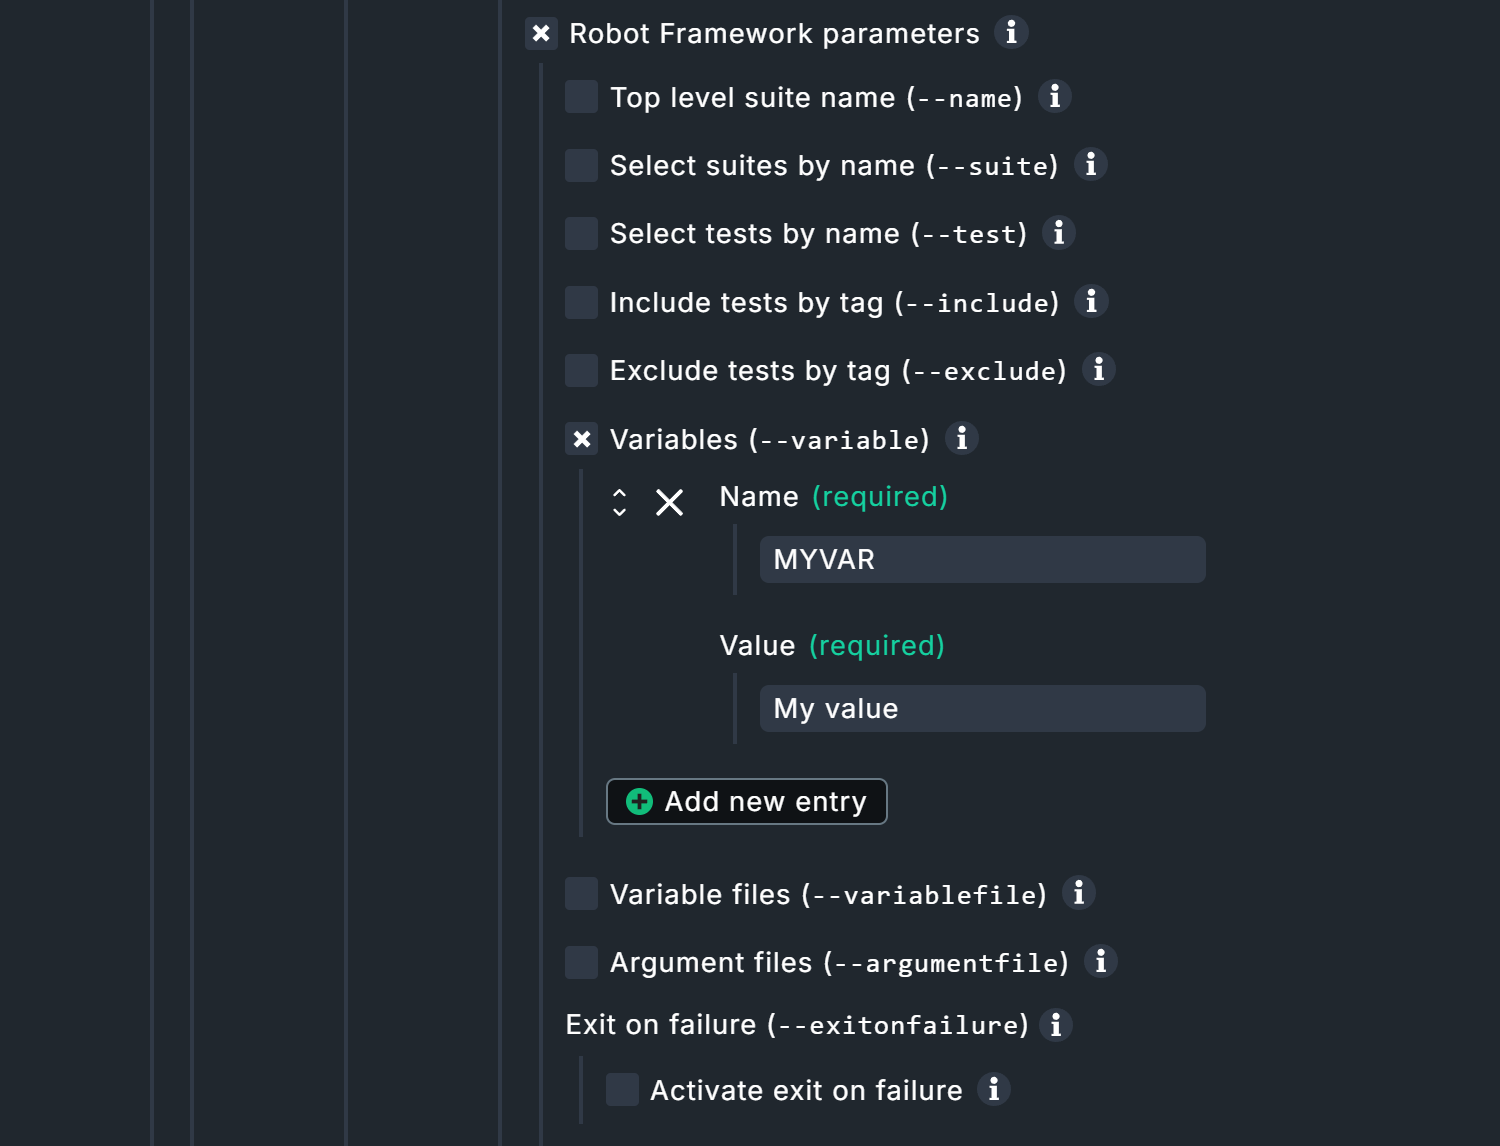
Under Robot Framework parameters you have the possibility to use some of the command line parameters of Robot Framework (which are also displayed by the command robot --help).
If you want to use additional parameters, the option Argument files will help.
A file specified here can contain any robot parameters.
Further information about the individual parameters can be found in the inline help.
For our example project, only the option Variables is activated and a variable MYVAR with the value My Value is set.
Remember the command Log ${MYVAR} at the top of the file sample.robot?
This is the corresponding reference.
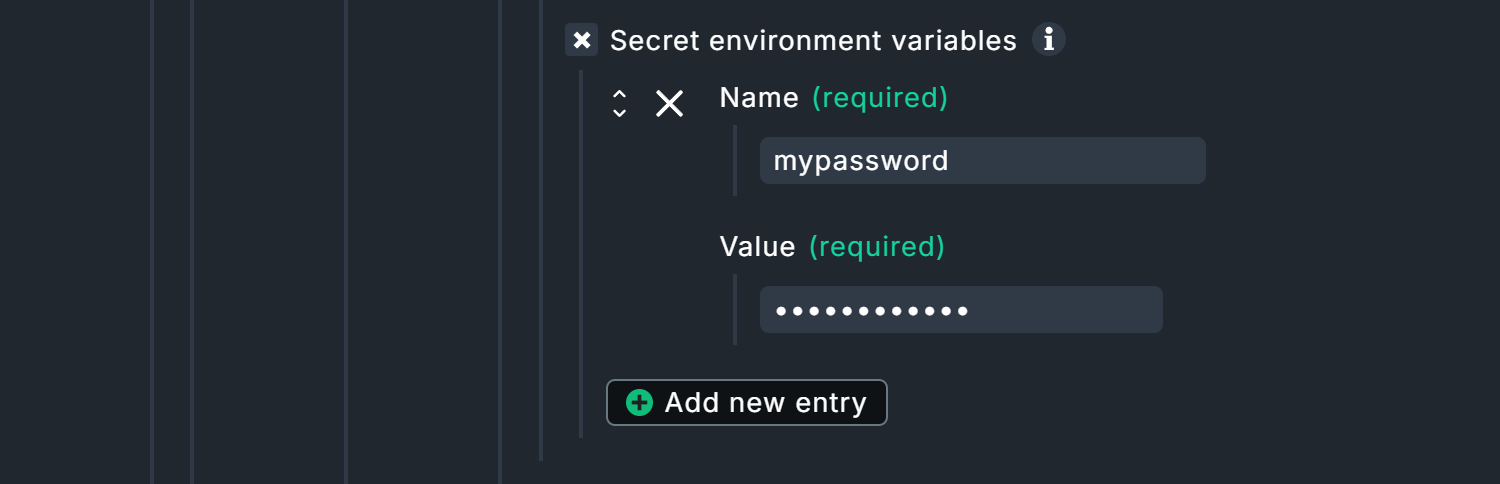
robot commandThe Secret environment variables option deserves special attention as it is not an original Robot Framework function.
You can set secret environment variables here, intended for example for passwords in conjunction with the CryptoLibrary Robot Framework library.
The variables set here do not appear in logs, but are written in plain text to the Checkmk configuration files on the respective test hosts.
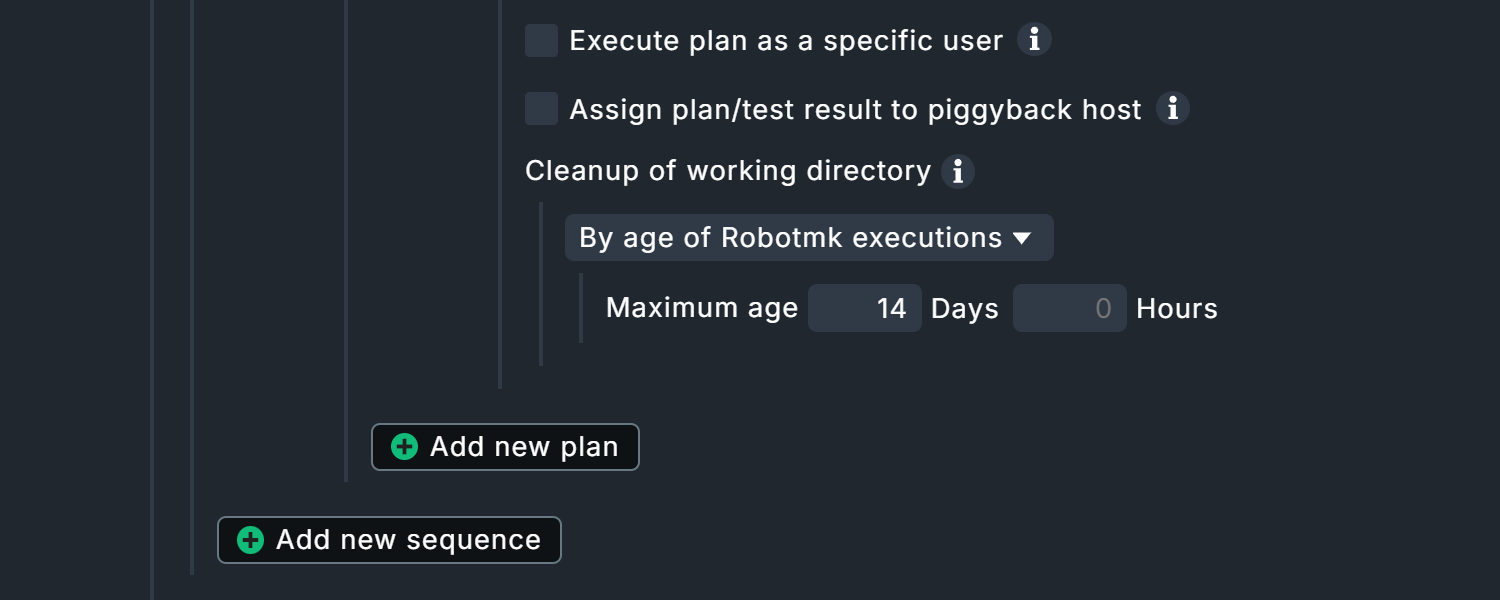
At the end of the suite configuration, there are three largely self-explanatory options.
The first option exists exclusively for Windows hosts. Execute plan as a specific user allows Robotmk to be executed in the context of a specific user account. Background: By default, Robotmk is executed in the context of the Checkmk agent (LocalSystem account), which has no authorization to access the desktop. Here a user can be specified who must be permanently logged in to a desktop session and who has access to graphical desktop applications accordingly.
However, do not be too hasty: browsers are an exception here! They can run and render web pages in headless mode. You should only check the box for a specific user if a dedicated desktop application is launched outside of browsers — not least for security reasons.
With Assign plan/test result to piggyback host the results of the plan/test can be assigned to another host. For example, if Robot Framework is testing the ordering process of an online store, the results can be assigned to the corresponding web server.
Each test run produces data that is stored under C:\ProgramData\checkmk\agent\robotmk_output\working\suites\.
By default, results from the last 14 days are retained, but you should bear in mind that large volumes of data can quickly accumulate here.
At least 500 kilobytes of data are generated per run — with more complex test suites and embedded screenshots, for example, this can quickly add up to several megabytes of data.
Depending on the execution interval, the size of the report and your documentation requirements, you should intervene in such a situation.
Once here, you can now create further plans in this sequence or further sequences.
At the end there are two more options, which in turn relate to the complete Robotmk scheduler configuration.
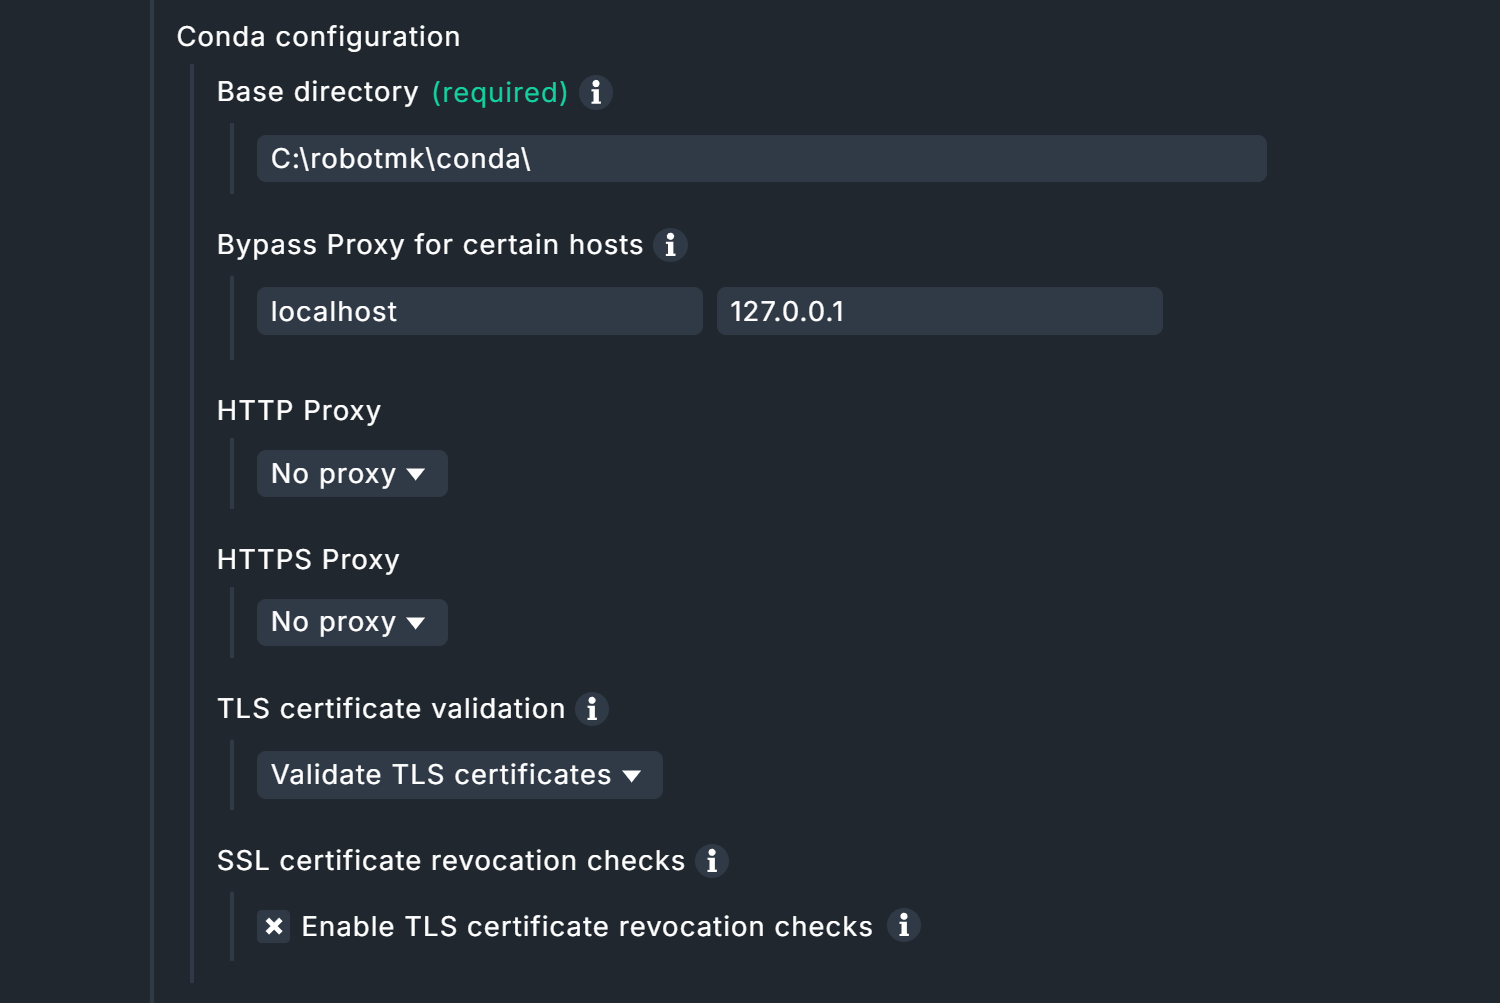
Conda configuration allows you to specify proxy servers, TLS and SSL certificates, as well as hosts to be excluded.
Grace period before scheduler starts can also be very useful: The scheduler starts when the test host is restarted together with the Checkmk agent before the desktop logon — which, of course, means that any tests on the desktop must fail. A grace period can be used to delay the start manually so that, for example, the technical user’s desktop becomes active (again) via autologin (Windows function for logging in without manual password entry).

This completes the configuration and you can bake a new agent with the plug-in, and then deploy, manually or via the automatic agent updates.
Data in the agent output
The output in the agent is quite extensive:
error messages, status, configuration and test data are transmitted in several sections.
The latter can be found in the robotmk_plan_execution_report section, here is an abbreviated excerpt:
<<<robotmk_plan_execution_report:sep(0)>>>

{
  "plan_id": "myapp1_mybot1",
  "timestamp": 1770825600,
  "attempts": [
    {
      "index": 1,
      "outcome": "AllTestsPassed",
      "runtime": 0
    }
  ],
  "rebot": {
    "Ok": {
      "xml": "<?xml version=\"1.0\" encoding=\"UTF-8\"?>\r\n
<robot generator=\"Rebot 7.3 (Python 3.12.3 on win32)\" generated=\"2026-02-11T17:00:00.879104\" rpa=\"false\" schemaversion=\"5\">\r\n
  <suite id=\"s1\" name=\"Mybot1\" source=\"C:\\Users\\User\\mybot1\">\r\n
    <suite id=\"s1-s1\" name=\"Sample\" source=\"C:\\Users\\User\\mybot1\\sample.robot\">\r\n
      <test id=\"s1-s1-t1\" name=\"Test1\" line=\"10\">\r\n
        <kw name=\"Show Greeting\">\r\n
          <kw name=\"Log\" owner=\"BuiltIn\">\r\n
            <msg time=\"2026-02-11T17:00:00.452281\" level=\"INFO\">
              Hello World!
            </msg>\r\n
            <arg>Hello World!</arg>\r\n
            <doc>Logs the given message with the given level.</doc>\r\n
            <status status=\"PASS\" start=\"2026-02-11T17:00:00.452281\" elapsed=\"0.000000\"/>\r\n
          ...

  <statistics>\r\n
    <total>\r\n
      <stat pass=\"1\" fail=\"0\" skip=\"0\">All Tests</stat>\r\n
    </total>\r\n
    <tag>\r\n
    </tag>\r\n
    <suite>\r\n
      <stat name=\"Mybot1\" id=\"s1\" pass=\"1\" fail=\"0\" skip=\"0\">Mybot1</stat>\r\n
      <stat name=\"Sample\" id=\"s1-s1\" pass=\"1\" fail=\"0\" skip=\"0\">Mybot1.Sample</stat>\r\n
    </suite>\r\n
  </statistics>\r\n

  <errors>\r\n
  </errors>\r\n

</robot>\r\n",

      "html_base64": "PCFET0NUWVBFIGh0bWw+DQo8aHRtb...
	 ...
Two areas are of particular interest here.
Firstly, rebot: The rebot tool has produced the actual status report for Robot Framework from several partial results (hence re-bot).
Secondly, the last line html_base64: The HTML reports from Robot Framework are then base64-encoded.
Screenshots taken via tests are also transferred in this way — the output/data volume in the agent can be correspondingly extensive.
Data in monitoring
As soon as the Robotmk scheduler and the test suite have been run, the service discovery will produce three new services:
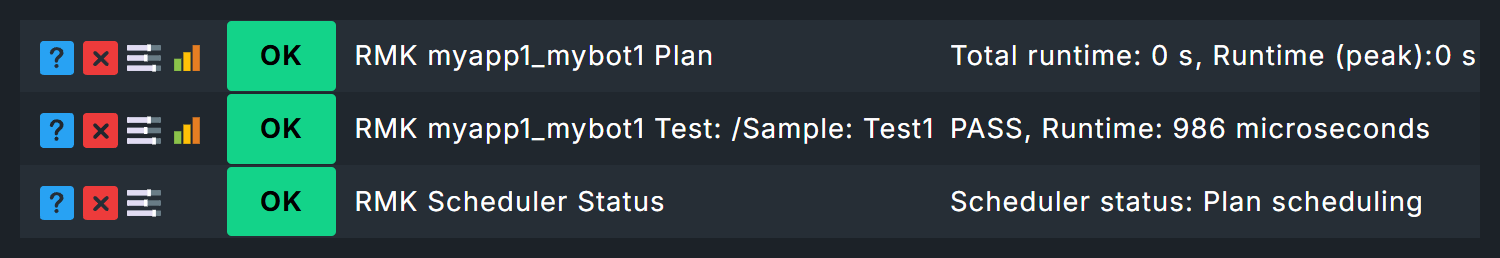
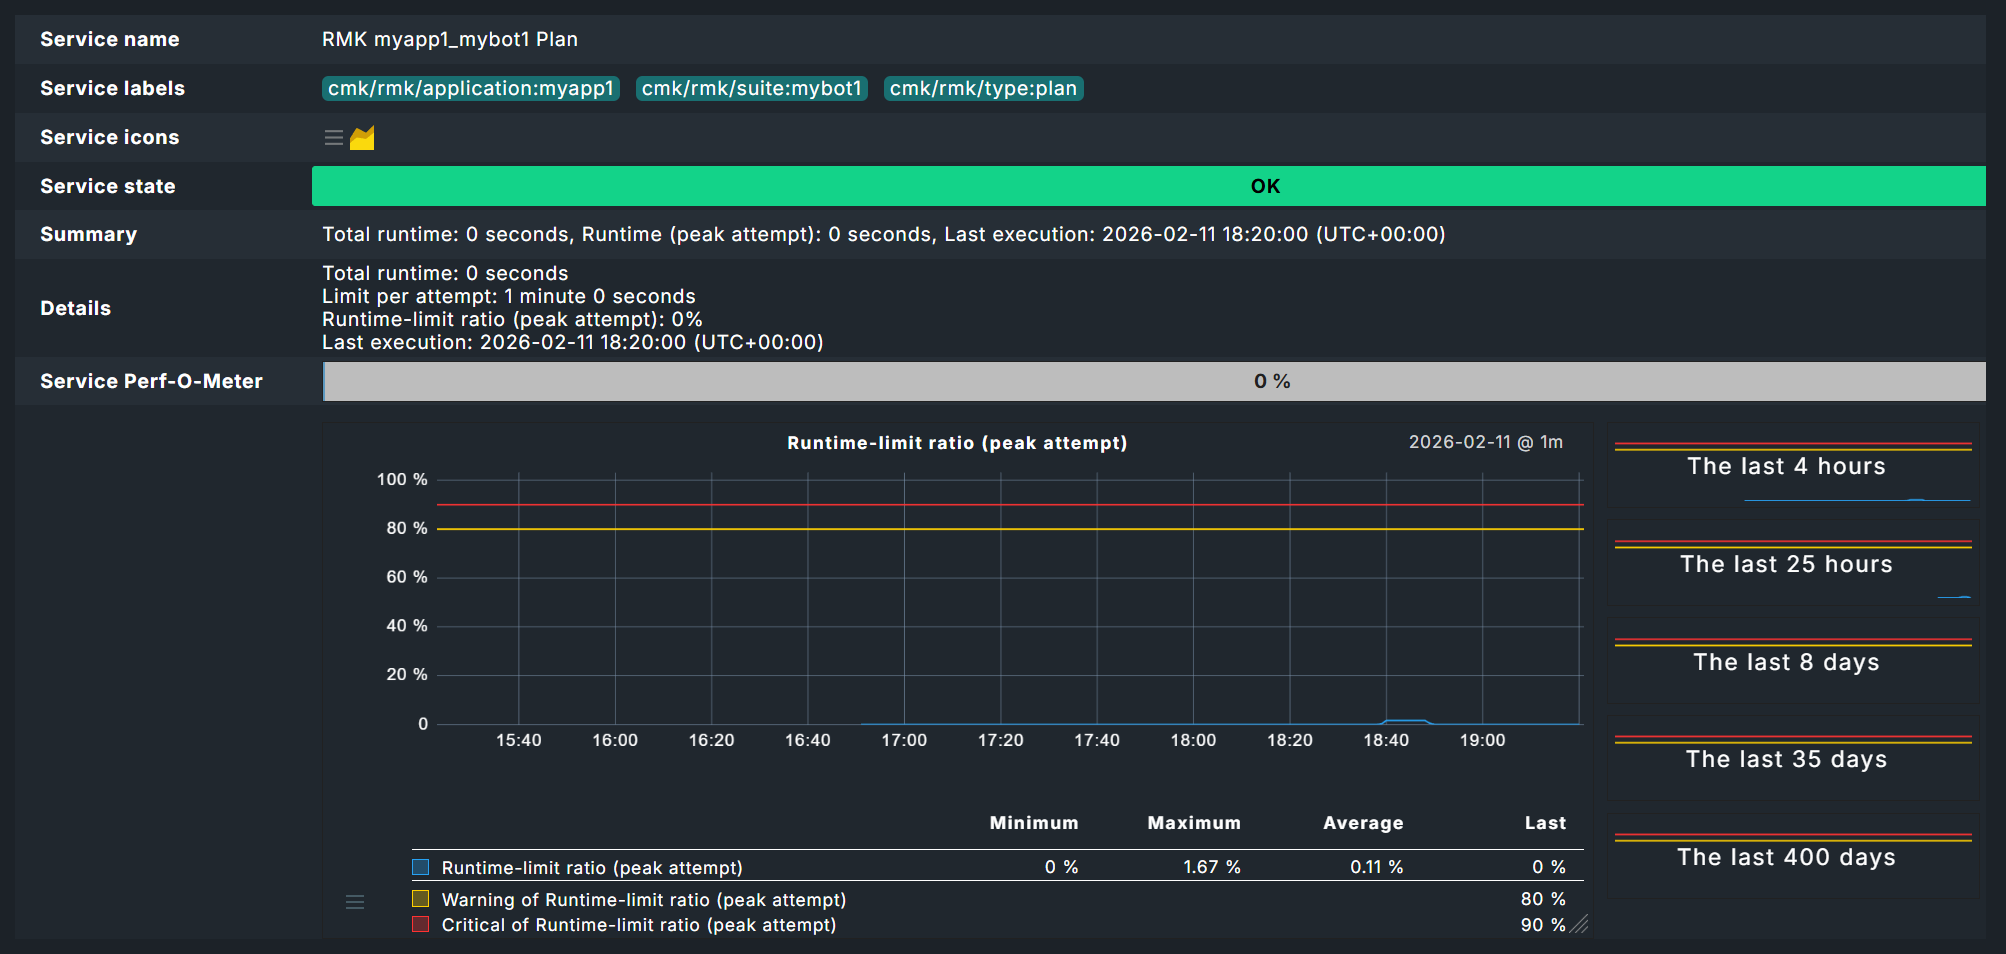
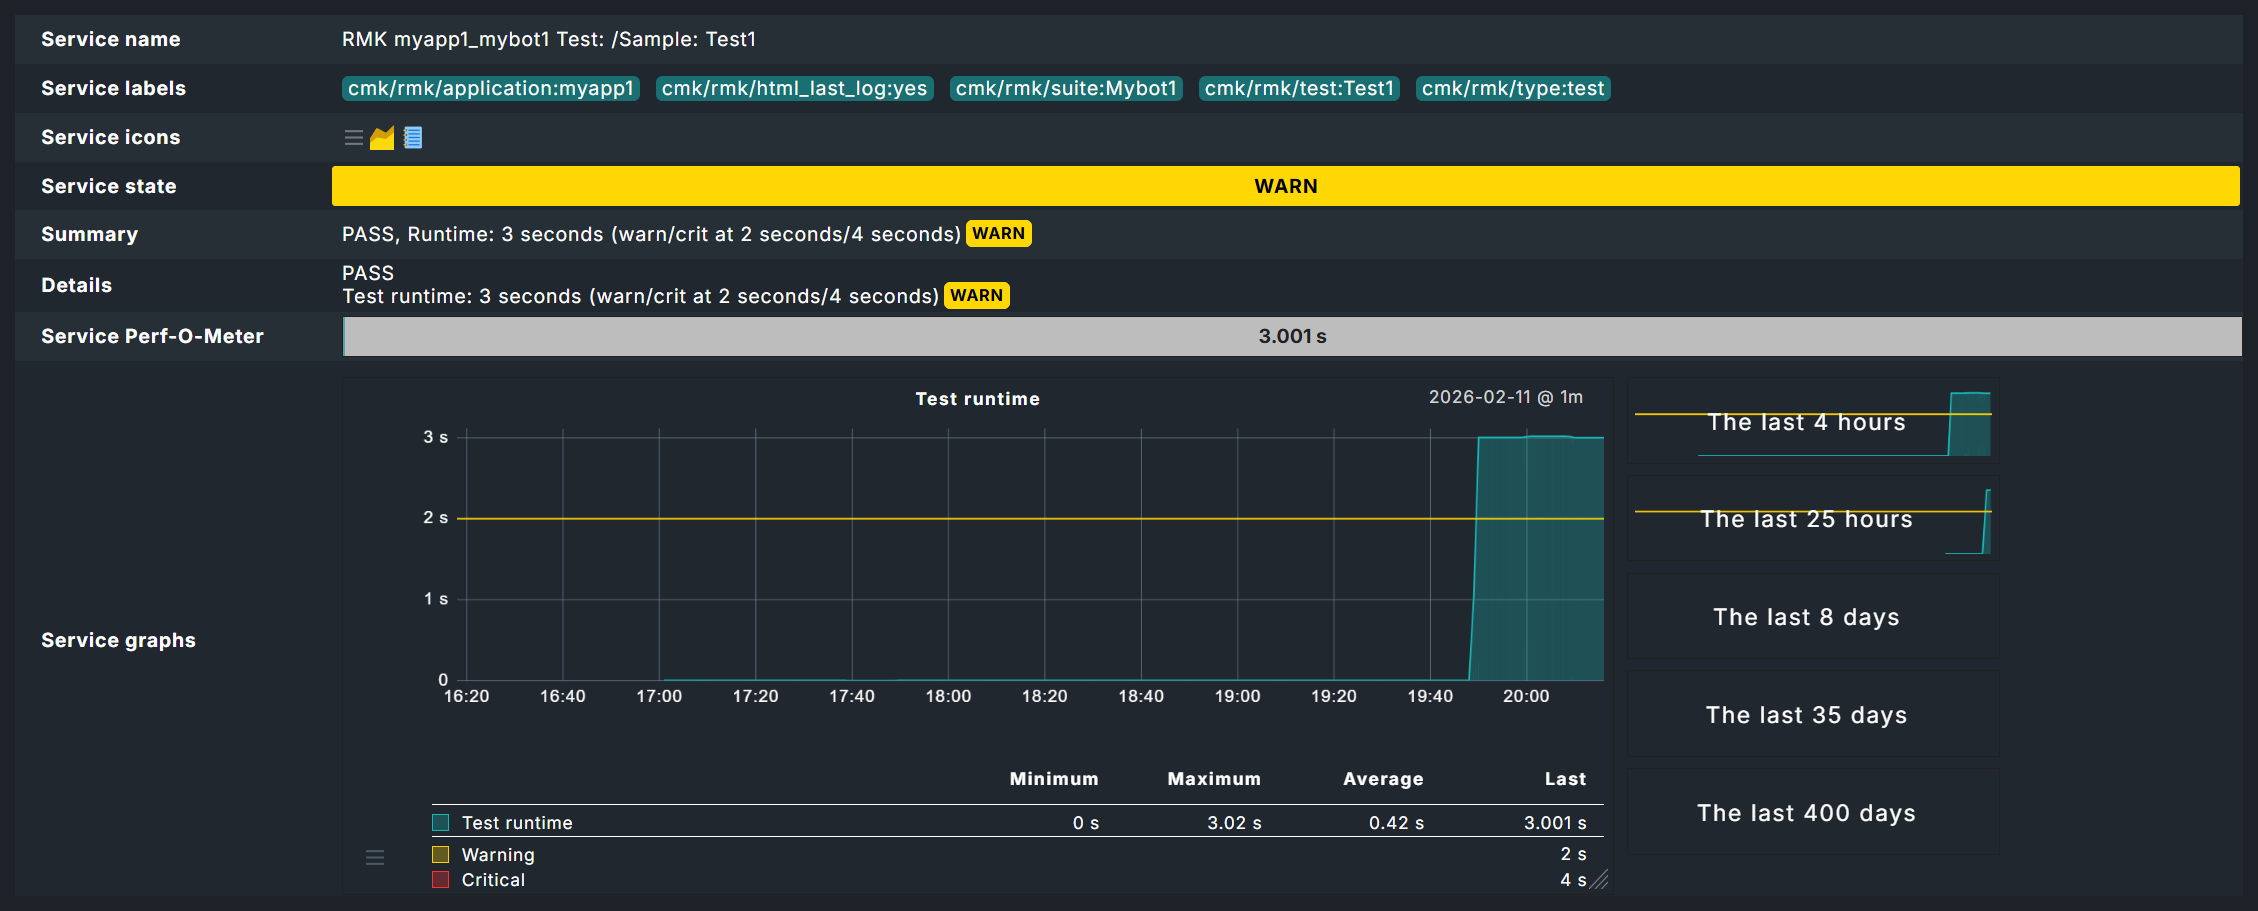
The service RMK Scheduler Status exists once and immediately after deployment. The services for plans and tests, here RMK myapp1_mybot1 Plan and RMK myapp1_mybot1 Test: /Sample: Test1, are added to the monitoring as soon as the associated suites have been run for the first time.
|
Be careful with very long keywords! Keywords in Robot Framework tests are not subject to any length restrictions—sometimes a keyword is an entire sentence. The keywords determine the names of the associated services in Checkmk. The service names, in turn, determine the file paths and names in the Round Robin database. With very long keywords, file system limitations may be exceeded, which can lead, for example, to invalid paths resulting in missing data in monitoring. The same applies to KPIs. We recommend keeping the names for test cases and KPIs reasonably short for the time being. |
2.3. Configuring service rules
Creating a rule for the plan status
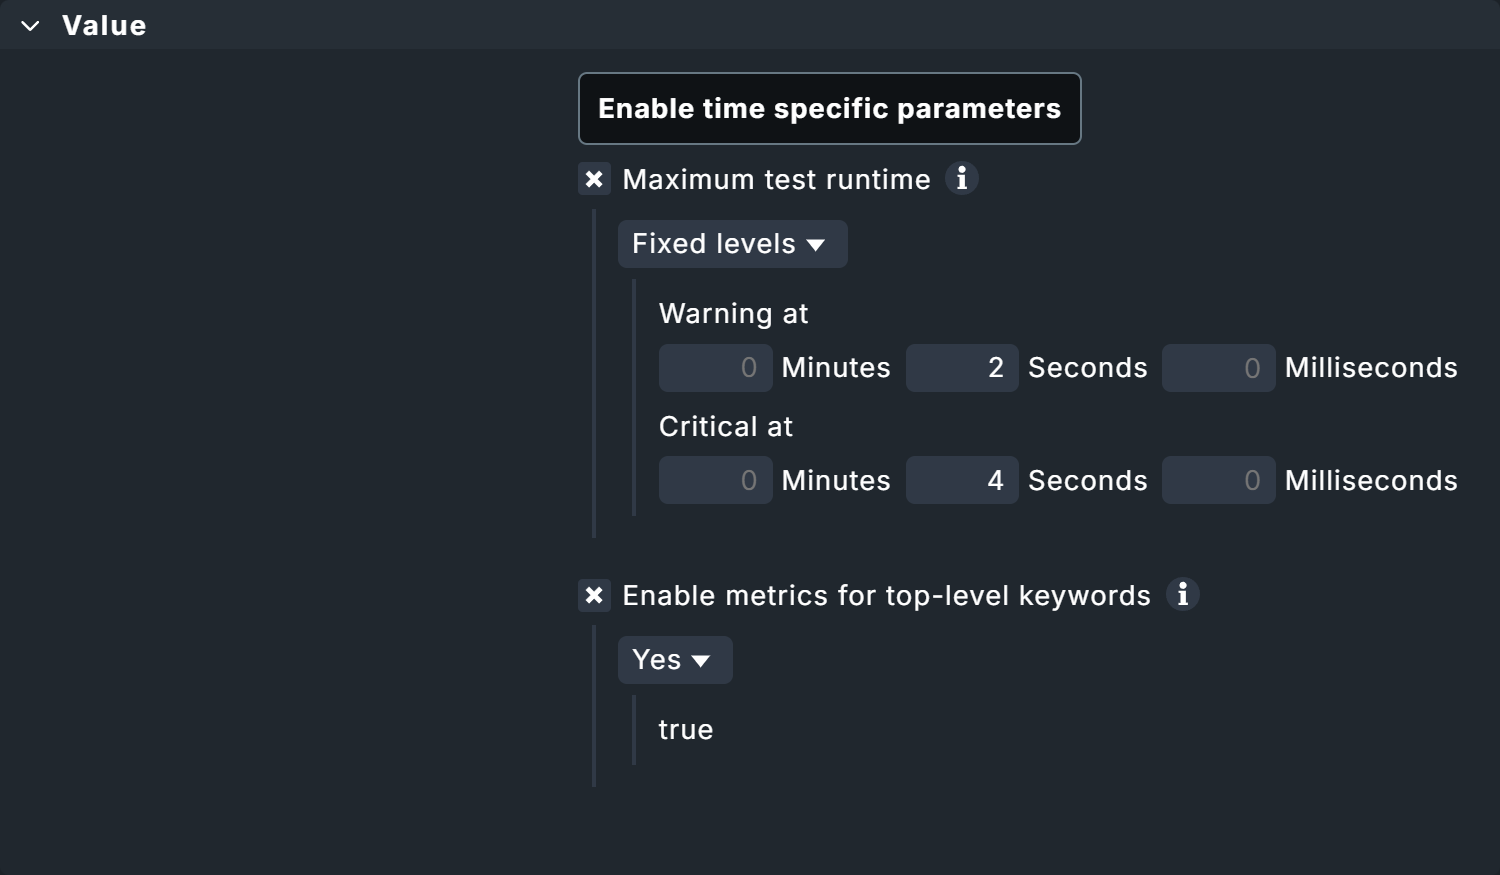
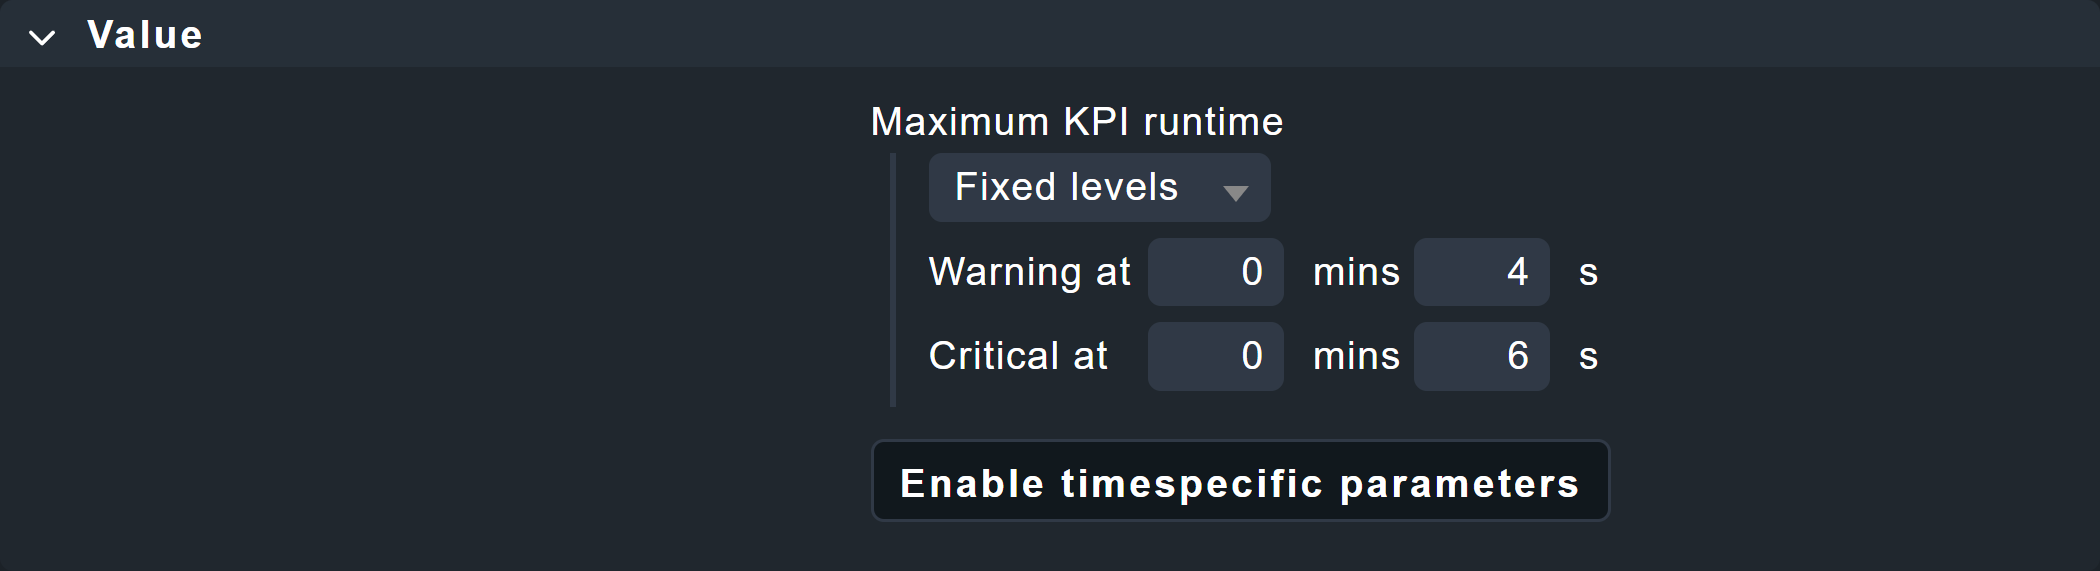
Reminder: Maximum runtimes for plans were defined in the agent rule above. These runtimes can be evaluated with the Robotmk plan rule.
On the one hand, using the Runtime-limit ratio (peak attempt) option you can set the service to CRIT, for example, if an execution attempt exceeds 90 percent of the set threshold value.
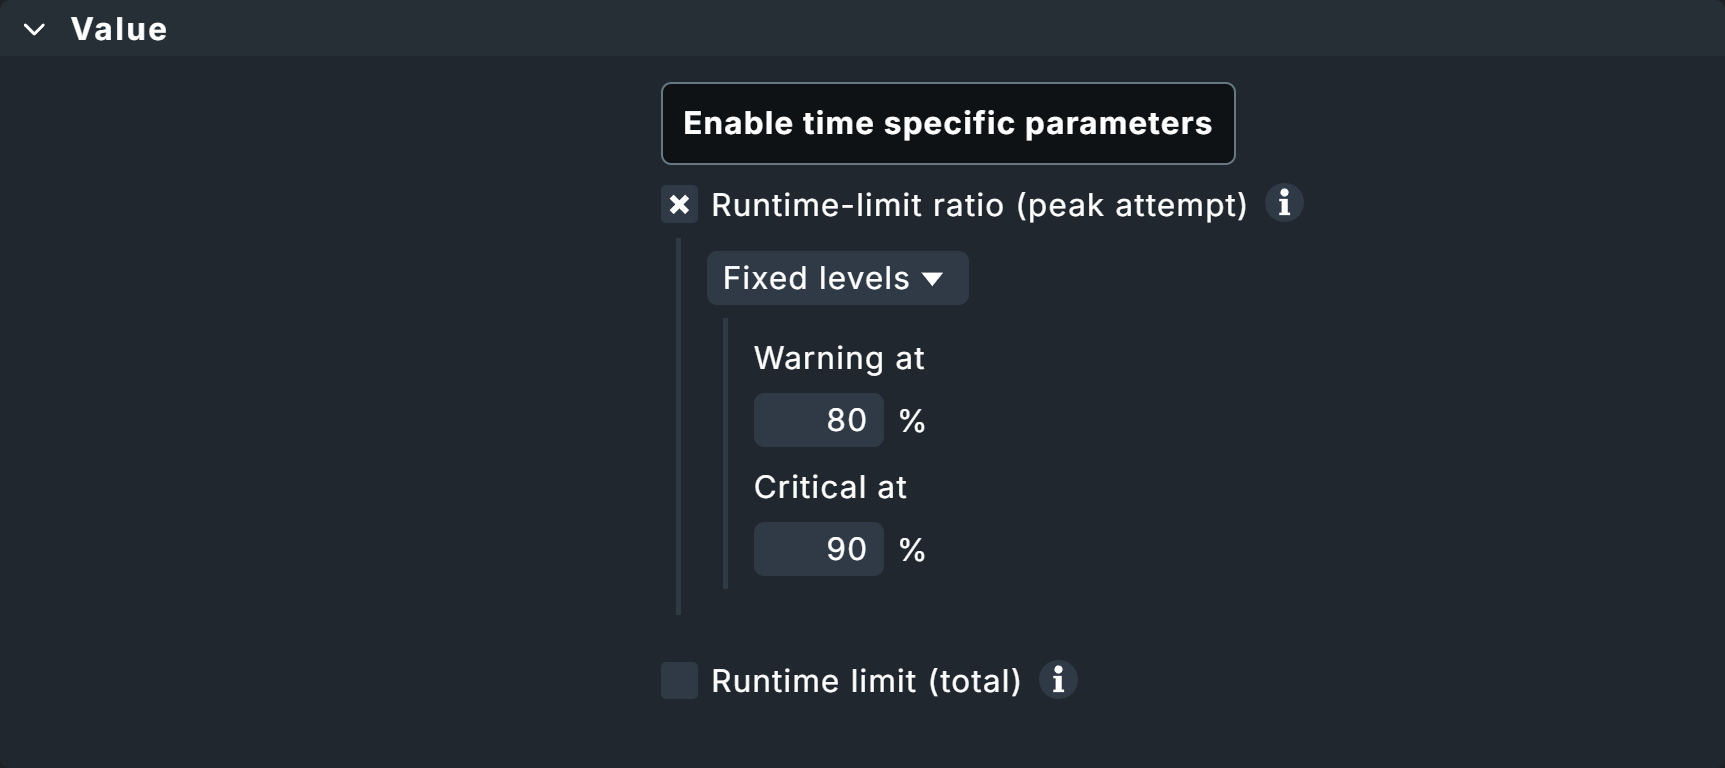
On the other hand, Runtime limit (total) can be used to evaluate the total runtime, i.e., the combined times of all execution attempts, including repeated executions of entire plans or individual tests. If plans are to be re-executed in their entirety or incrementally after individual tests have failed, the total execution time may vary considerably.
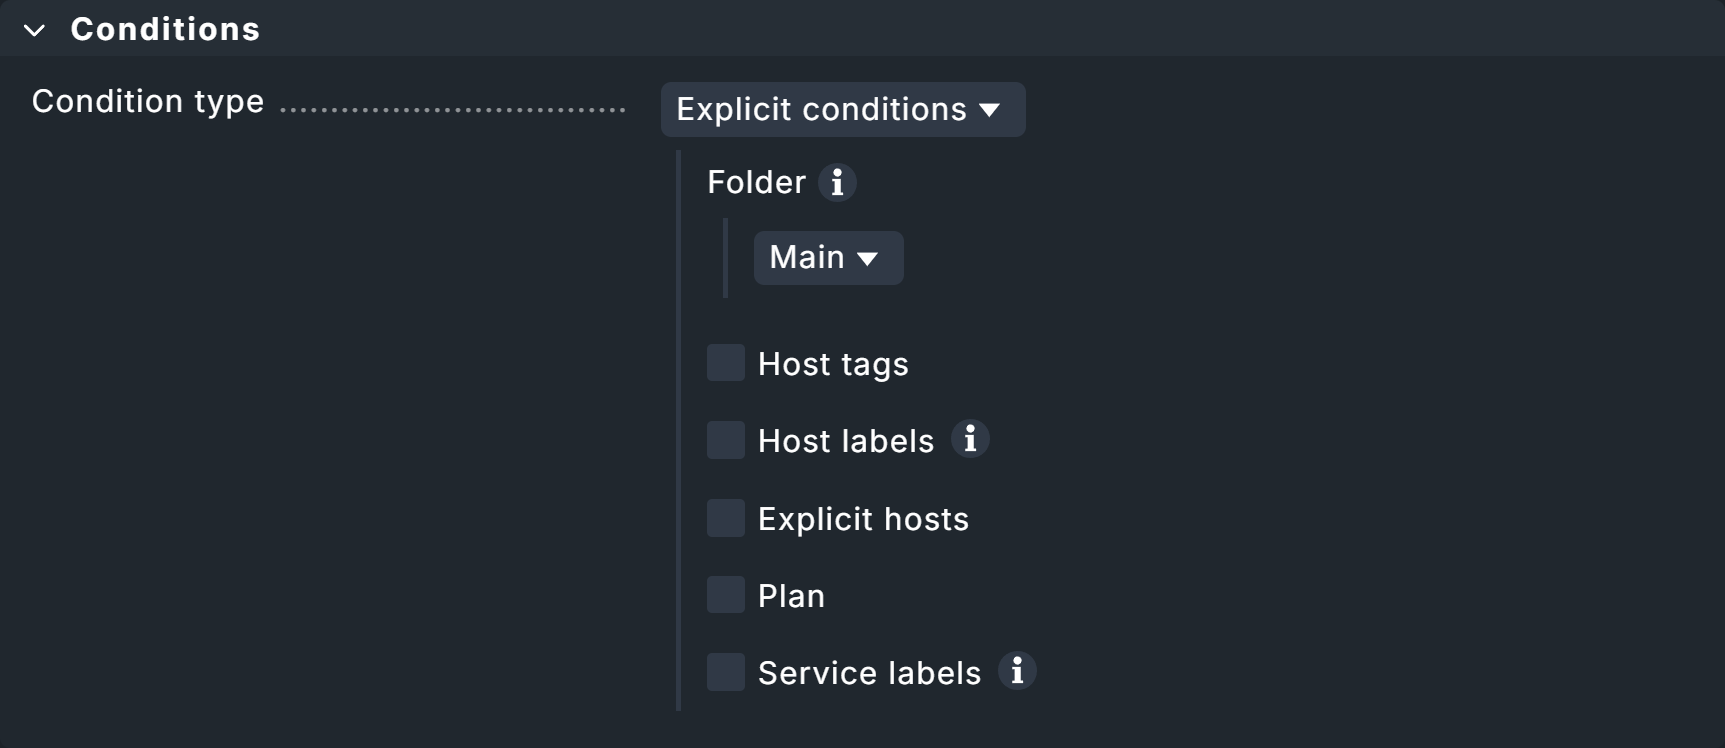
In the Conditions box, there is the option of restricting the rule to specific plans.
Creating a rule for the test status
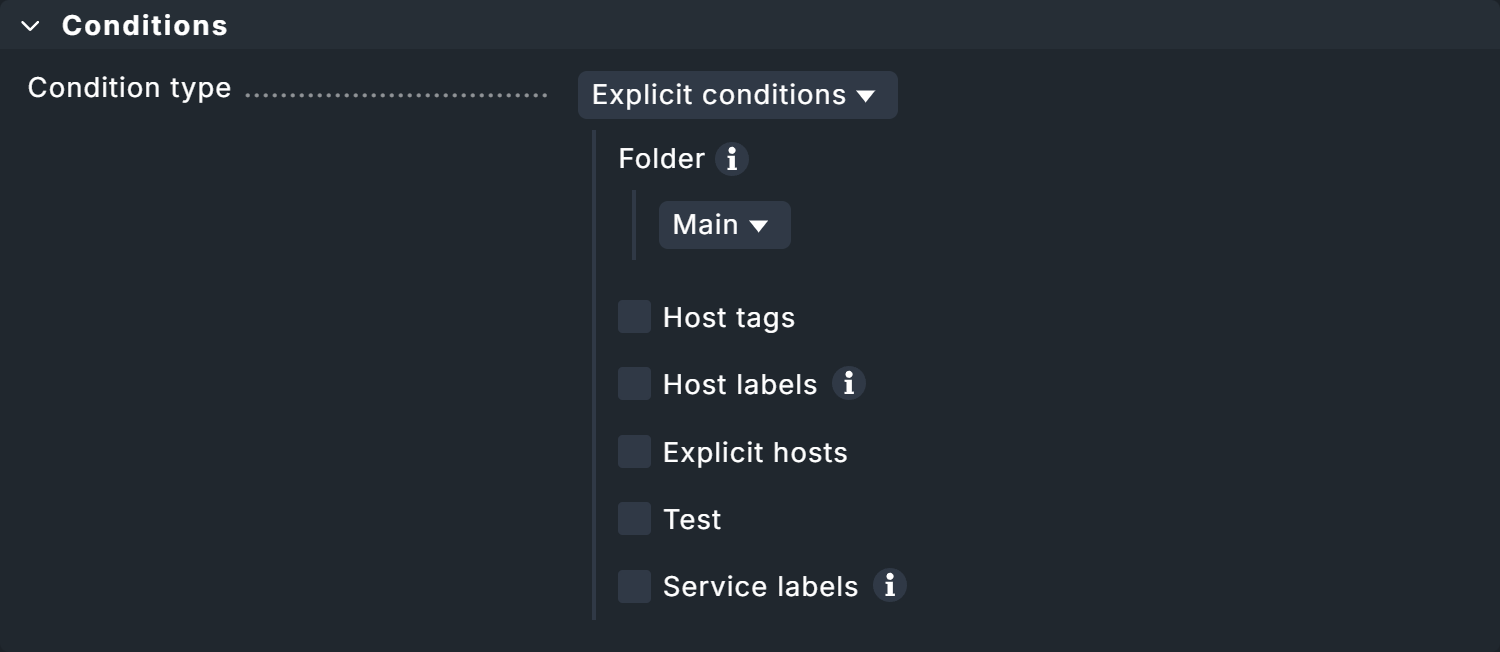
Additional data can also be retrieved for individual tests in the test suites via the Robotmk test rule.
Here you will again find the option to monitor runtimes, both for tests and keywords.
The monitoring of keywords is a Checkmk-specific function.
Therefore, the suite-internal status in the Robot Framework report could also be OK because the test suite was processed within the maximum permitted runtime — in Checkmk, however, WARN or CRIT, because a status change takes place at, for example, 80 percent of this maximum permitted runtime.
In addition, the Enable metrics for high-level keywords option can be used to generate metrics for higher-level keywords. This is particularly useful if your tests are organized in such a way that the higher-level keywords describe the 'what' and the lower-level keywords describe the 'how' — this gives you more abstract evaluations.
In this example, the threshold values for the maximum runtime of a test are 2 and 4 seconds. You will see the effects below in the chapter Robotmk in monitoring.
Once again, there is an explicit filter option in the Conditions box, here for individual tests.
2.4. Robotmk in monitoring
In monitoring, you will find services for the status of the Robotmk scheduler as well as the individual plans and tests — even if you have not created any separate service rules.
Scheduler status
The service RMK Scheduler Status is OK if the scheduler is running and has successfully built the execution environments.
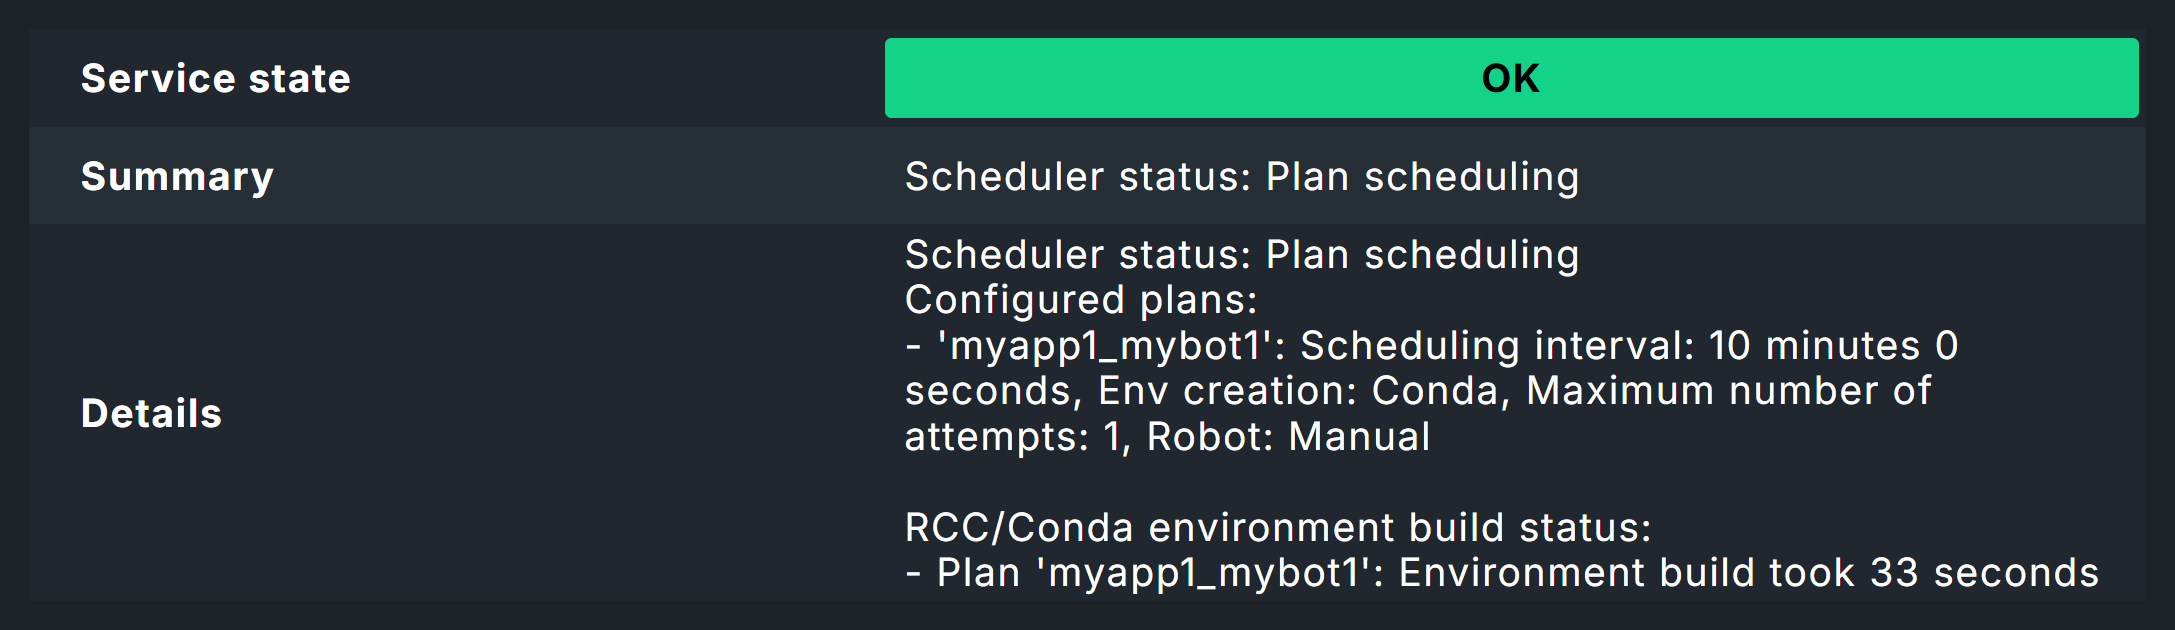
Here in the image you can see the note Environment build took 33 seconds. This is not the first build of the environment, so Micromamba can reuse previously downloaded packages. The first build would have taken much longer.
Plan status
The status of a plan is reflected in a service named by application name and suite, for example MK myapp1_mybot1 Plan.
Test status
The evaluation of the tests is where it gets really interesting.
In the image you can now see the effect of the threshold values set above for the runtime of tests — here the 2 seconds for the WARN status.
As the Sleep 3 Seconds instruction in the test itself already ensures a longer runtime, this service must go to WARN here, although the test was successful.
The fact that the test was successful is shown by the Robot Framework report, which you can access via the ![]() log icon.
log icon.
The report now clearly shows that the test and test suite have run successfully.
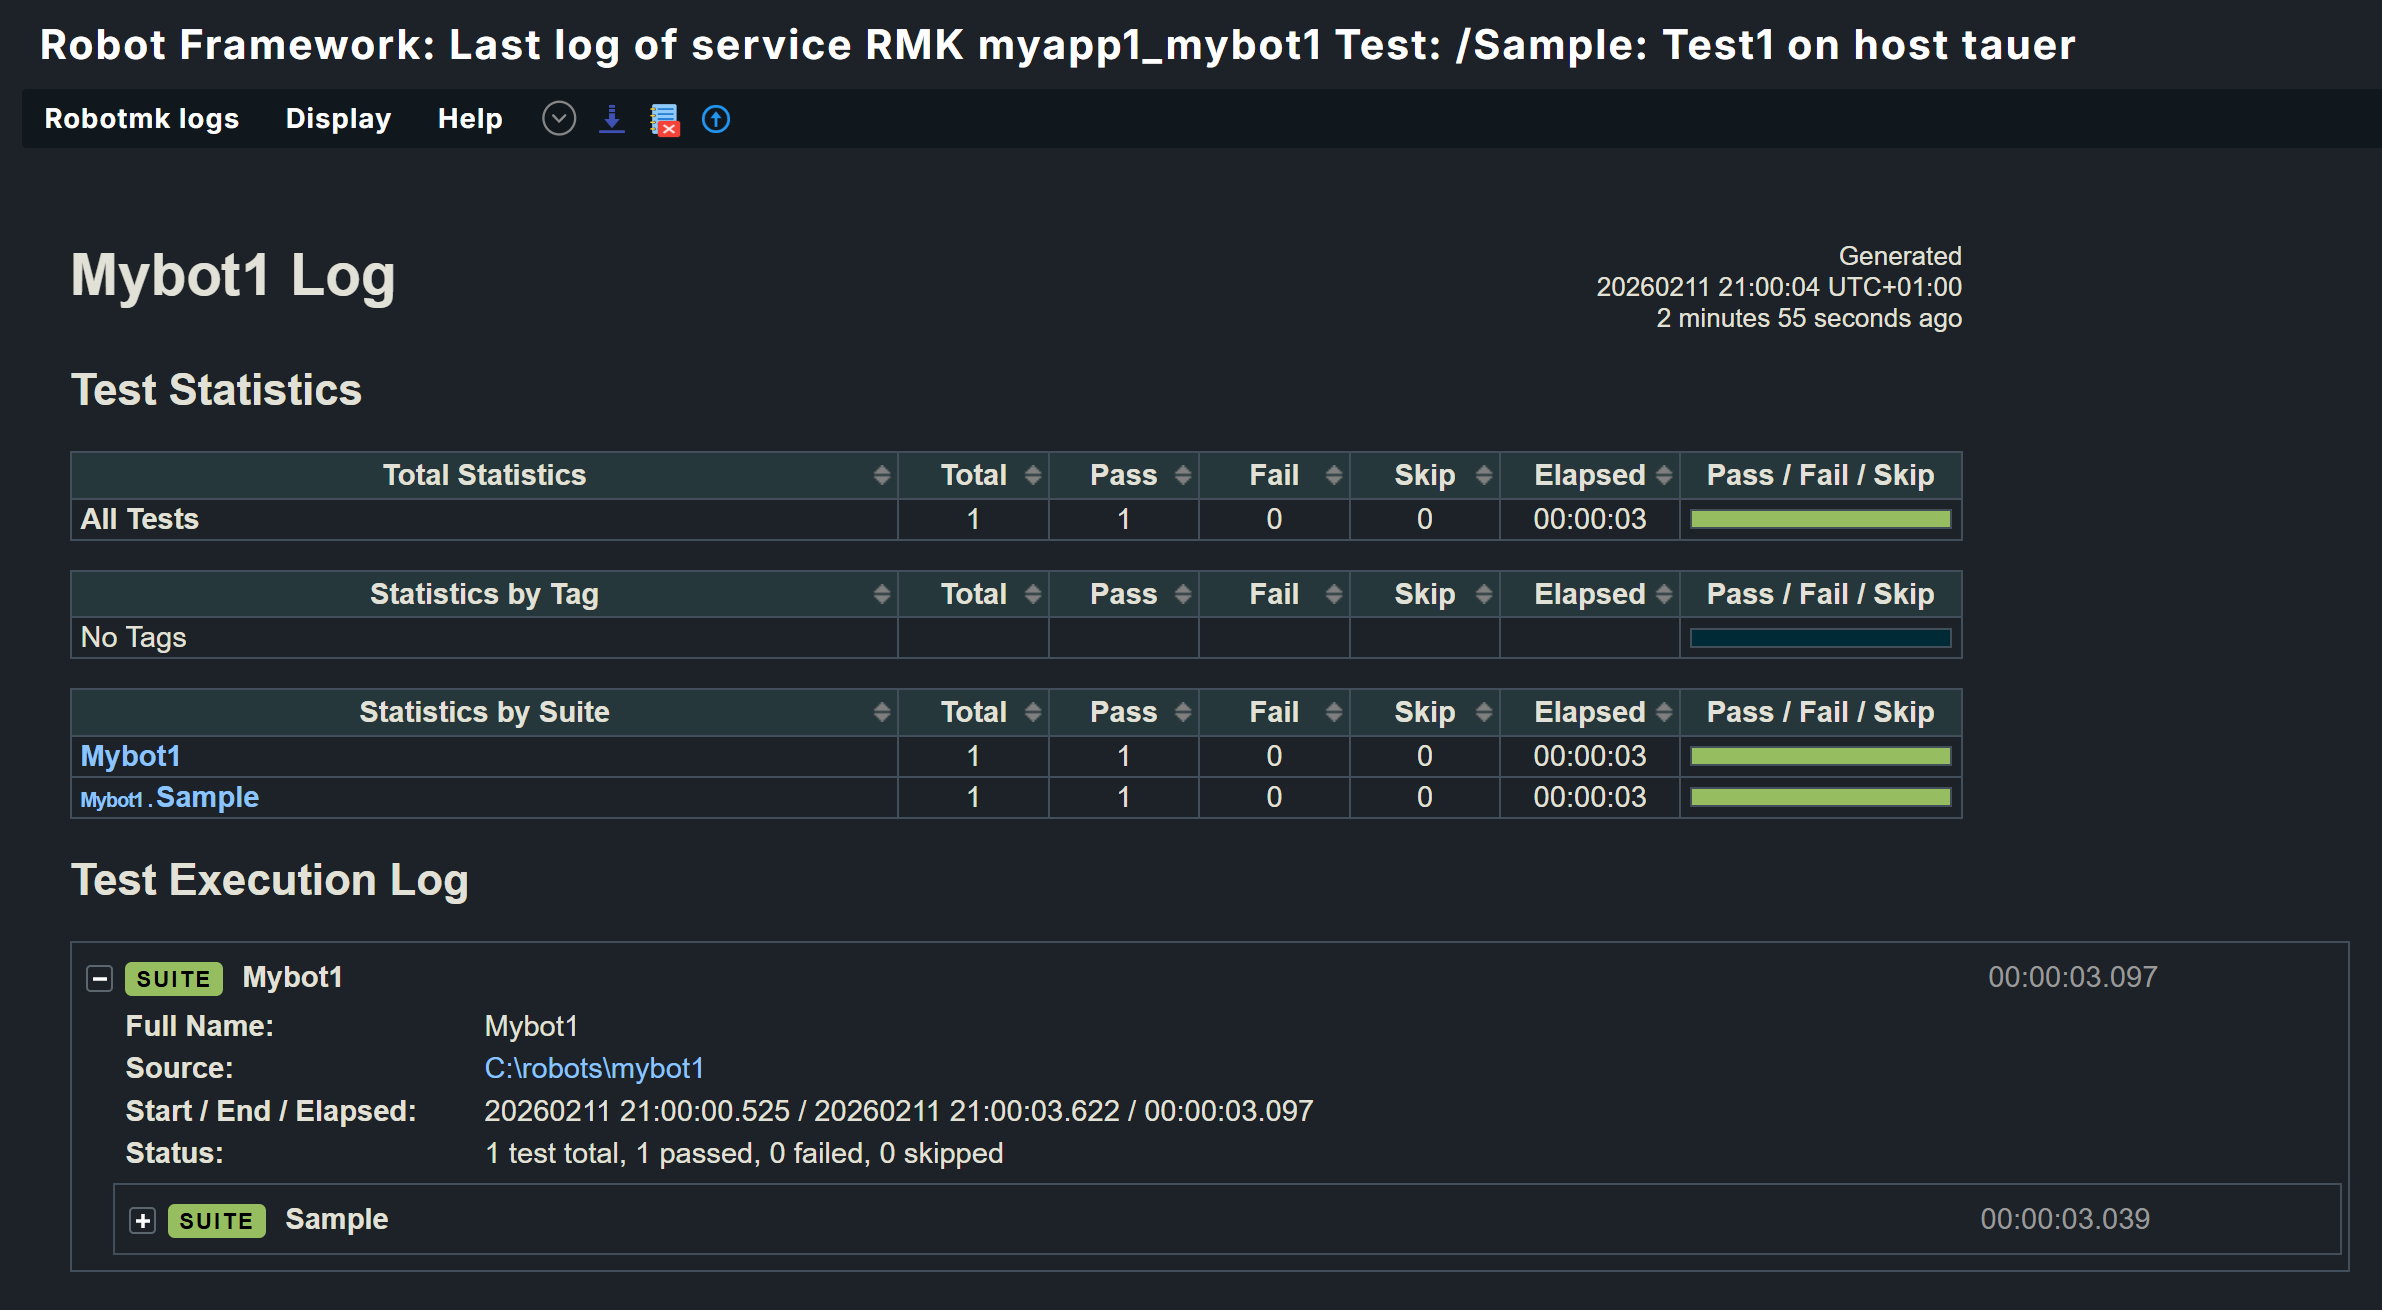
At the bottom of the data you can also see the individual keywords.
Dashboards
Of course, you can build your own dashboards as usual — but you can also find two built-in dashboards under Monitor > Synthetic Monitoring.
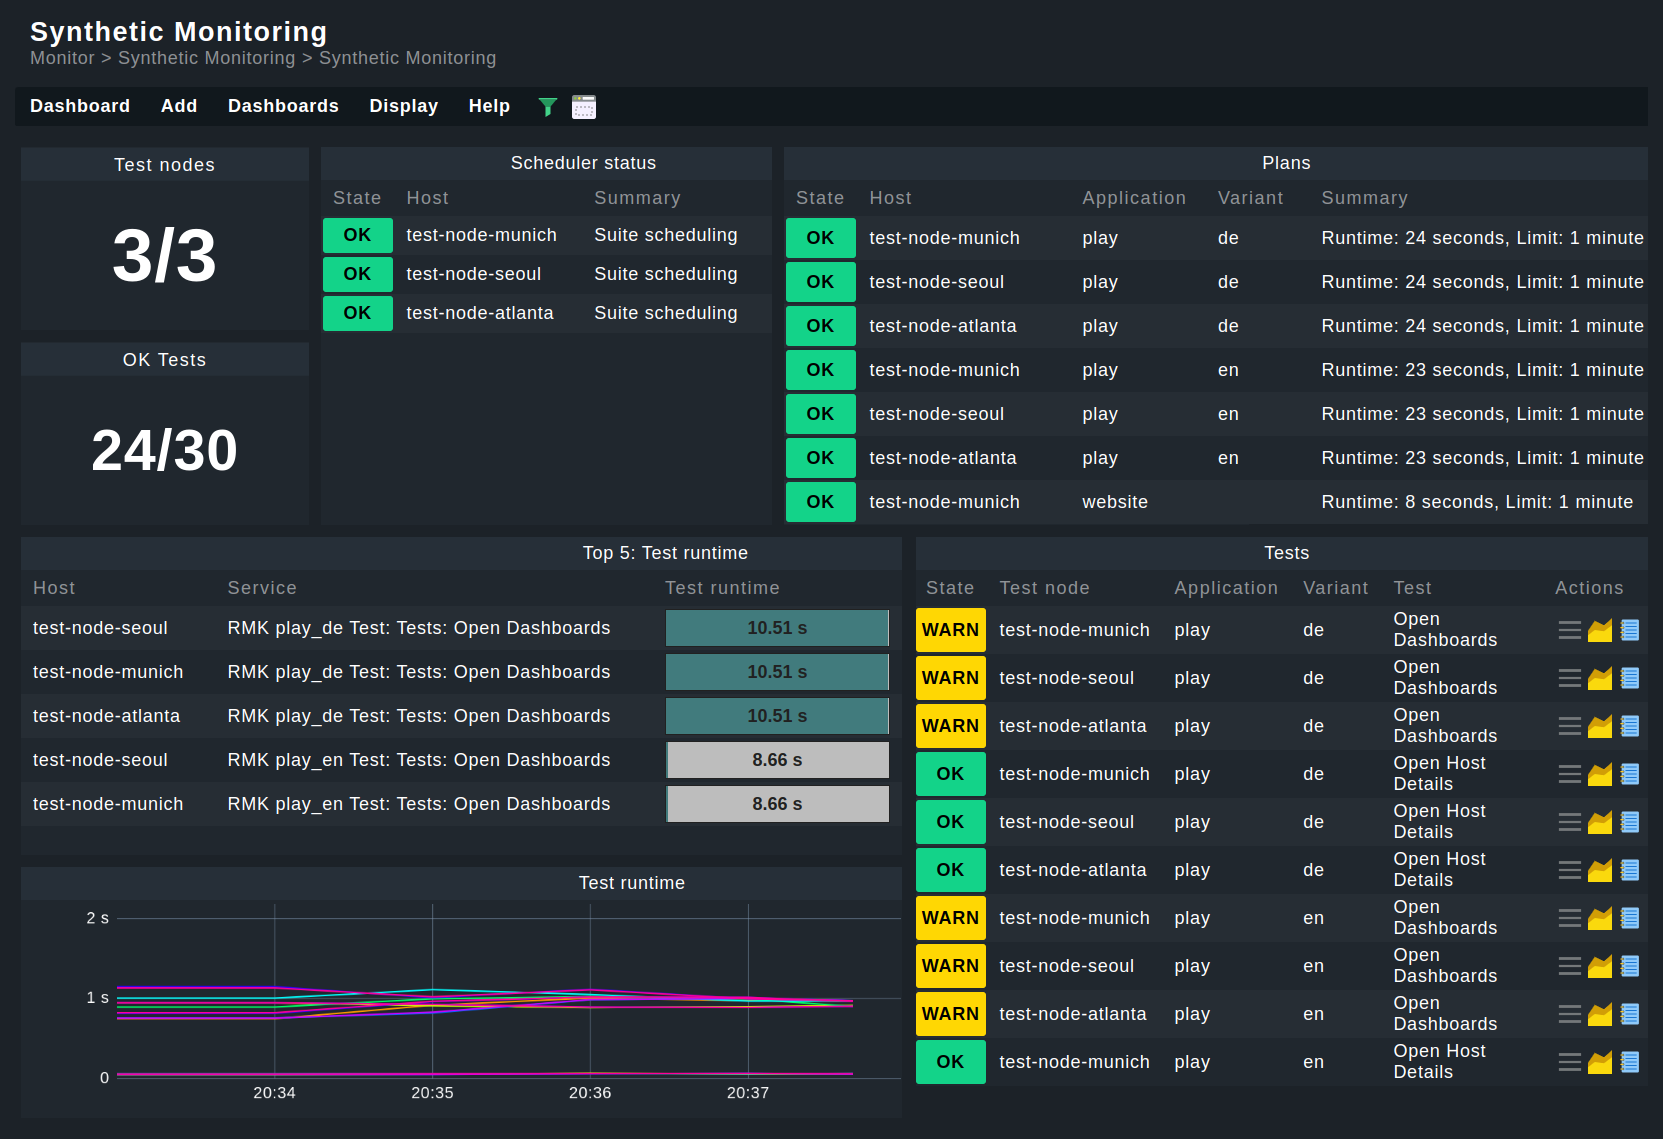
Prerequisite: For dashboards to work, HW/SW inventory must be activated on the hosts concerned.
3. Managed robots
We have so far assumed a scenario in which the test suites are already available on the test hosts. However, with the managed robots feature, robots can also be managed centrally on the Checkmk server and distributed via Checkmk agents.
From the above procedure you already know the entire configuration for existing robots using the Robotmk scheduler (Windows|Linux) rule.
In addition, simply enter the archive file (see below) with the packed robot. Here in the screenshot, under Plan Settings you can see the upload field for the robot — the same options as in the scheduler. Pay attention to the name at the top under Properties. This is mandatory, as the robot will later be configured in the scheduler using this name.
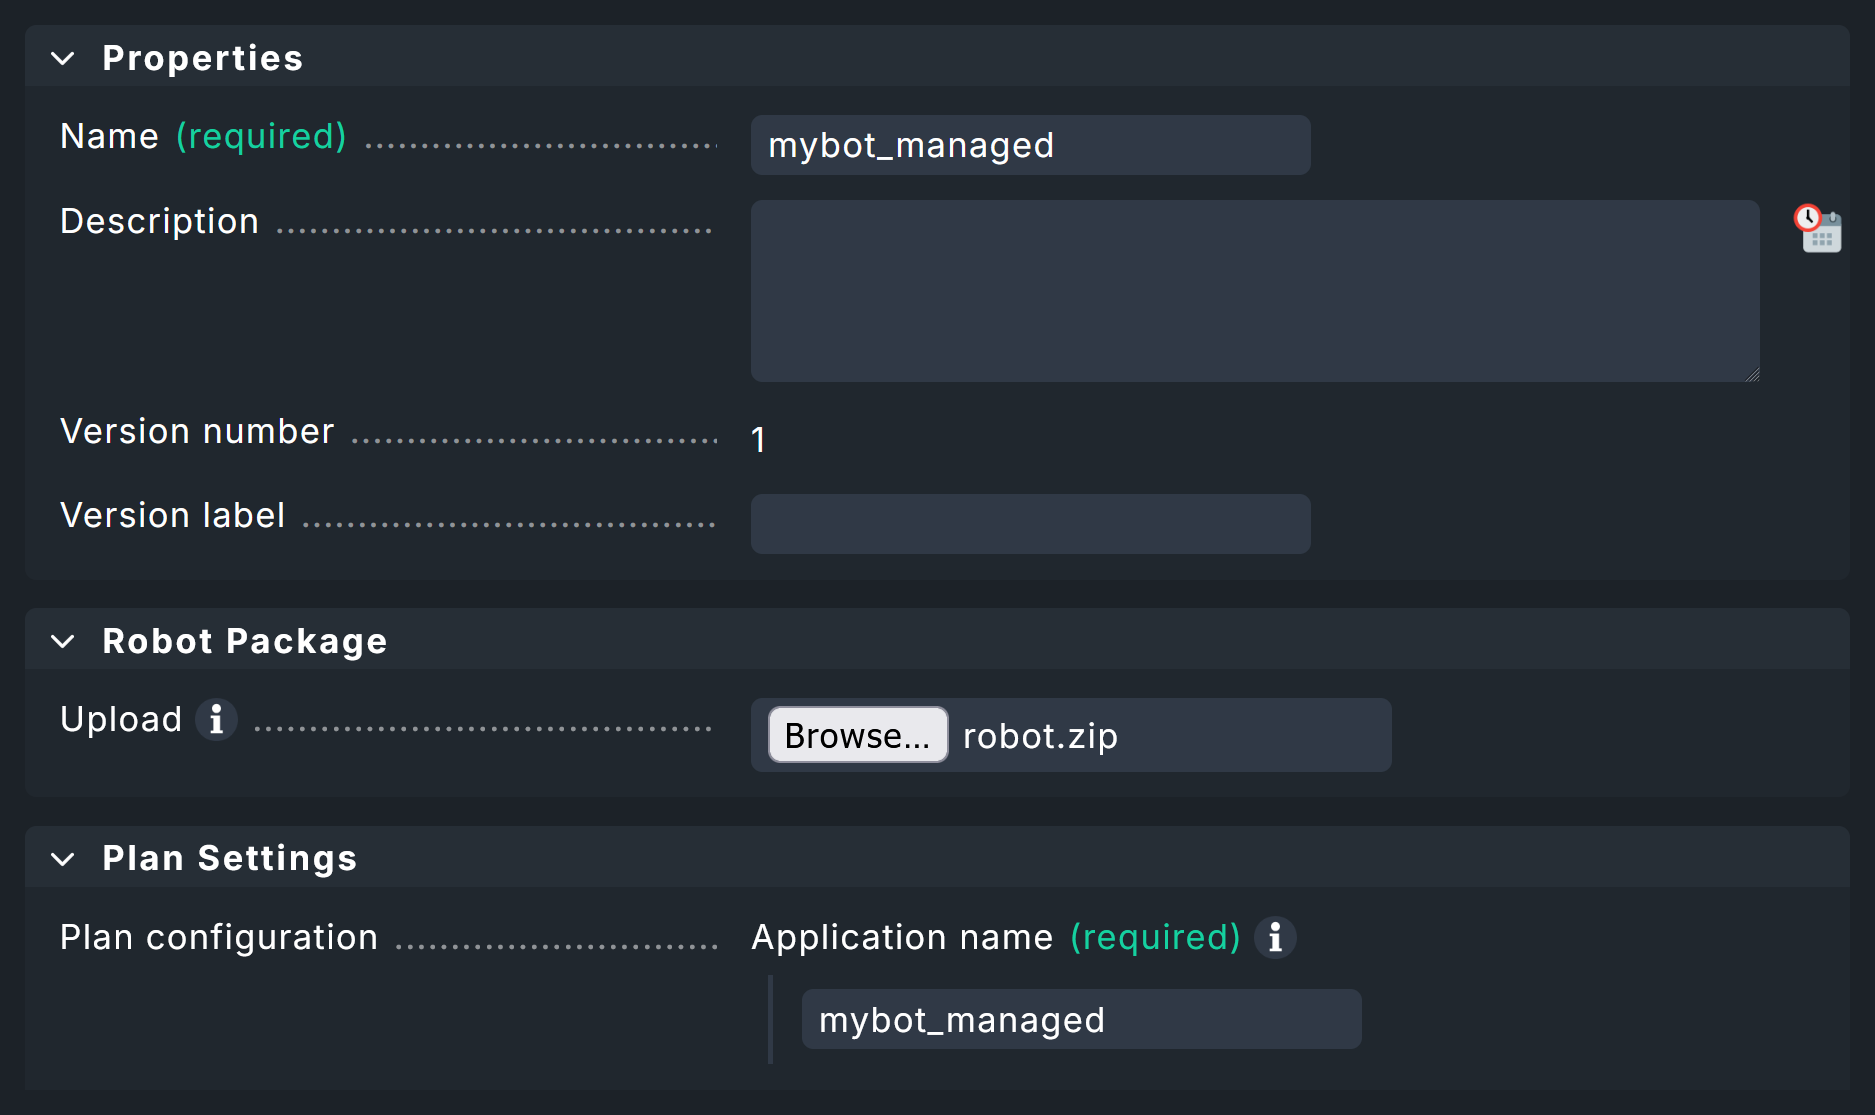
To use such a Managed robot, the Robotmk scheduler (Windows|Linux) rule is again used. But instead of scheduling the execution of the robot here, simply specify the desired, preconfigured robot under Sequence of plans. If required, you can still adapt the plan’s configuration for the preconfigured robot for this application here. In practice, the feature is therefore usually limited to outsourcing the known configuration and having the robot archive files distributed by the agent.
The agent then transfers the specified archives to the desired hosts and stores them in the agent directory under robomk_output/managed, where they are then unpacked and finally executed.
3.1. Creating a robot archive
In principle, you could simply archive the complete robot directory with the standard files (robotmk-env.yaml, robotkmk-setup.yaml, sample.robot etc.).
However, such tests are often managed via Git and consequently there are regularly files that should not be distributed — these are typically managed via a gitignore file.
As an aid to ensuring clean archives, here are two small scripts for Windows and Linux that create archives without the files to be ignored.
Use these scripts only as an aid and always test the functionality for your system beforehand.
- Windows
- Linux
4. Monitoring key performance indicators (KPI)
Above you have already seen that the runtimes of high-level keywords can be monitored as part of a test.
However, you can also include any keywords as individual services in the monitoring.
This is particularly useful for highly-abstract user keywords, which in turn call up several simple (standard) keywords such as Click or Log — in other words, these are basically used as functions.
Two variants are available for service discovery: Patterns in Checkmk and markers in the test suites.
For pattern-based discovery, the desired keywords are stored as regular expressions using Checkmk rules.
For marker-based discovery, markers are coded directly in front of the keywords in the tests themselves. These markers are processed using Robotmk’s own library.
Regardless of how the keyword data enters the monitoring, it must be configured there using the Robotmk KPI monitoring service rule.
4.1. Variant 1: Discovery via pattern
For this variant, you do not need to make any changes to your tests themselves. Simply open the Robotmk KPI discovery rule and enter the keywords to be monitored as regular expressions or very specific names.

Caution: If the regular expression matches more than one keyword in the same test, only one keyword will be recognized and its service status will be UNKNOWN (because Checkmk does not know which match is actually intended).
4.2. Variant 2: Discovery via marker
For a discovery via marker, you must perform the following steps:
Install the Robotmk library.
Import the Robotmk library into the suite.
Place the marker keyword in front of relevant keywords.
For the installation, the robotmk-env.yaml from above must be extended with robotframework-robotmklibrary.
Modifications compared to the suite above are highlighted in yellow:
The test suite sample.robot must be extended by the library (in the Settings area) and a marker.
KPIs will often refer to individual user keywords, so the keyword Foobar is added here (which only calls the standard keyword Log and is in turn called by the test case Test1).
*** Settings ***
# Import Libraries, Resource files, and other settings here
Library             RobotmkLibrary

*** Variables ***
# Define variables here
${MYVAR}    Hello Checkmk!

*** Test Cases ***
# One or more test cases

Test1
    Show Greeting

*** Keywords ***
# User-Defined keywords
Foobar
    Log    The foo barred!

Show Greeting
    Log  ${MYVAR}
    Sleep    3
    Log      Done.
    Monitor Subsequent Keyword Runtime  discover_as=My user keyword
    Foobar
The Robotmk keyword Monitor Subsequent Keyword Runtime is the marker to (trigger Checkmk to) monitor the following keyword (Foobar); more precisely, its runtime.
The optional discover_as argument can be used to specify an individual name for the service in the monitoring — the keyword Foobar therefore appears in the monitoring as a service called My user keyword.
The big advantage here compared to pattern-based discovery is that the same keyword can also be explicitly monitored multiple times within a single test.
Here is the example above, extended by two Foobar calls:
*** Settings ***
# Import Libraries, Resource files, and other settings here
Library             RobotmkLibrary

*** Variables ***
# Define variables here
${MYVAR}    Hello Checkmk!

*** Test Cases ***
# One or more test cases

Test1
    Show Greeting

*** Keywords ***
# User-Defined keywords
Foobar
    Log    The foo barred!

Show Greeting
    Log  ${MYVAR}
    Sleep    3
    Log      Done.
    Monitor Subsequent Keyword Runtime  discover_as=My user keyword
    Foobar
    Monitor Subsequent Keyword Runtime  discover_as=Foobar_2
    Foobar
    Monitor Subsequent Keyword Runtime  discover_as=Foobar_3
    Foobar
The three calls to the Foobar keyword would therefore appear in the monitoring as My user keyword, Foobar_2 and Foobar_3.
4.3. Configuring the service rule
Regardless of which of the two variants the keywords are used for monitoring, the next step is always to configure the evaluation: At what runtime should the services go to WARN or CRIT? To do this, define the corresponding levels in the Robotmk KPI monitoring rule.
4.4. Keywords in monitoring
The keyword services appear in monitoring under one of these two patterns:
Pattern-based: RMK myapp1_mybot1 Test: /Sample: My Test1 (cmk): Foobar
Marker-based: RMK myapp1_mybot1 Test: /Sample: My Test1 (rf): Foobar
The difference is therefore only in the indication of origin in brackets directly before the keyword.
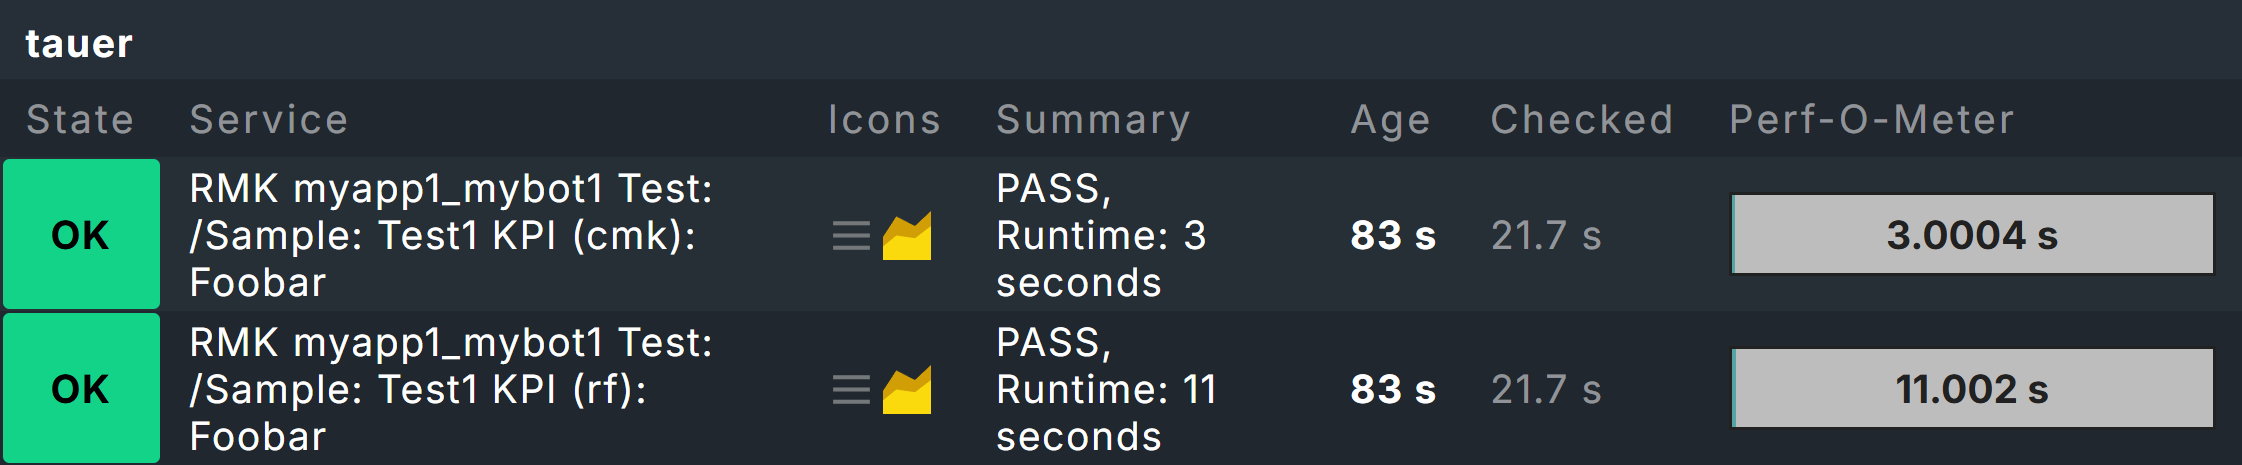
As shown in the above screenshot with two Foobar keyword services, the suite needed to be extended somewhat:
*** Settings ***
# Import Libraries, Resource files, and other settings here
Library             RobotmkLibrary

*** Variables ***
# Define variables here
${MYVAR}    Hello Checkmk!

*** Test Cases ***
# One or more test cases

Test1
    Show Greeting

*** Keywords ***
# User-Defined keywords
Foobar
    Sleep    3
    Log    The foo barred!

Barfoo
    Sleep    11
    Log    The End of Barfoo

Show Greeting
    Log  ${MYVAR}
    Sleep    3
    Log      Done.
    Foobar
    Monitor Subsequent Keyword Runtime  discover_as=Foobar
    Barfoo
The two keywords Foobar and Barfoo both appear under the name Foobar in the monitoring, but can be distinguished by the indication of origin in brackets.
The example with two different keywords that are listed under the same name primarily serves to clarify the origin information.
As already mentioned above, the actual purpose of discover_as is to be able to call up one keyword multiple times in a test but to name each occurrence individually.
5. Offline mode for test environments
By default, Micromamba takes care of setting up the environments by reading the YAML configuration and downloading the corresponding packages and dependencies from the network.
But what if the hosts on which the tests are to run have no, or very limited, internet access?
Checkmk, or more precisely the Robotmk scheduler, can help here by setting up Conda environments even without an internet connection. To put it briefly: the environments can be set up in advance on any computer and then distributed as a tgz archive. Thanks to CSM, this can be done in four simple steps.
Step 1: In order for a packaged robot to work, the configuration file robotmk-env.yaml must be supplemented with the entry conda-pack:
Step 2: Next, the environment must be rebuilt and then packaged:
CSM uses the conda-pack tool stored in the configuration to pack the environment into an archive.
That gives you the mybot1.tar.gz file.
Step 3: In Checkmk, in Robotmk scheduler (Windows|Linux) you usually set the Environment source option to Packed Conda environment, and specify the path to the archive mybot1.tar.gz — instead of robotmk-env.yaml as usual.
The same configuration applies, of course, when used as a Managed robot.
6. Debugging
The Robotmk Scheduler provides two means of investigating potential issues, such as errors in setting up execution environments or in executing plans in general. One way is via log file inspection, the other via an explicit debug function of the scheduler that allows the execution of individual plans (since 2.5.0).
6.1. Log inspection
The easiest way to monitor events in Synthetic Monitoring is to track the log files in a live view. The exact storage paths can be found in the overview below.
Under Linux the following command can be used for this purpose:
On Windows, you could use Notepad++ or VS Code, for example, but many other IDEs also offer the option for live tracking of file changes.
Depending on the configuration of your plans, tests, and environments, this process may take some time, as it is primarily used to track regular scheduler activity.
Alternatively, the scheduler can also be started manually. To do this, the scheduler must first be stopped and an scheduled downtime should be set in the monitoring to prevent any impact on the monitoring and to prevent the scheduler from restarting automatically.
On Windows, you can stop the service using the Task Manager. In Linux, you can stop and start the service in the terminal:
- Windows
First, open the Task Manager (
taskmgr.exe) and stop the scheduler.- Linux
Starting the scheduler manually gives you a little more control, but you will still have to rely on log files, and the complete synthetic monitoring configuration will be executed.
6.2. Ad hoc execution of plans
However, the scheduler also supports manual and one-time execution of individual plans. In this case, execution takes place immediately; any waiting times or other execution logic are irrelevant here. In addition, you receive the information directly in the terminal without having to go through log files. Even for ad hoc execution, you must first stop the currently running scheduler service and set a scheduled downtime in the monitoring.
In this scenario, the scheduler also loads the complete configuration, but restricts execution to the specified plan:
- Windows
First, open Task Manager (
taskmgr.exe), and stop the scheduler.- Linux
The plan ID specified here corresponds to the entry you made in the Robotmk scheduler configuration under Sequence of plans > Application name, followed by an underscore and the actual bot name, in this case, for example, myapp1_mybot1 (as the service also appears in monitoring).
The -vv argument for extended output is also important, as otherwise the scheduler provides little feedback.
A final available argument, --no-plan-result, prevents a result, i.e., a Robot Framework report, from being copied to the corresponding folder, so that it remains only locally.
7. Troubleshooting
7.1. Scheduler reports No Data
If the scheduler does not receive any data, building the environment probably did not work.
A common reason for this are network problems, for example, due to which certain dependencies cannot be loaded.
In this case, take a look at the corresponding log file under C:\ProgramData\checkmk\agent\robotmk_output\working\environment_building, respectively /var/lib/check_mk_agent/robotmk/scheduler/environment_building..
8. Files and directories
8.1. Windows
| File path | Description |
|---|---|
|
Log files and results from the suites |
|
Log files for building virtual environments |
|
Log file of the agent plug-in |
|
|
|
Agent plug-in |
8.2. Linux
| File path | Description |
|---|---|
|
Log files and results from the suites |
|
Log files for building virtual environments |
|
|
|
Agent plug-in |
|
Execution location for managed robots |
|
Storage location for managed robots archives |
Attention: Under Linux, the Robotmk scheduler does not create its own log file (under Windows the robotmk_scheduler_rCURRENT.log), but instead logs via agent and syslog.
The corresponding command: