1. Executing a command
You can intervene in the monitoring process using commands that apply to hosts, services and other objects. The commands are most often used for acknowledging problems and for setting scheduled downtimes. There are a number of other commands however, some of which are reserved for the administrator. Which commands are available in a view depends on your access rights (role), as well as on the type of object being displayed.
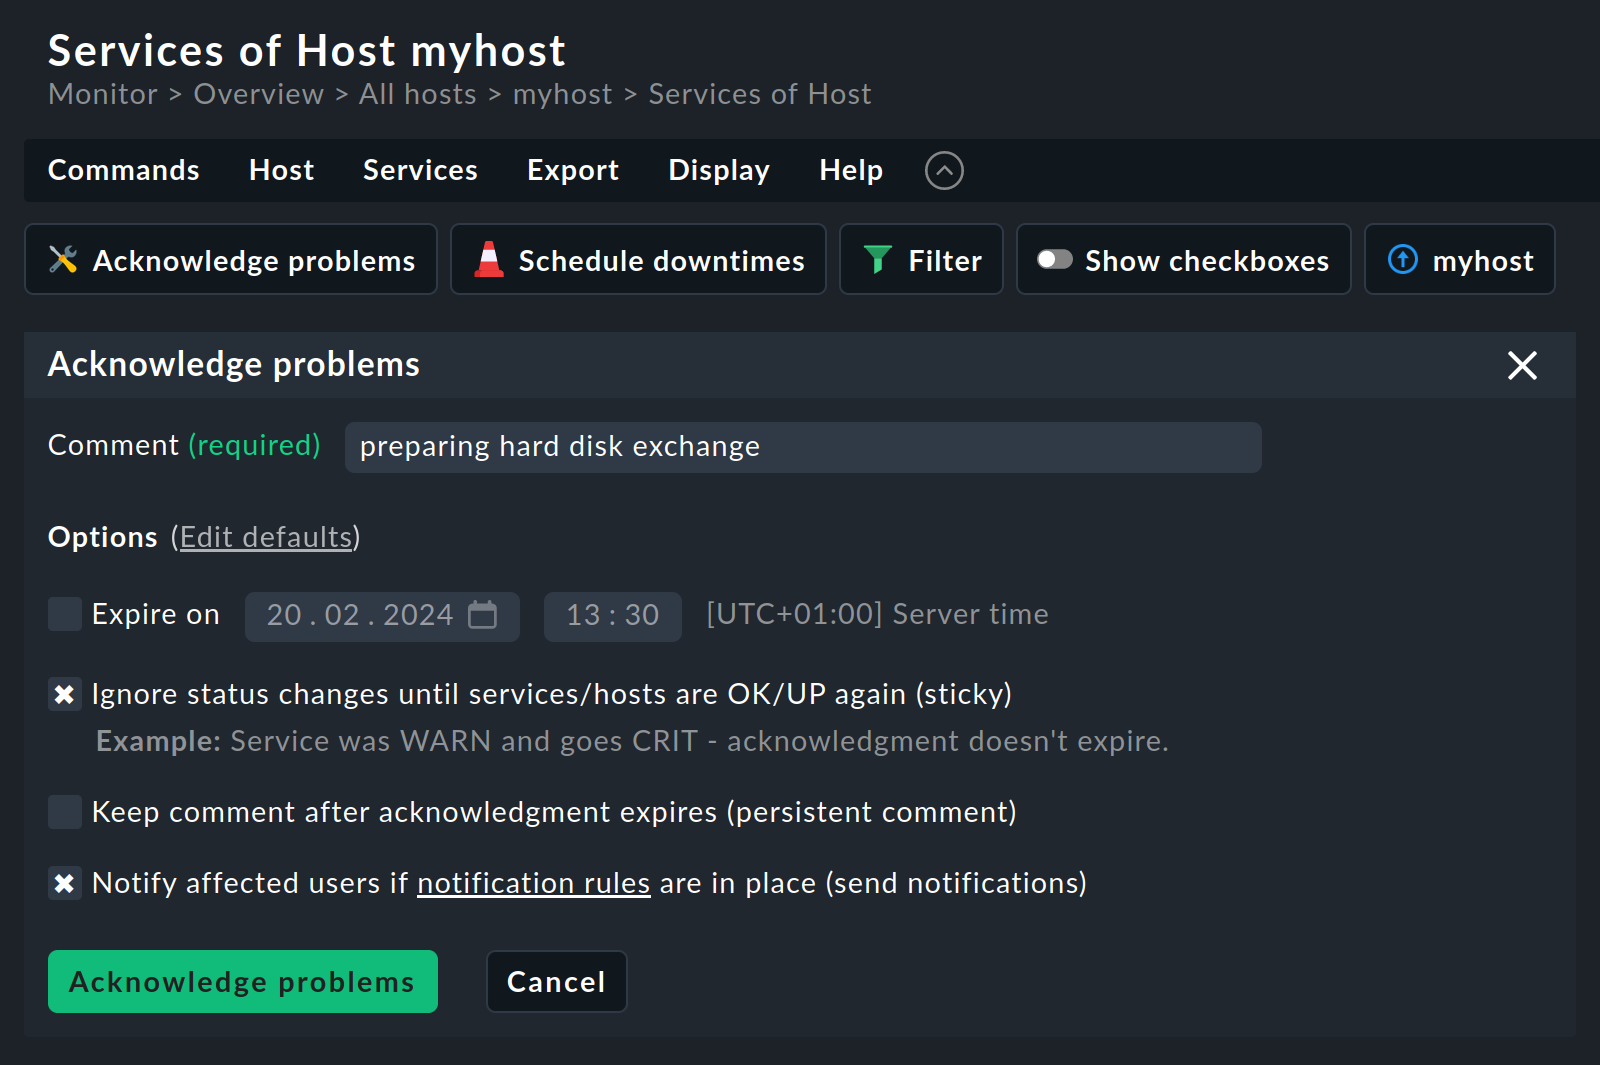
You can access the commands in a view via the Commands menu. When you select one of the commands, a field with the command’s parameters is displayed below the menu bar or action bar. If you select Acknowledge problems it will look like this:

Some commands need further information, such as an acknowledgment. Pressing the Acknowledge problems button opens a confirmation dialog:

If you confirm the request, the chosen command will be carried out on all objects shown in the current view. If you first wish to make a selection in the view, you have three options:
Go into the host’s or service’s detail view so that the command only takes effect there.
Set a
 Filter in the view in order to reduce the list of displayed objects.
Activate the checkboxes with
 Show checkboxes.
Activated checkboxes open an extra column on the view’s left side where objects can be selected which the command will act on:

A click on the small cross at the top of the column will switch all of a table’s checkboxes on or off.
2. The commands at a glance
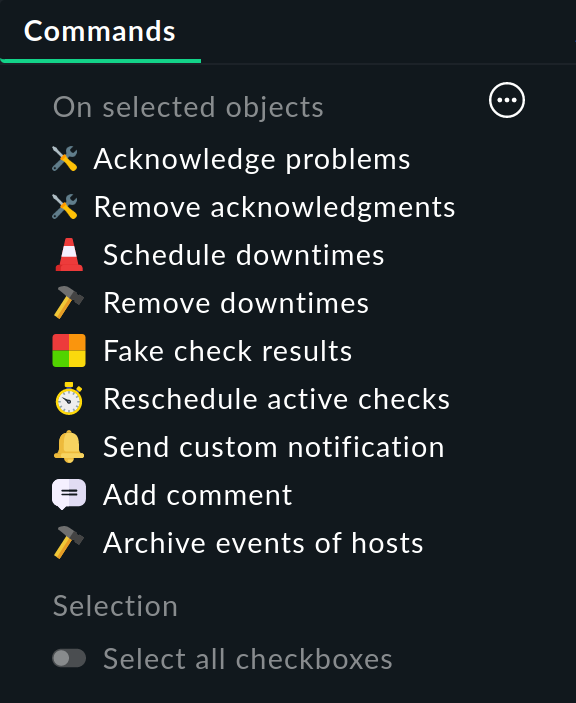
The available commands can be found in the Commands menu:

Reminder: Available means that the commands can be different depending on the view and permissions. Also note that you can show less or more in this menu.
The most important commands in brief:
Acknowledge problems |
Acknowledge problems. |
Schedule downtimes |
Set scheduled downtimes. |
Fake check results |
Manually determine the results of checks, i.e. the output, performance data or simply the state of a host or service.
This is useful, for example, to test the effects of different outputs and states on monitoring, views or notifications.
After a state change initiated with this command, the original state should be restored during the next regular check. |
Reschedule active checks |
Manually trigger active checks, for example the HW/SW inventory, outside its usual cycle. However, for many hosts this could cause short-term peaks in CPU usage To counteract this the checks can be evenly distributed over a period to be entered in minutes. |
Send custom notification |
Create custom notifications.
This does not generate a state change.
Notifications created with this command are of the special |
Add comment |
Add comment.
A comment is marked in a view with the |
Archive events of hosts |
Archive all open events of the Event Console. |
Freeze aggregations |
Freeze Business Intelligence (BI) aggregations. You can find out more about this in the BI article. |
In the comments at Acknowledge problems, Schedule downtimes and Add comment you can enter a URL in the form |
