1. Introduction
![]() In
In ![]() Checkmk Ultimate
you can receive OpenTelemetry metrics and process them in monitoring.
For this purpose, Checkmk includes an OpenTelemetry Collector.
This supports the reception of OTLP data via the transport protocols gRPC and HTTP(S) (push configuration).
It can also act as a scraper to collect data from Prometheus endpoints (pull configuration).
Checkmk Ultimate
you can receive OpenTelemetry metrics and process them in monitoring.
For this purpose, Checkmk includes an OpenTelemetry Collector.
This supports the reception of OTLP data via the transport protocols gRPC and HTTP(S) (push configuration).
It can also act as a scraper to collect data from Prometheus endpoints (pull configuration).
Support for OpenTelemetry data types (signals) is as follows:
Metrics are extensively supported by Checkmk—these can be flexibly assigned to existing objects in monitoring or used to create custom objects.
Logs are partially supported—they can be forwarded to the Event Console and processed there.
Traces are currently not supported by Checkmk.
There are two ways to set this up:
Starting with Checkmk 2.5.0p9, a wizard is available that guides you step by step through the setup process and configures the metric backend and dynamic host management components with appropriate default settings.
Alternatively, you can manually configure the relevant components, which of course requires knowledge of how these interact.
If you only want to send logs to the Event Console, you do not need a metrics backend. If you do not want to automatically generate hosts from the OpenTelemetry metrics, you do not need dynamic host management. In both of these cases, configure the required components manually.
This article describes the status of the OpenTelemetry integration as of the release of Checkmk 2.5.0p9. We are continuing to work on incorporating changes made since then. Please make use of the OpenTelemetry-related works to determine the current status of the Checkmk version you are using. |
2. Guided Setup
You can find the setup wizard under Setup > Open Telemetry Quick Setup, and the OpenTelemetry Collector—which is configured in the same way—as a Prometheus scraper under Setup > Prometheus Quick Setup. In the wizard, specify the interfaces, ports, and protocols, or configure scraping endpoints. When setting up the OpenTelemetry Collector, a sample configuration for intermediate collectors is displayed in the third step. You can extend this to include filtering or limiting the transmission intervals. The documentation at Transforming telemetry of the OpenTelemetry project will help you with this.
If you select Setup > Open Telemetry Quick Setup or Setup > Prometheus Quick Setup after having completed the initial setup, you will have the option to customize your existing configuration. Instead of going through a guided setup again, the two buttons OpenTelemetry Collector and Dynamic host management allow you to proceed directly to setting up the respective component.
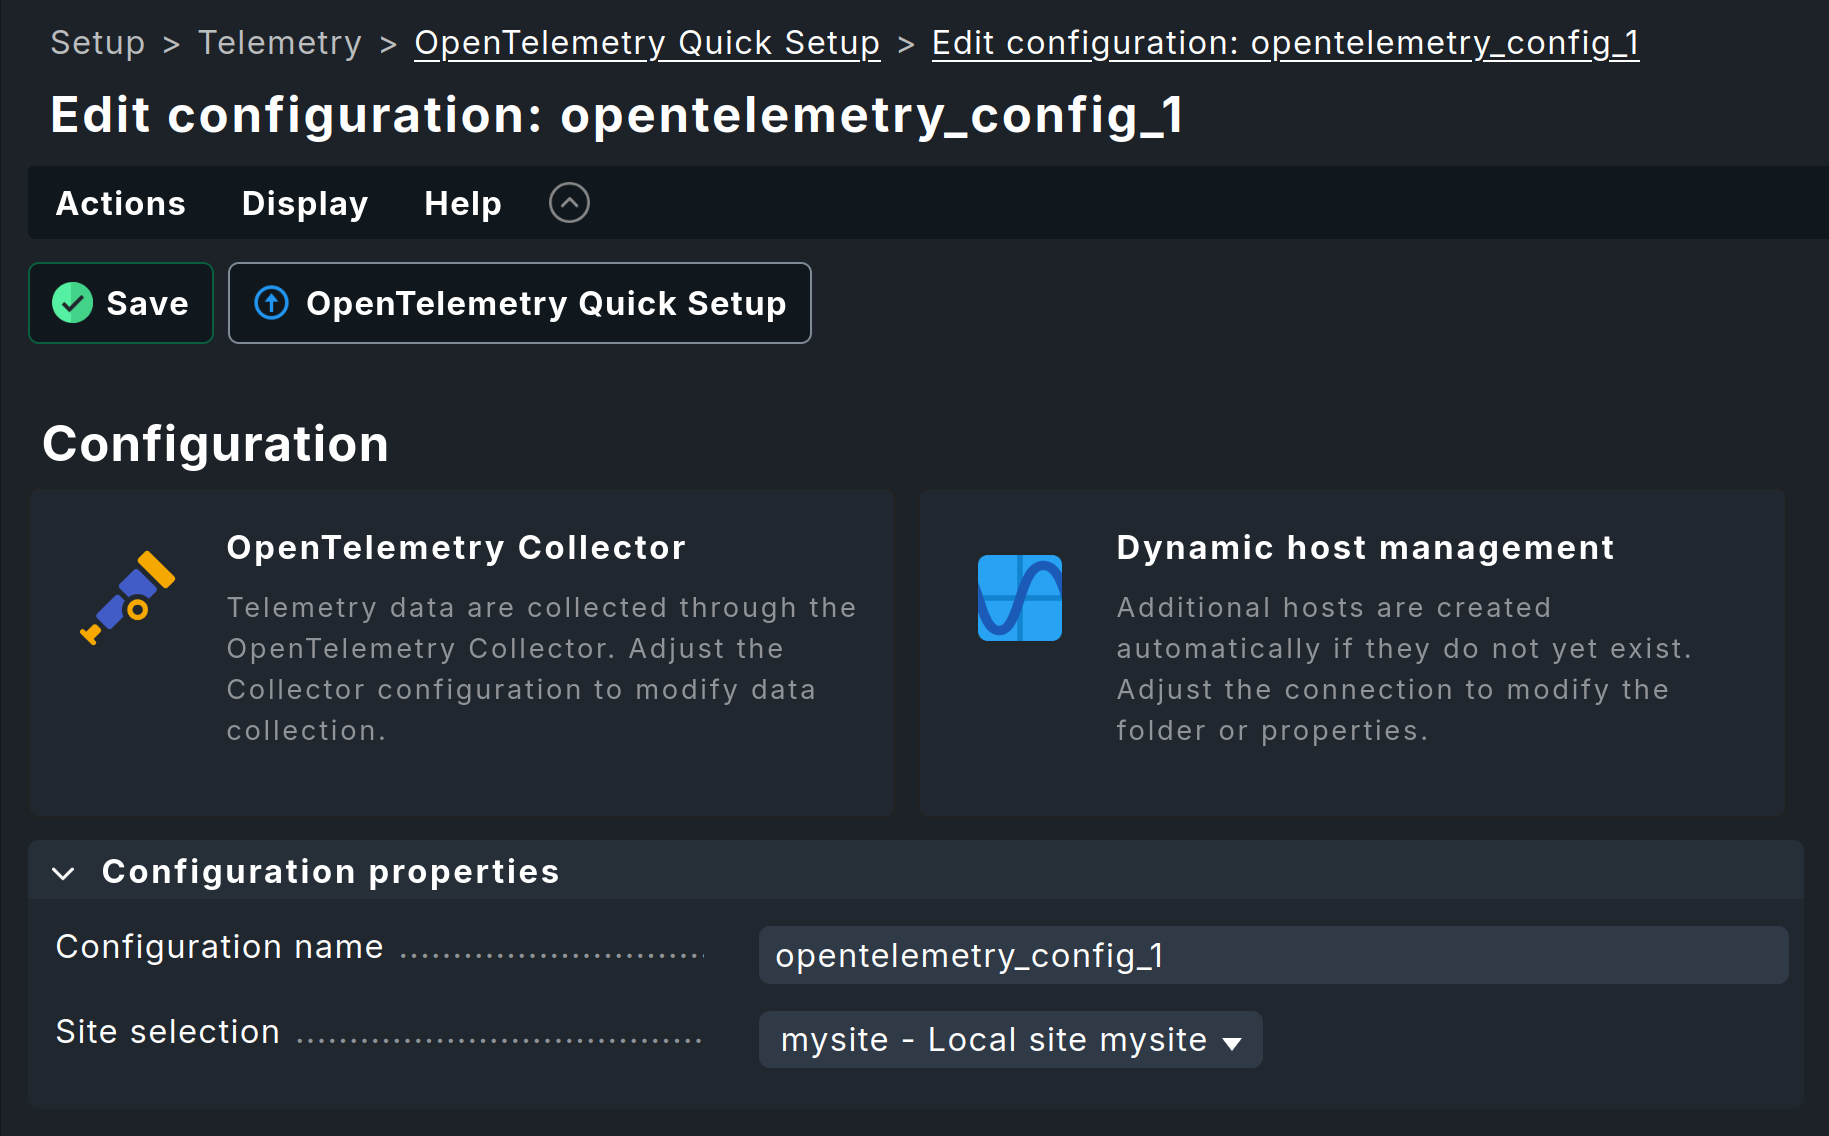
We will show you the wider range of configuration options available when customizing individual components directly in the following sections on manual setup and setting up dynamic host management.
3. Manual setup
Before enabling the OpenTelemetry Collector, you should already have enabled one or both of the following components to avoid errors:
The metrics backend, if you want to display OpenTelemetry metrics in monitoring
The Event Console with a Syslog receiver, if you want to process OpenTelemetry logs
You can enable both of these in the Global settings. In both cases, the default settings are sufficient for first use.
3.1. Activating the OpenTelemetry Collector
To process OpenTelemetry data, you must activate the collector in Global settings > Telemetry. You can also set the memory limit for the collector in the global settings. This ensures that large volumes of incoming data only overload the OpenTelemetry Collector, not your entire Checkmk system.
The collector starts automatically after you have saved the settings.
3.2. Setting up the OpenTelemetry Collector (passive)
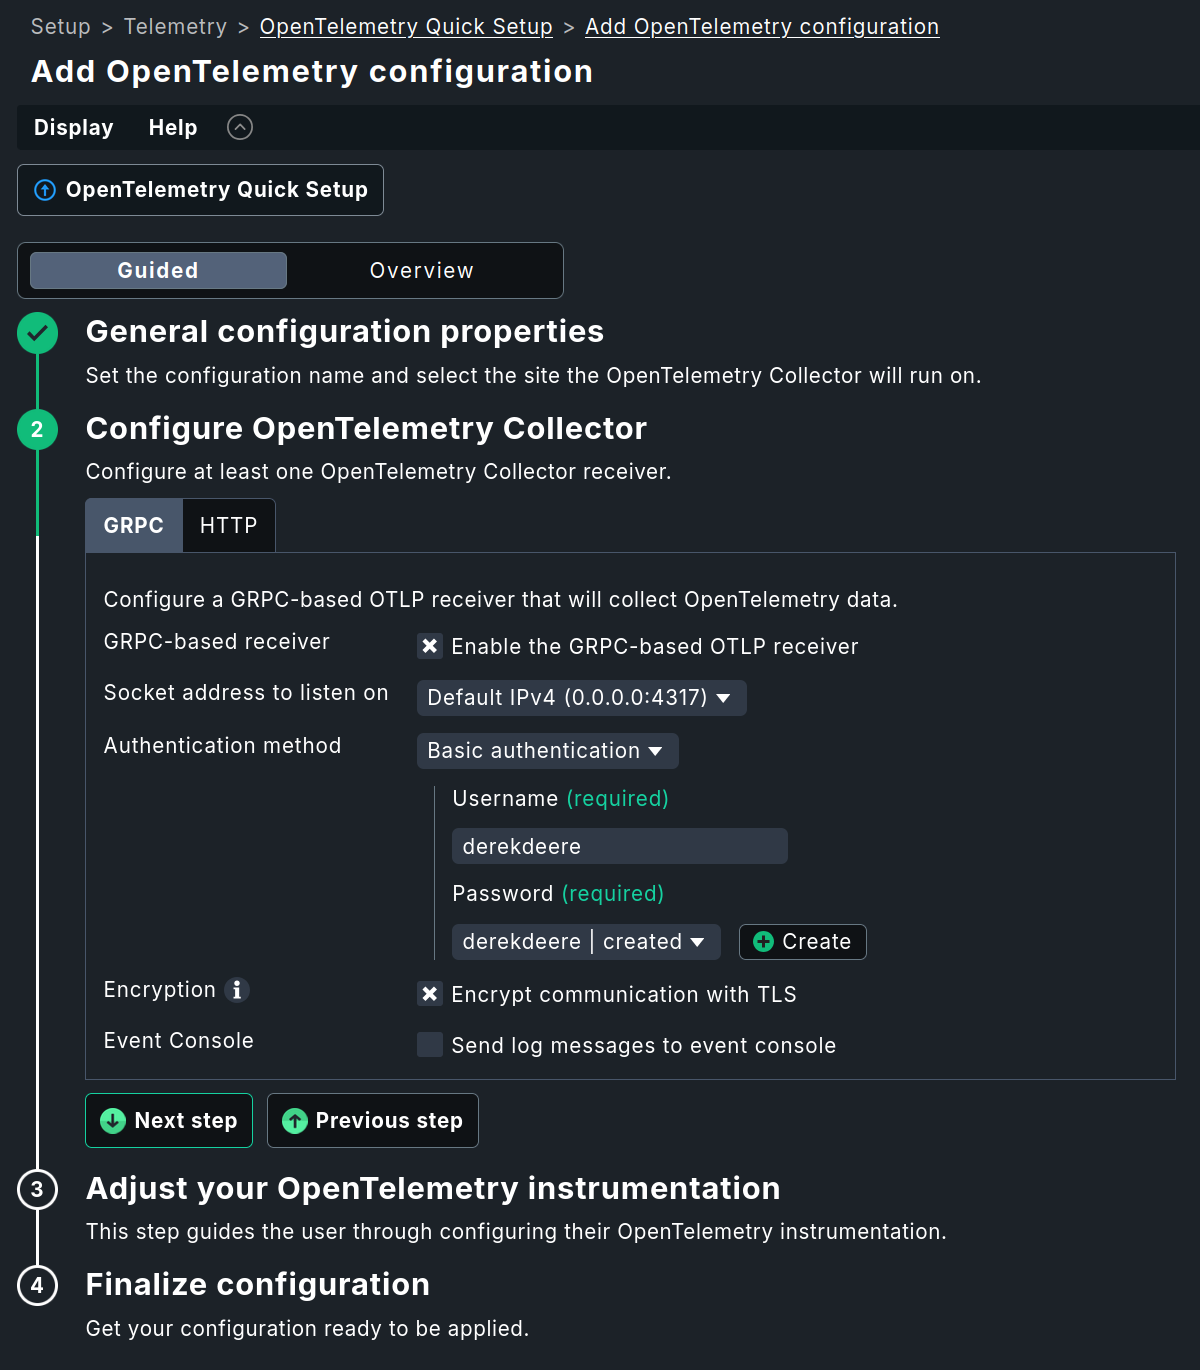
To set up the collector, navigate to Setup > Telemetry > OpenTelemetry Collector if the collector is to operate in passive mode and receive data. Click the Add OpenTelemetry Collector configuration button to start configuring a collector. In the General properties, assign a name for the new collector.
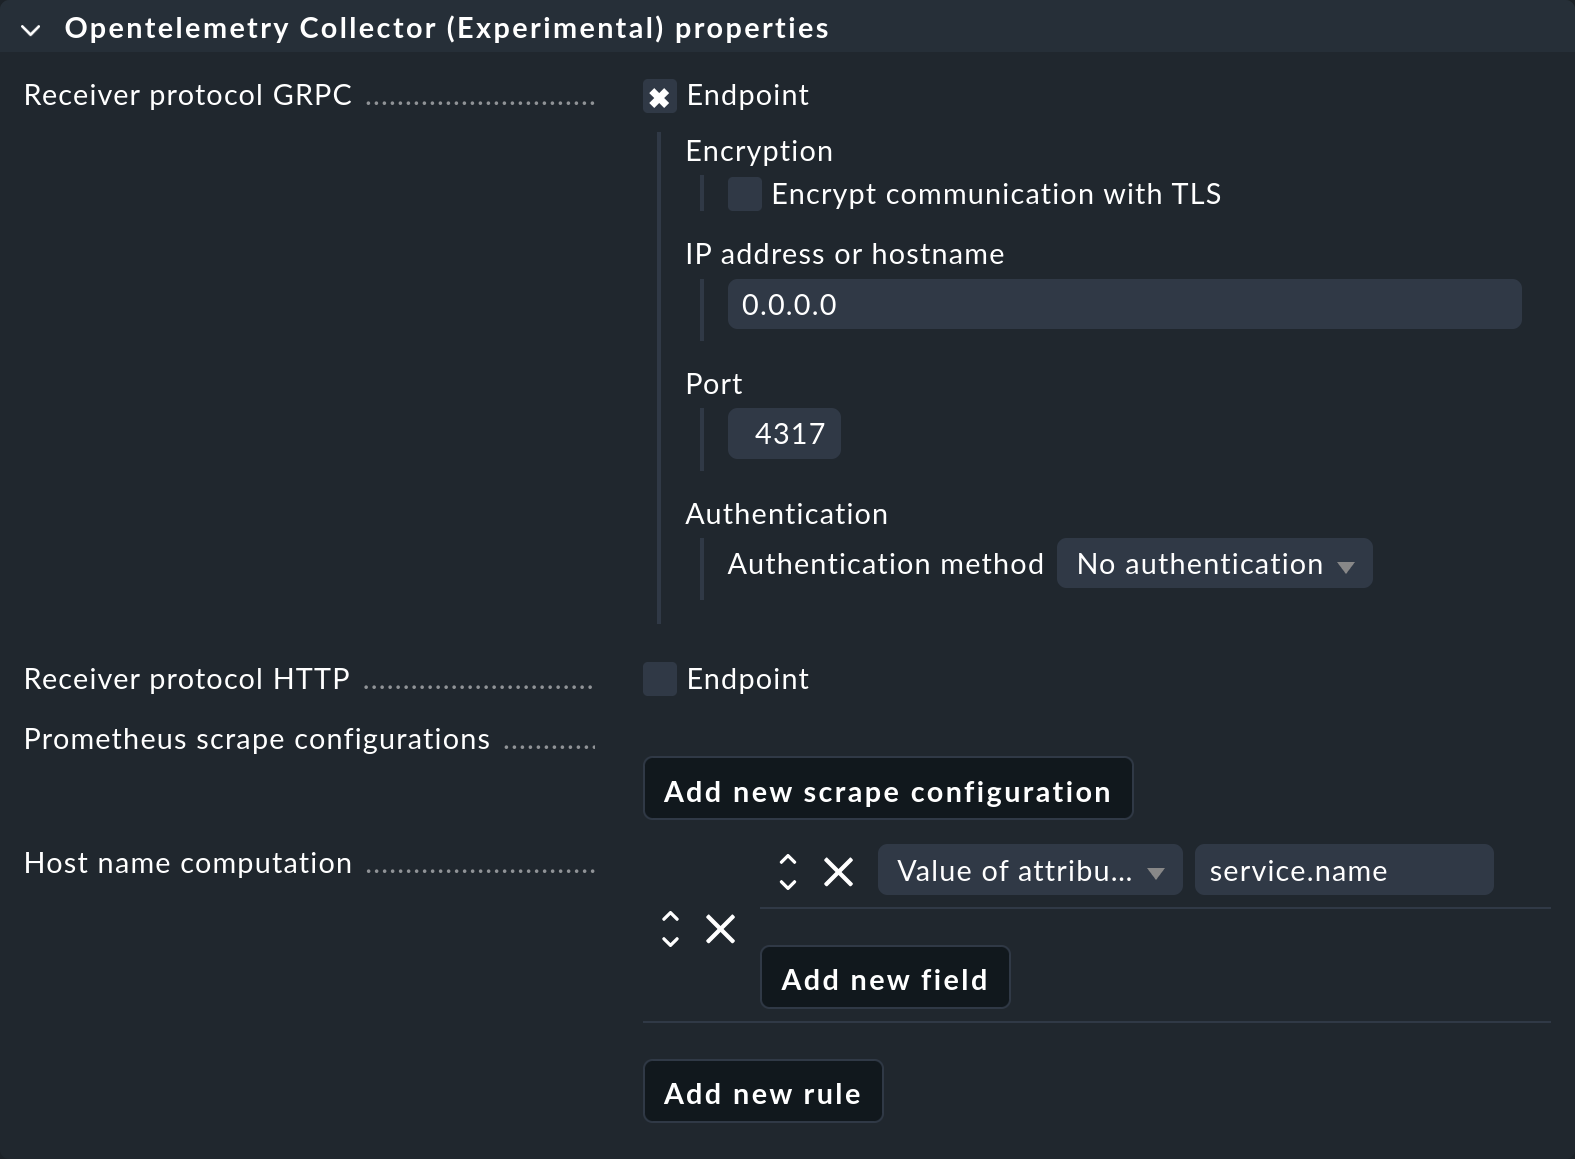
In the collector’s properties, you must configure at least one of the two push endpoints (via gRPC or HTTP). There, you then define the IP addresses and ports to be used. You also specify whether authentication and encryption are enabled. Note: If you activate Basic authentication, TLS encryption must be activated, since user name and password are transmitted in plain text and can be easily intercepted.
In many cases, applications sending OpenTelemetry data will refuse to communicate with TLS-encrypted collectors if the certificate used does not include the host name to that the sender is attempting to communicate. Navigate to Global settings and edit the option Site certificate subject alternative names to specify all the host names for which the server certificate should be valid. |
Sending logs to the Event Console
OpenTelemetry also provides ways to transmit log messages. The collector can forward these in Syslog format to any applications capable of receiving Syslog messages. This enables the processing of OpenTelemetry logs by the Event Console in Checkmk. You can enable this feature using the Send log messages to event console checkbox.
A Resource attribute for host name lookup is absolutely required.
In the simplest case, this is service.name, i.e., the name of the OpenTelemetry service, which in many cases can be easily mapped to Checkmk hosts.
Click Save to save the collector.
3.3. Setting up the Prometheus scraper (active)
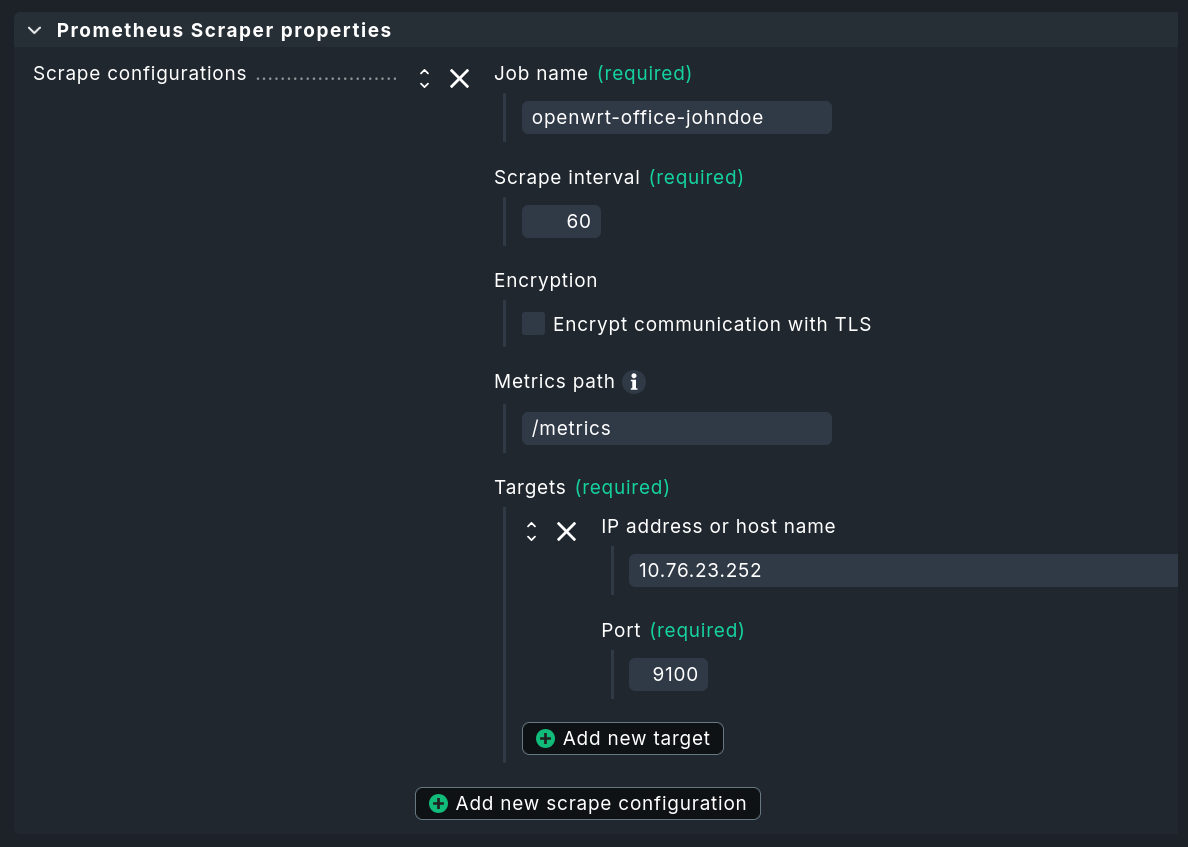
If you want the collector to behave actively — that is, to query Prometheus endpoints — use Setup > Telemetry > Prometheus scraper. Click the Add Prometheus scraper configuration button to start setting up a new scraper.
The Job name specified here is converted by the OpenTelemetry Collector to the service.name attribute.
In many cases, you will later want to assign this to a host name.
The other parameters specify access to the scraping endpoint:
For example, an endpoint accessible at http://198.51.100.252:9100/metrics results in setting IP address or host name to 198.51.100.252, Port to 9100, and Metrics path to /metrics.
For unencrypted HTTP, leave the checkbox next to Encrypt communication with TLS unchecked.
4. Sending test data to the collector
You will likely want to set up the OpenTelemetry Collector for Checkmk because somewhere in your IT environment, something is already generating some OpenTelemetry metrics. If this is not (yet) the case, or if you simply want to try out the setup on a test system, we present two quick-to-set-up sample applications in this chapter. With the setup completed up to this point, you can first check the Self-monitoring of the collector to verify that data is being received and forwarded. The received data ultimately ends up in metrics backend—where you can, for example, view raw data in the SQL console. In the following steps, you can use the data directly in monitoring.
We provide the simplest example application in our GitHub repository as Hello metric. This runs in a virtual Python environment and creates an OpenTelemetry service with an OpenTelemetry metric. Notes on required Python modules and how to get started can be found in the repository.
The 'Dice Roll' sample application featured on the OpenTelemetry website works very similarly to 'Hello metric'.
This sample application is more practical than 'Hello metric' in many respects.
For example, 'Dice Roll' sends OpenTelemetry metrics every time the application server is called (and only then!) and introduces the 'Counter' data type.
You can use the virtual Python environment created for the 'Hello metric' example to try out the 'Dice Roll' example as well.
However, to do so, you must also install the Python module flask (pip install flask) and create the app.py file in the version extended with metrics, as described in this guide.
In the following call, replace the Checkmk server as the target (here 198.51.100.42 with gRPC port 4317):
Your Flask server is now ready and can be accessed via the selected port (in this case, 8080) to roll a die with each request.
You can view the die roll data, for example, by running curl -v http://localhost:8080/rolldice.
Each die roll you trigger in this way is transmitted to Checkmk as a data point.
5. OpenTelemetry data in monitoring
There are three main ways to make use of incoming data in monitoring. This chapter introduces these three options. The amount of the generated services and visible metrics, as well as the flexibility and system load, differ across all of the methods. For this reason, it is important to choose the appropriate monitoring method for each application scenario.
The custom graphs visualize data directly from the metrics backend in dashboards—without going through services and without even involving the monitoring core. You can create rules for the special agent described in the following list item directly from custom graphs.
Using Custom Metrics (by creating custom queries) is useful when you want to map certain data points received via OpenTelemetry to existing or newly created hosts. This makes it possible to map data from different sources to the hosts to which they belong, either organizationally or technically. The overhead of this method is slightly higher, but this is usually offset by the fact that a smaller volume of data is queried.
Using dynamic host management is ideal when it is possible to precisely map OpenTelemetry services to Checkmk hosts and OpenTelemetry metrics to Checkmk services. Since a dedicated fetcher is used and data therefore takes a very direct path, this approach is highly efficient.
5.1. Creating custom graphs
Under Customize > Custom graphs, you can create a custom graph. The process differs slightly in some respects from graphs created from metrics stored in RRDs. For more details, see the article on measured values and graphing.
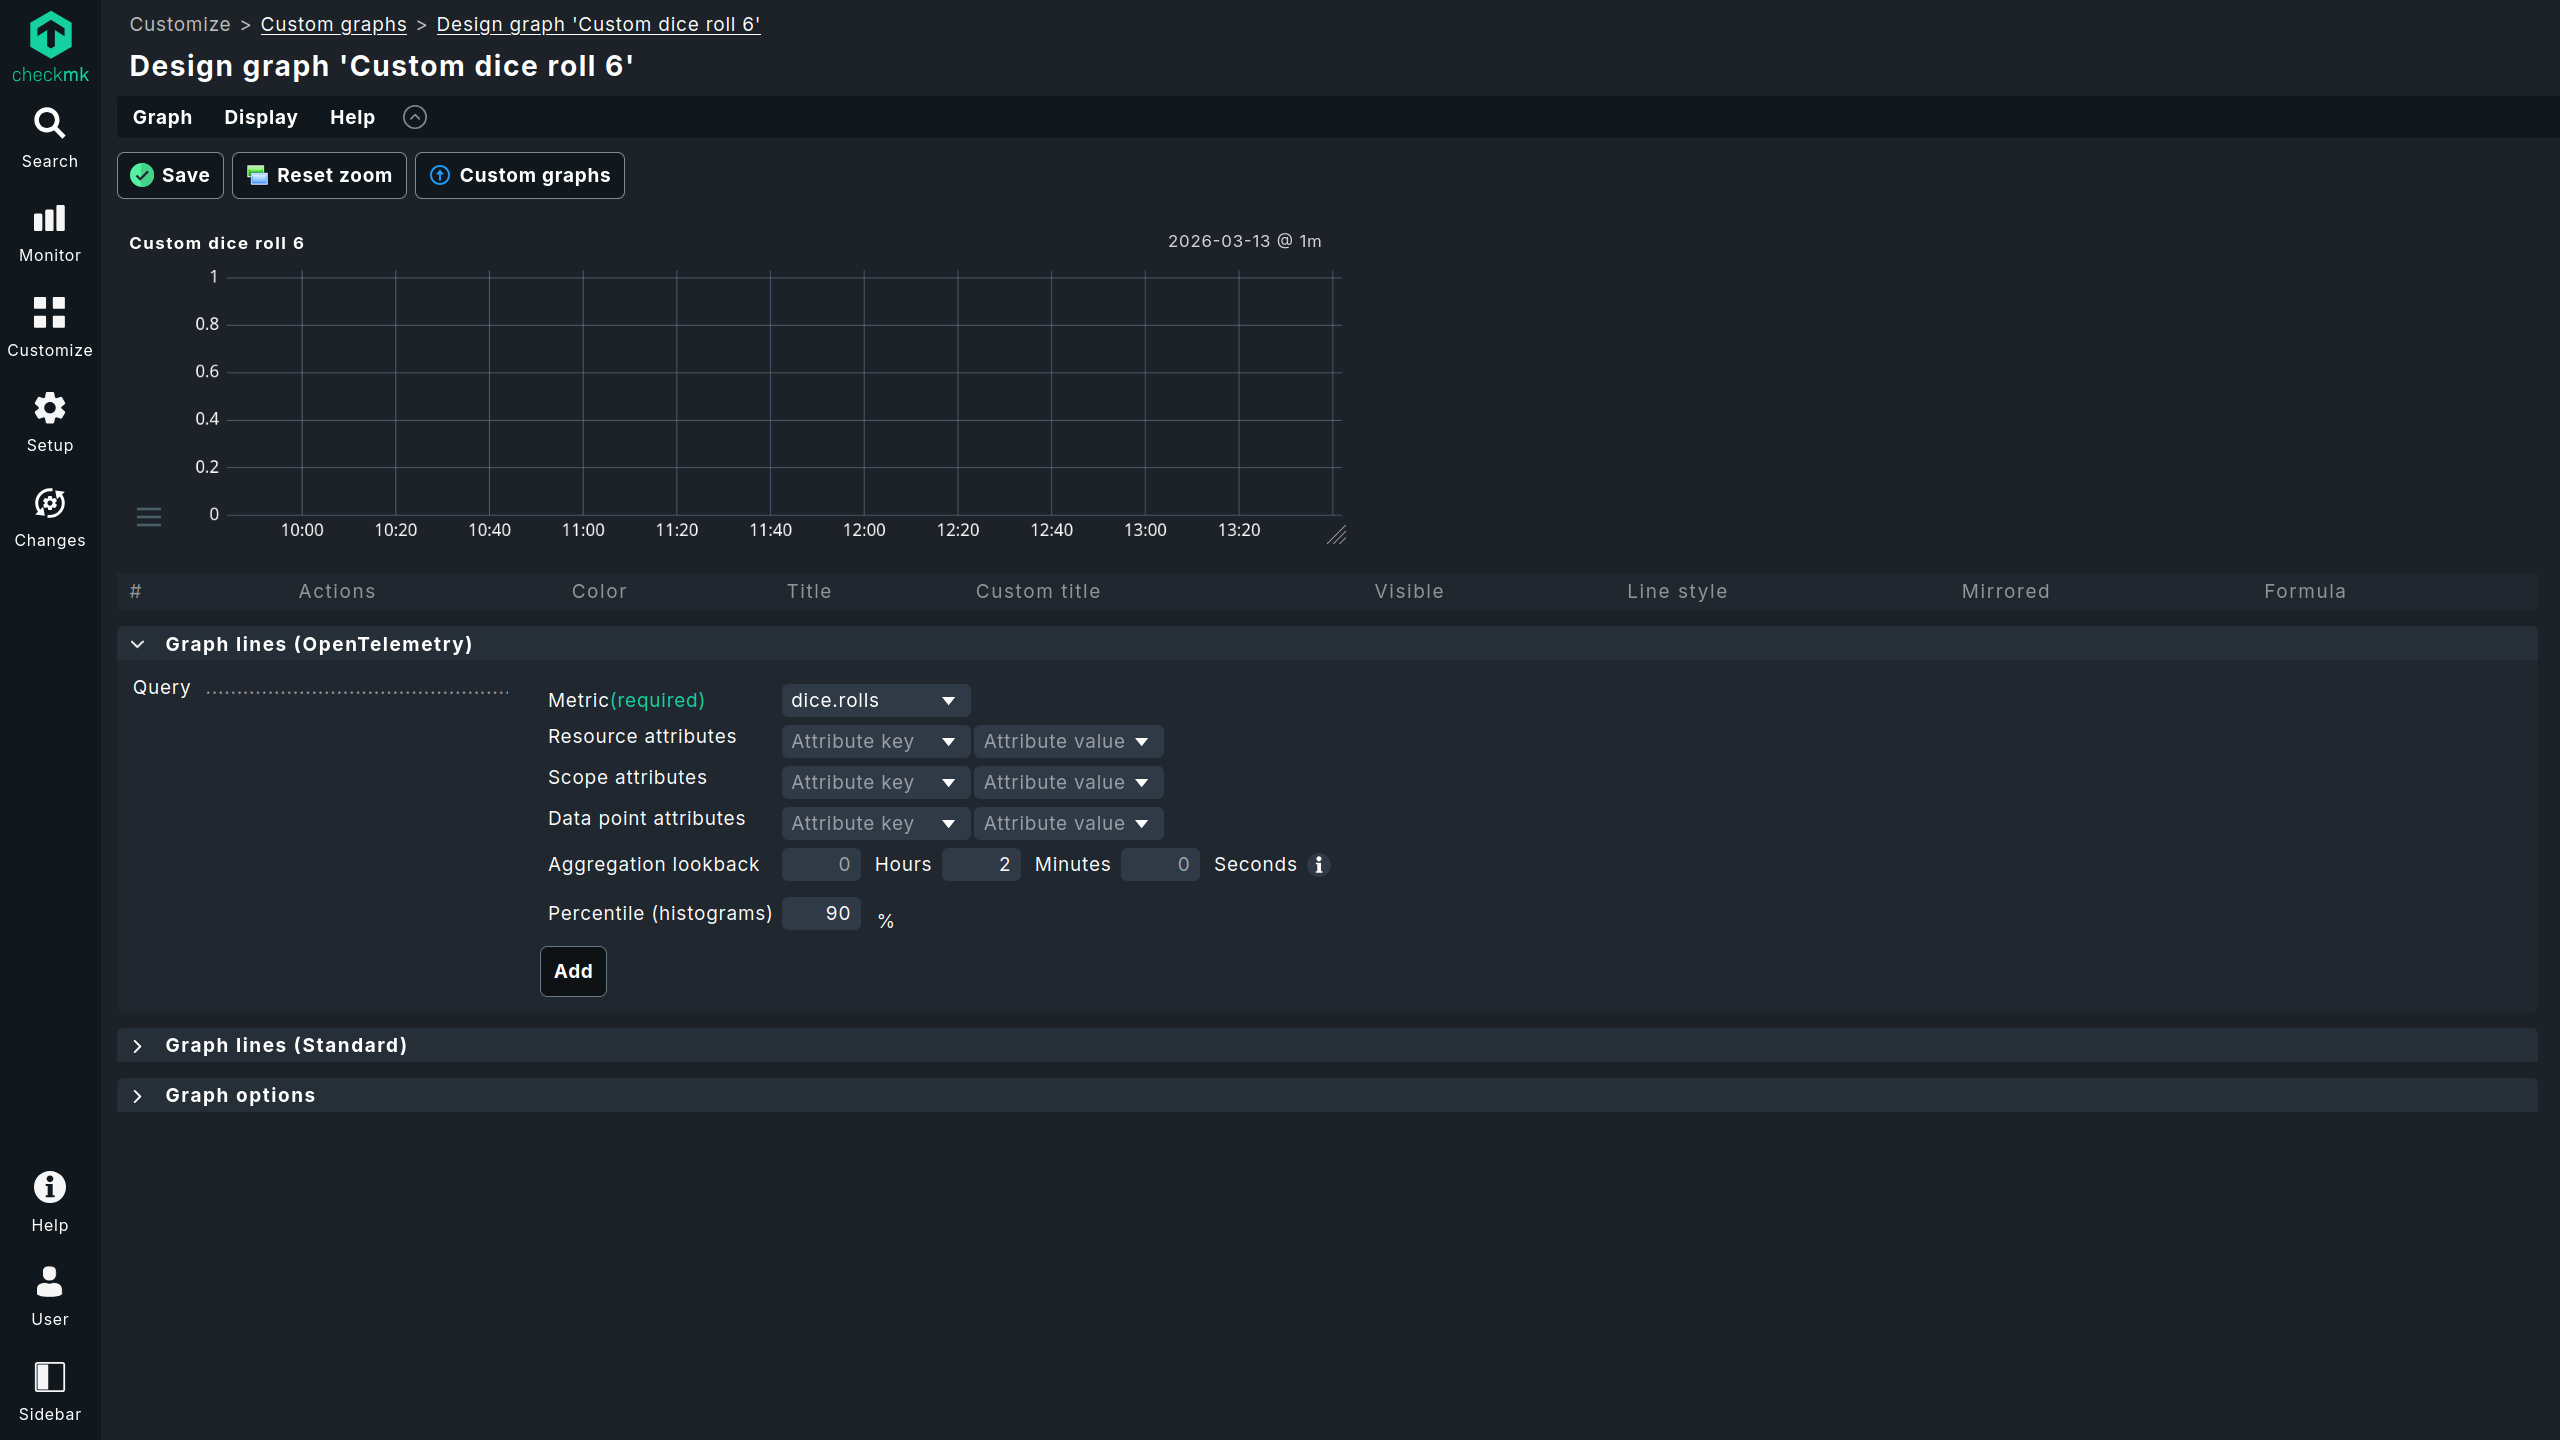
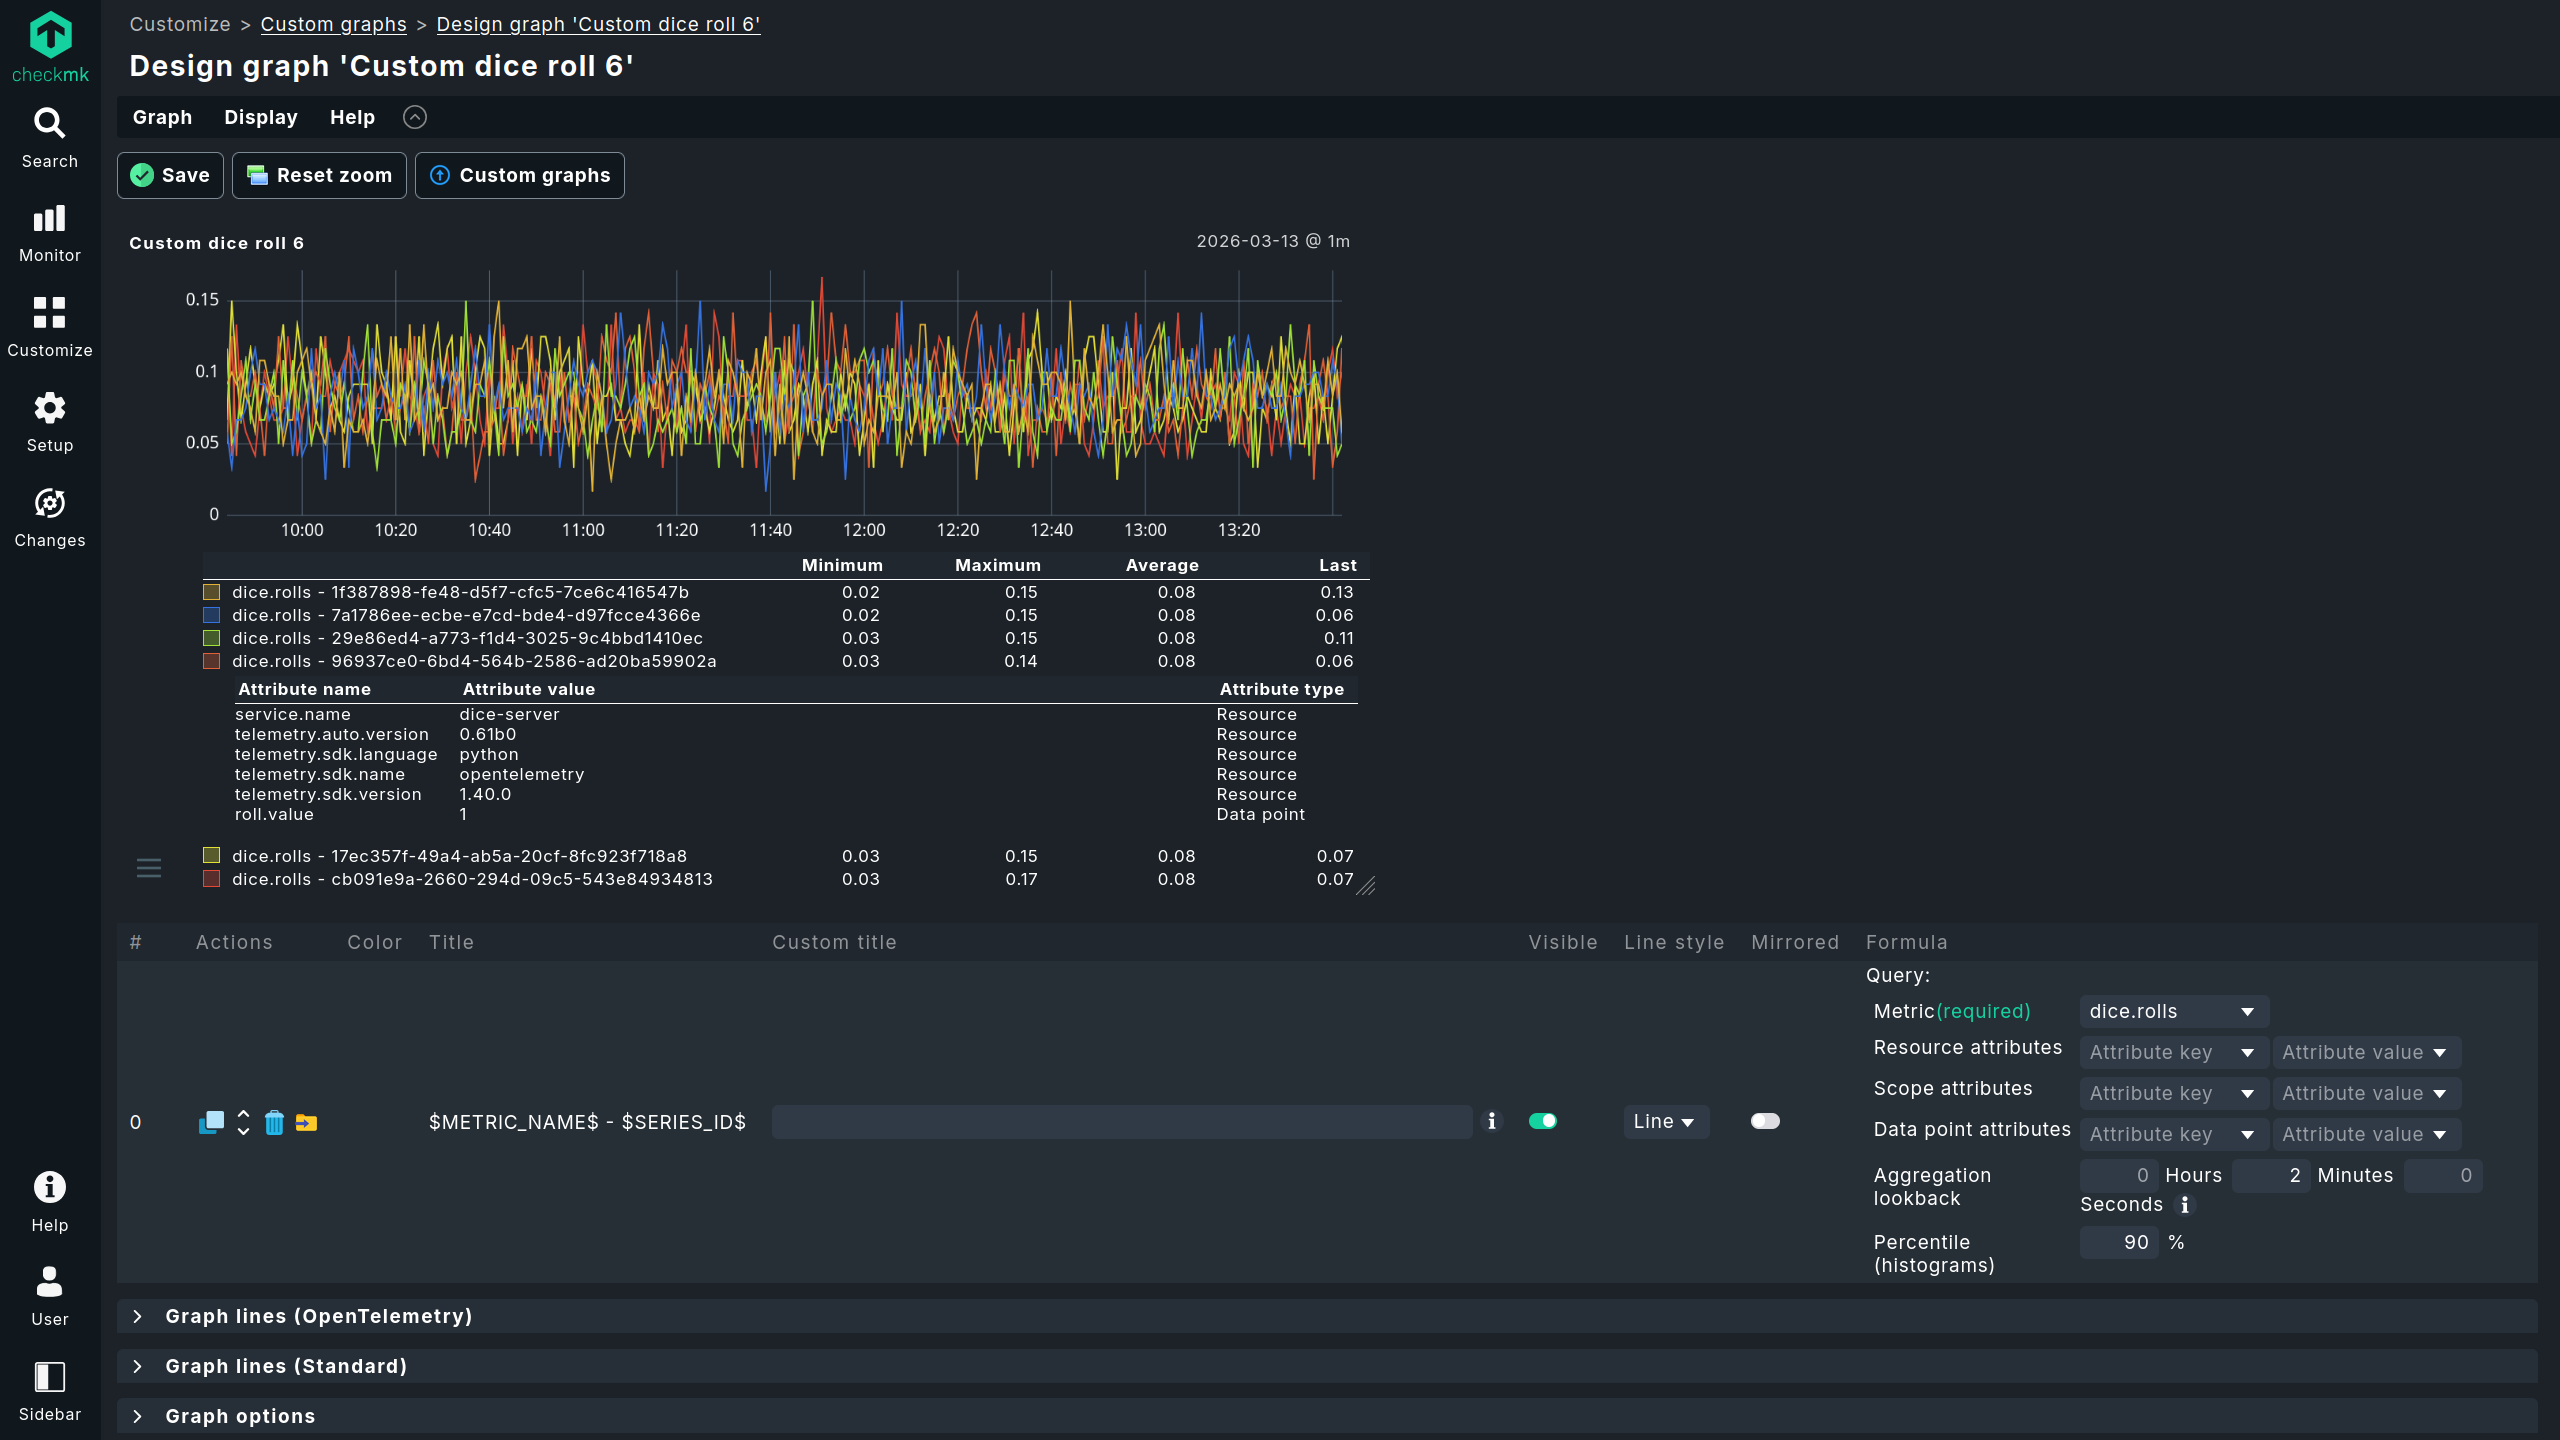
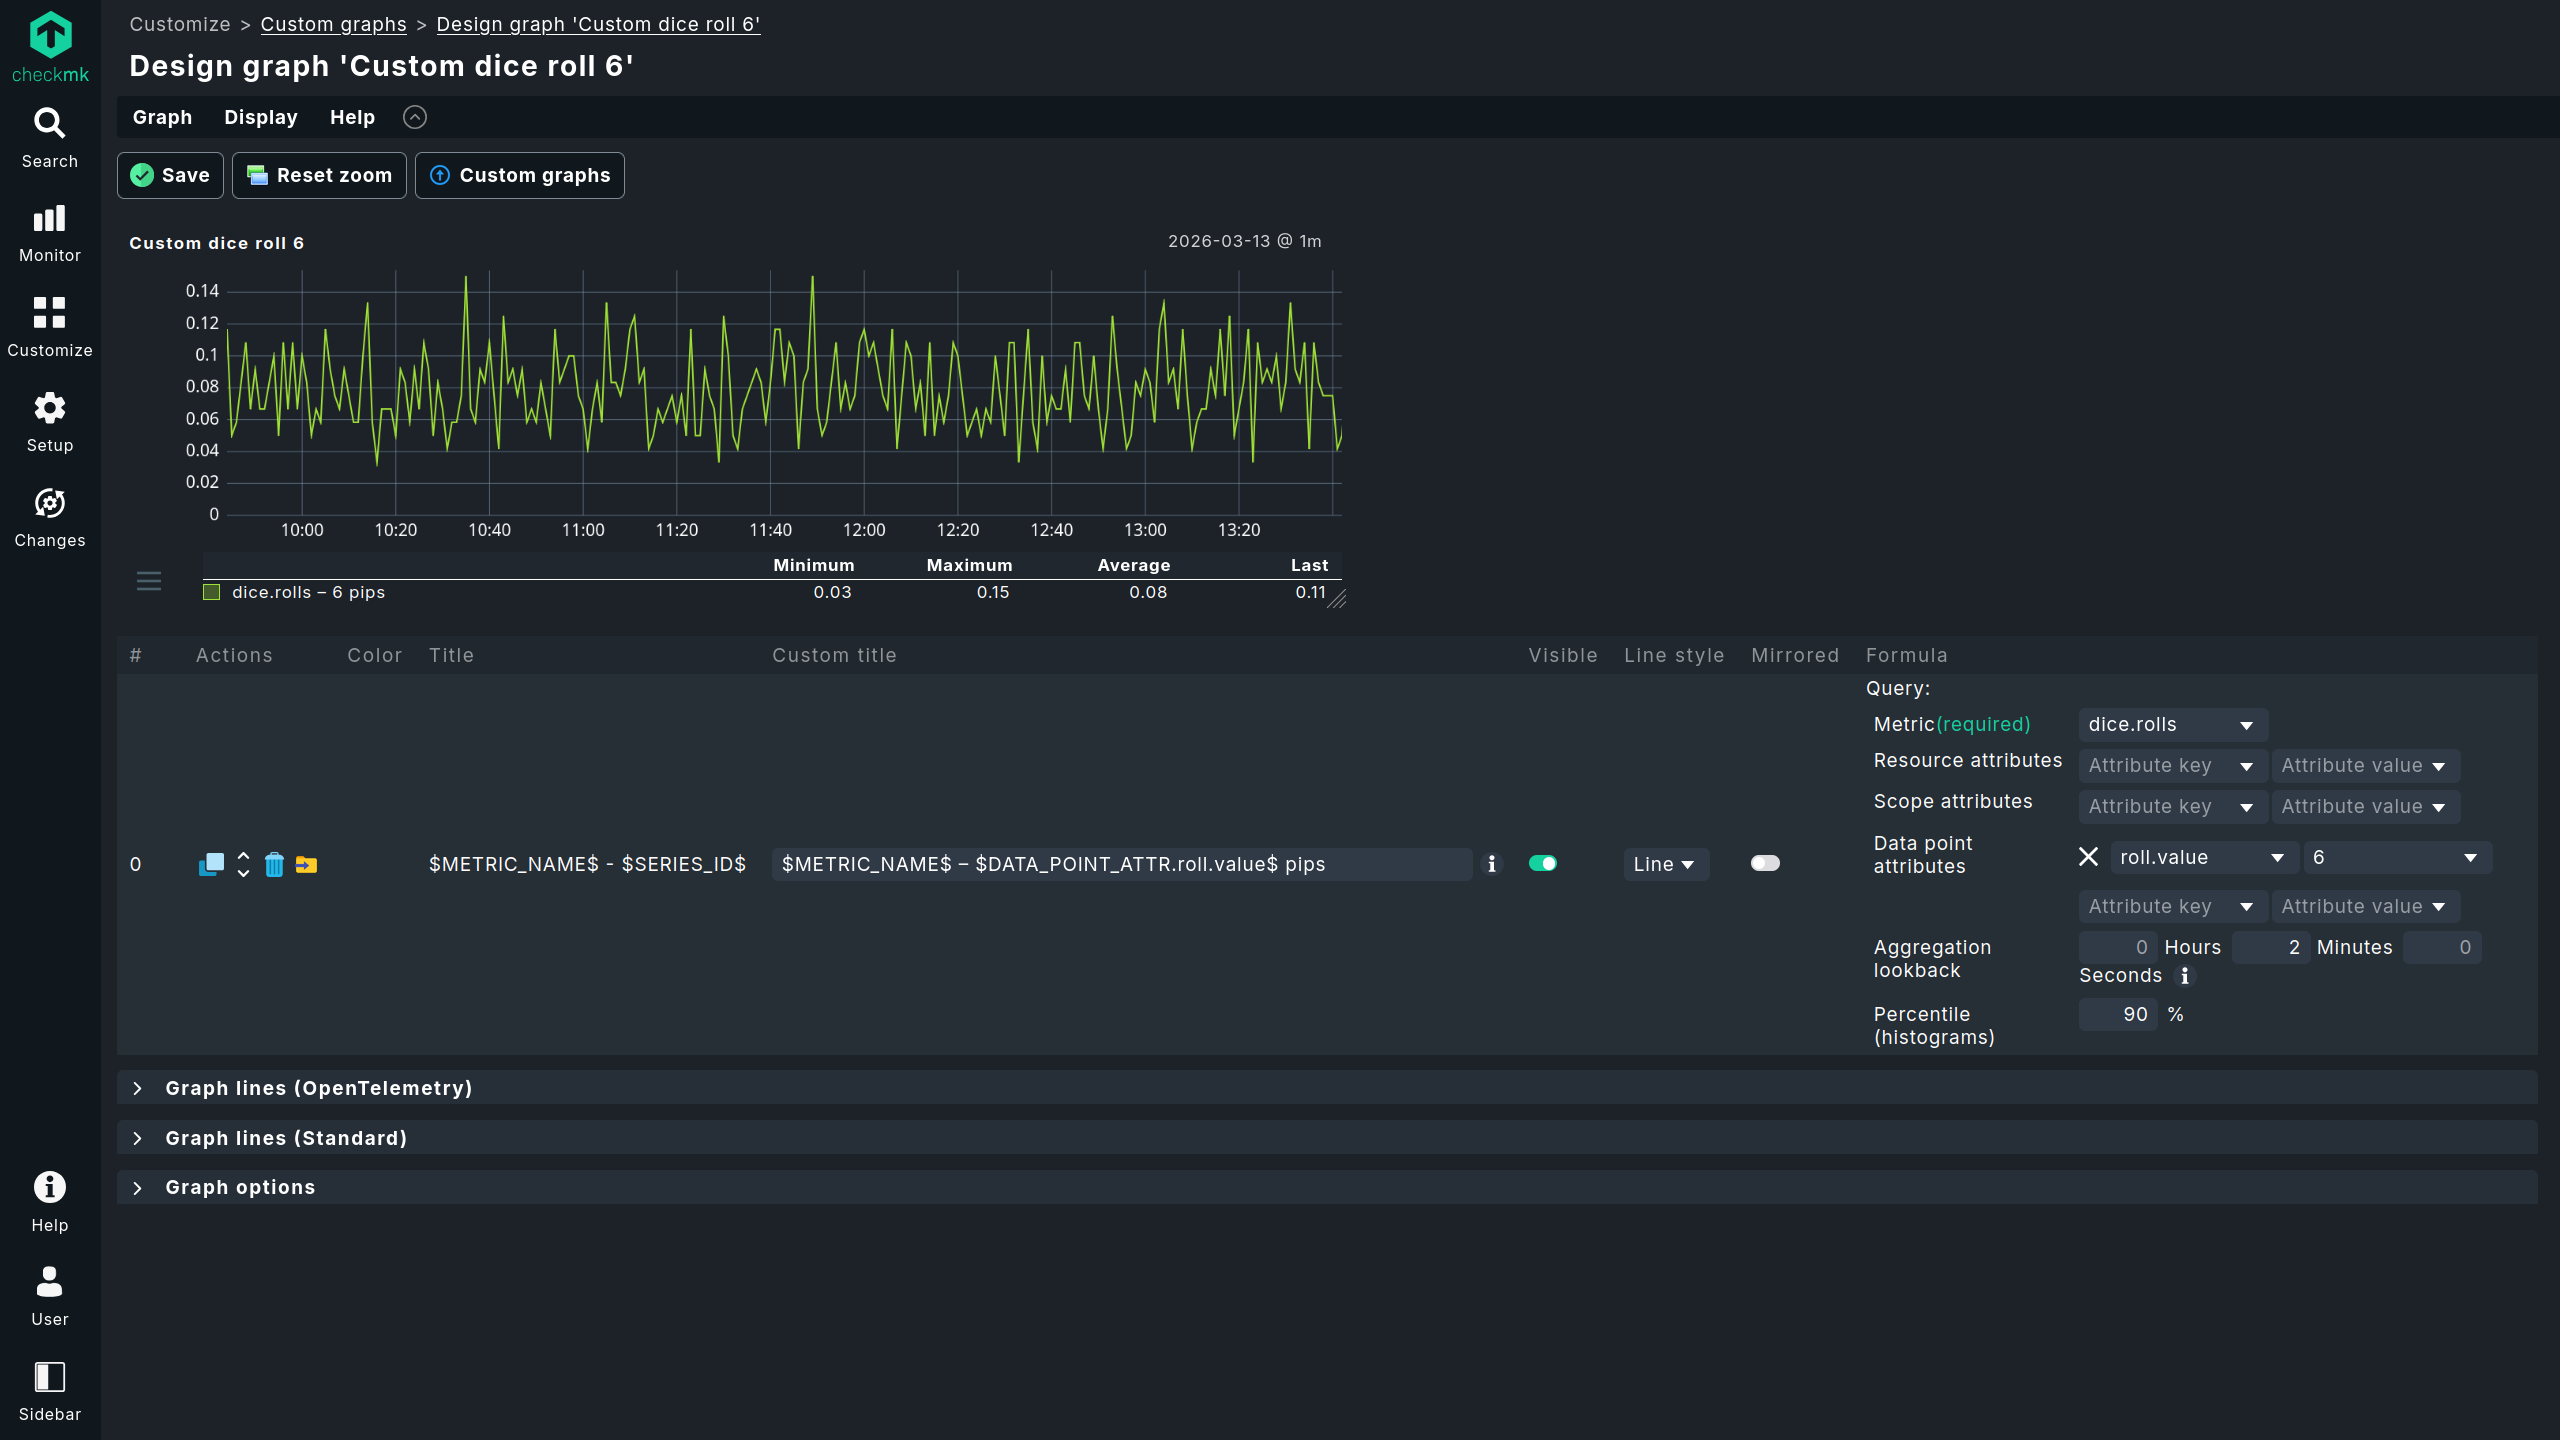
Once you have narrowed down the OpenTelemetry data points displayed in the graph sufficiently using the available attribute filters, you can use the export icon to export the created filters as filters for a special agent, which we will introduce in the following section.
The two most noticeable differences between custom graphs created from RRDs and those created from the metrics backend are:
The resolution: for RRDs, after two days the resolution is typically reduced to ten minutes; in the metrics backend, however, there is no change in resolution.
The retention period: for RRDs, the retention period is typically four years (configurable); for the metrics backend, it is two weeks (currently not configurable).
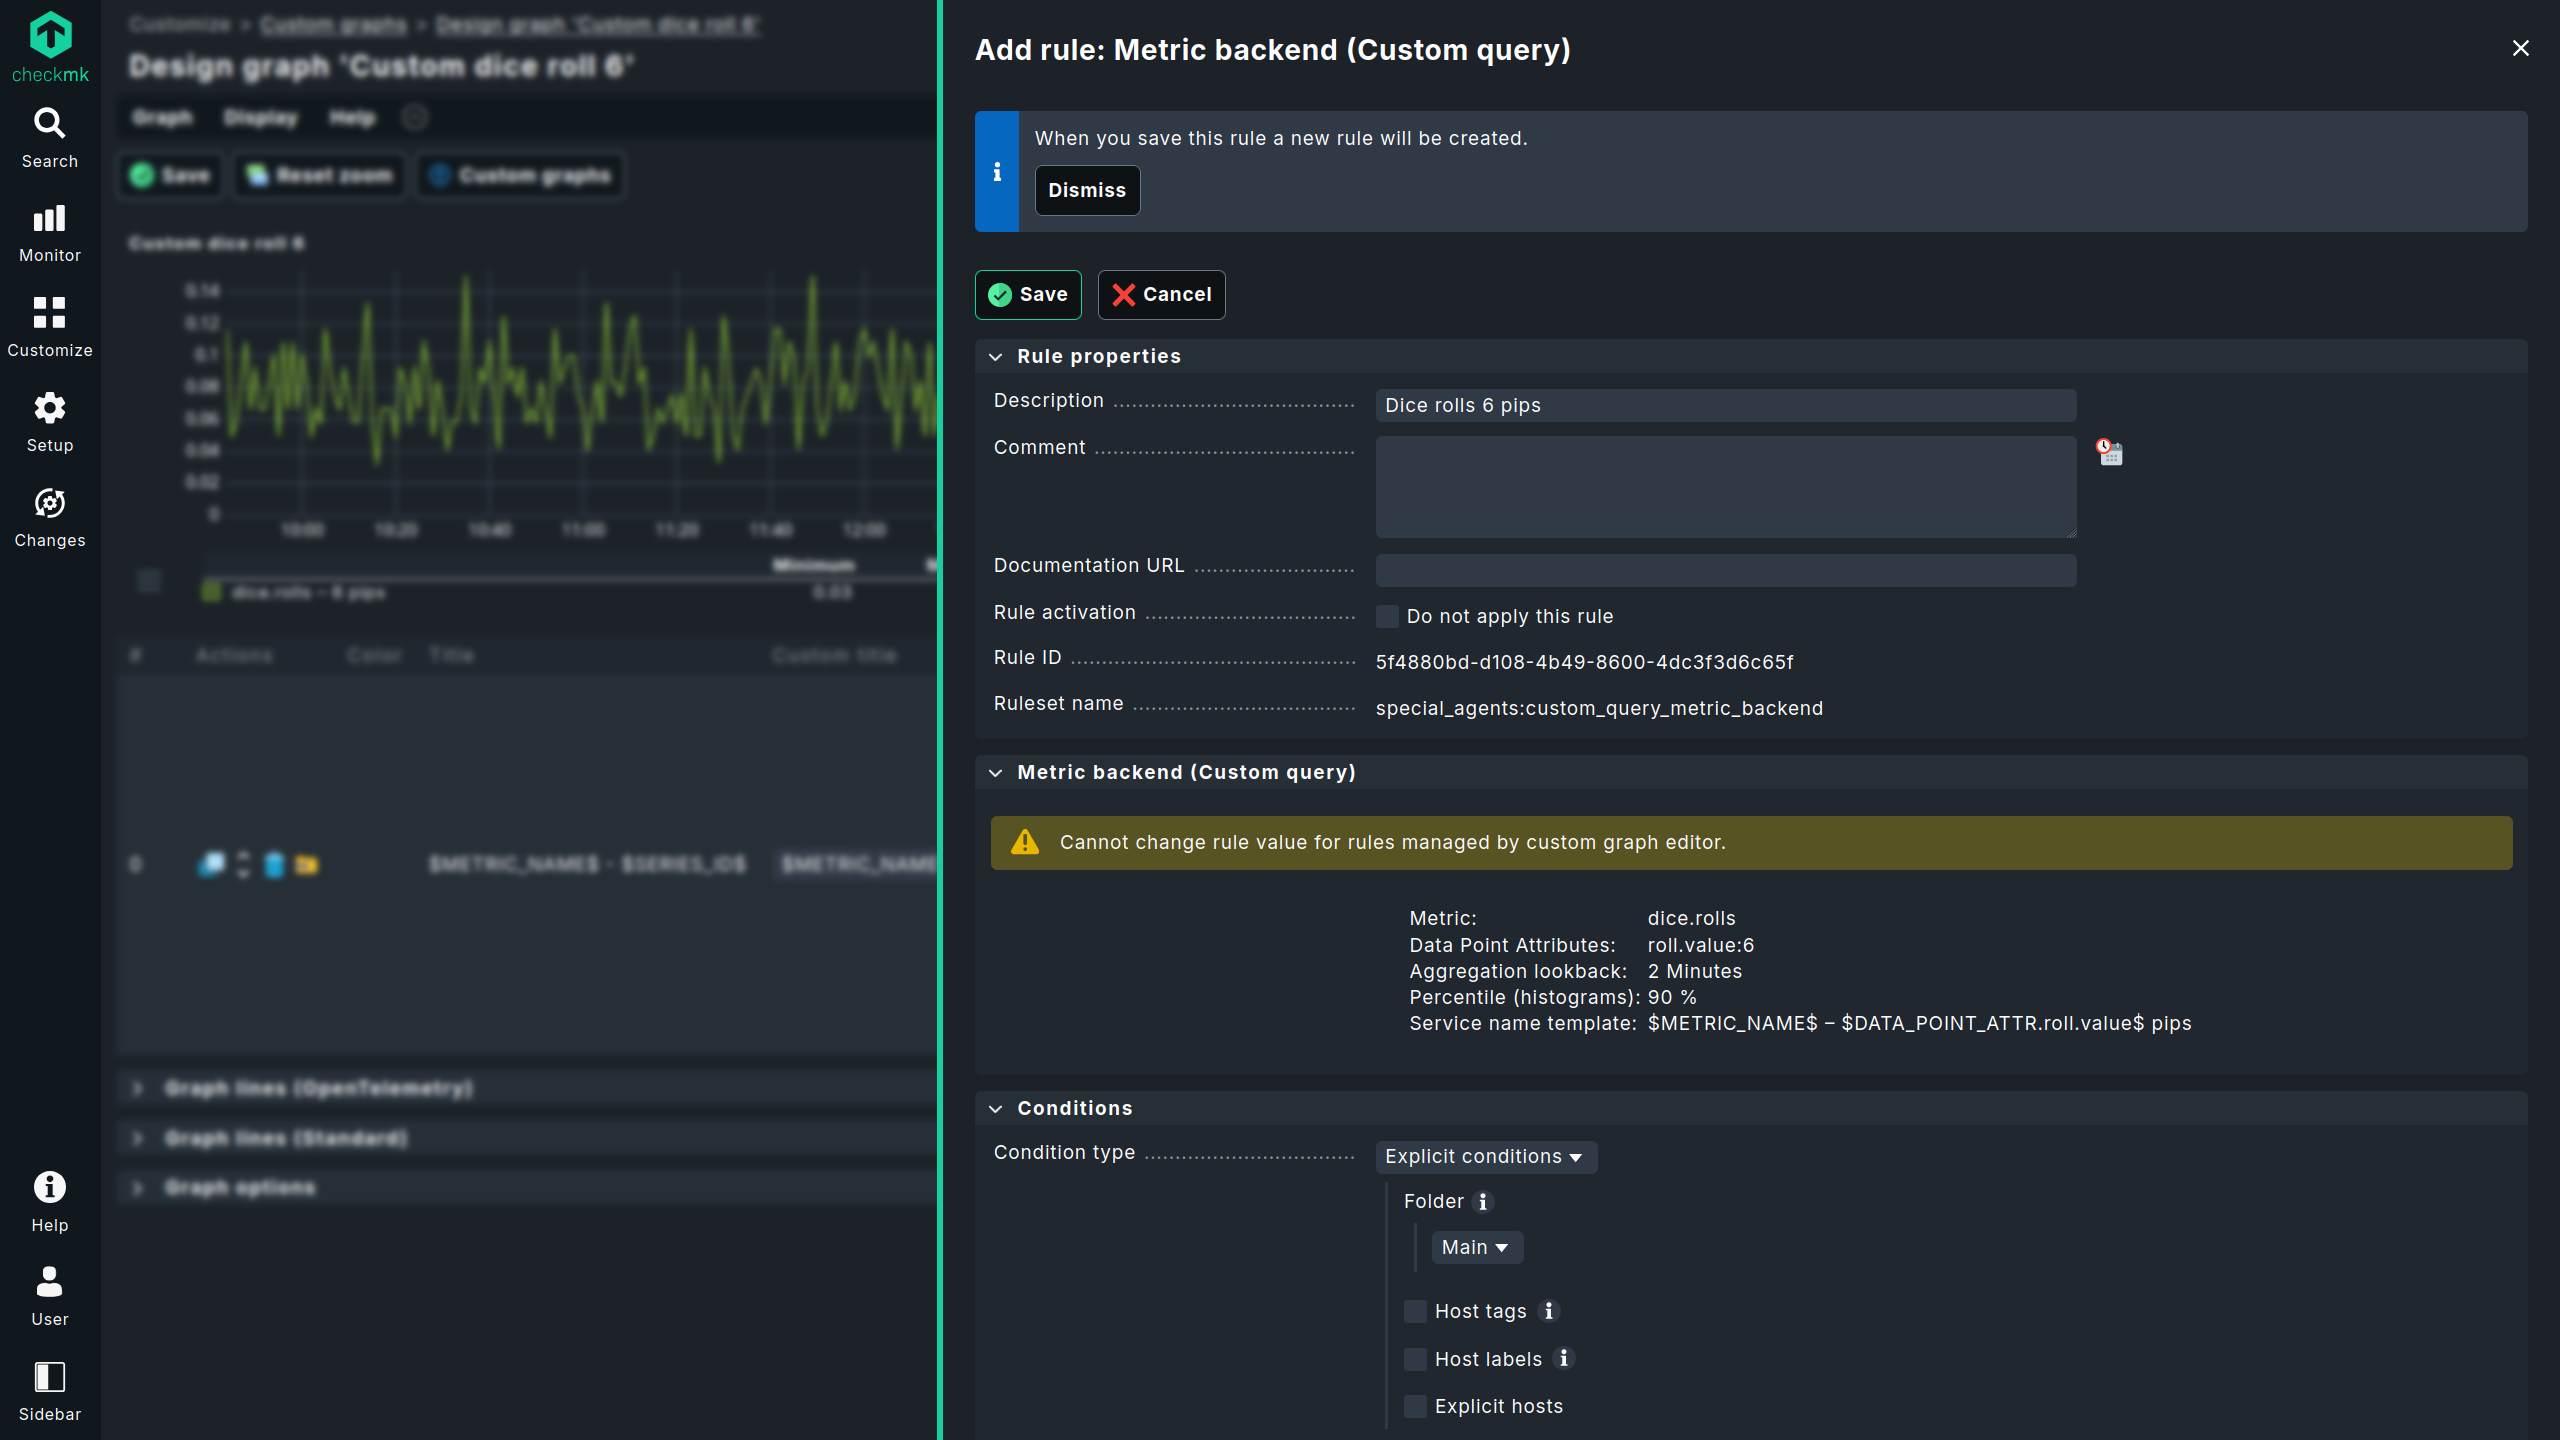
5.2. Assigning custom metrics to any host
As an alternative to the method via Customize > Custom graphs, you can configure the special agent under Setup > Agents > Other integrations > Metric backend (custom query), which makes individual metrics from the metrics backend available as Checkmk services. Under this menu item, you can also access configurations created from custom graphs for modifications with the special agent—with custom graphs only the creation of new configurations is possible. You can assign a custom metric created using a custom query to any host.
Custom metrics created from custom graphs are limited to a single OpenTelemetry metric as a source. If you need multiple OpenTelemetry metrics as sources, you must use the rules for configuring the special agent described in this section to add additional ones. If you create multiple rules for special agents from custom graphs, only the first matching rule will be executed. |
Since the metrics generated by the special agent follow the 'classic' path through the monitoring core and RRDs, they are not affected by the restrictions in distributed monitoring. You also have extensive options for naming; for example, you can combine free text with various macros, such as the original OpenTelemetry metric name.
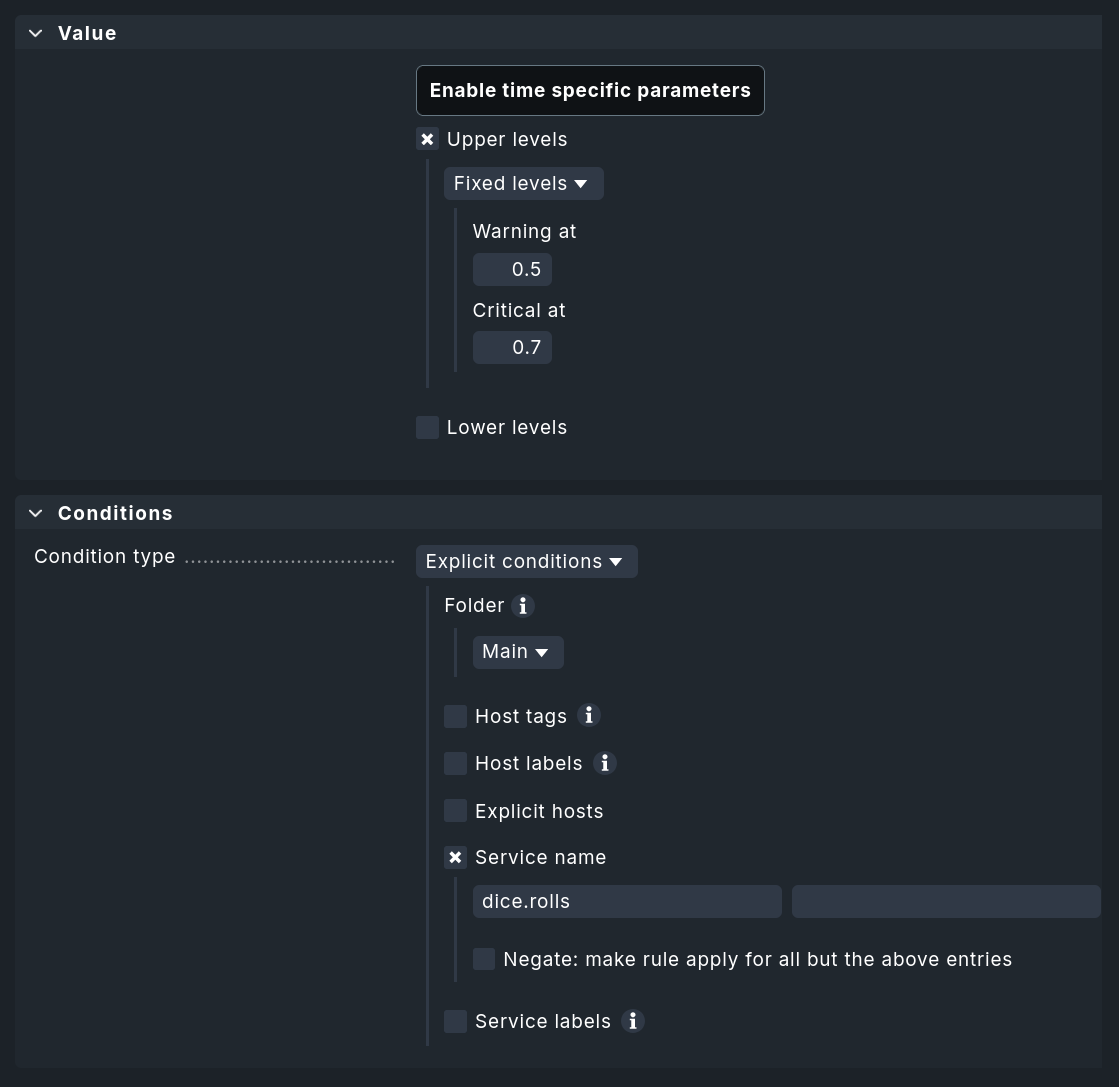
Configure thresholds
To assign thresholds to these custom services, you can create rules via Setup > Services > Service monitoring rules > Metric backend (custom query). The assignment follows the standard convention: You can define upper and lower thresholds for WARN and CRIT. The conditions for hosts and the matching of service names also correspond to what you are familiar with from other parts of Checkmk.
5.3. Setting up dynamic host management
To automatically create hosts, set up a new OpenTelemetry connection with dynamic host management. As a preliminary step, (at least for initial testing) we recommend creating a separate folder where the automatically-generated OpenTelemetry hosts will be stored.
You can set up the new connection for dynamic host management under Setup > Hosts > Dynamic host management > Add connection:
In the Connection properties box, configure at least the following settings:
Set Connector type to OpenTelemetry data - Metric backend.
Next, define the Attribute filters, which you use to preselect the criteria for creating hosts. These can be left blank. A value must be entered only for Resource attribute for hostname lookup.
In the example, the folder
OpenTelemetryTestis used as the target folder for the new hosts (Create hosts in).Select the Host attributes to set according to your system environment. In most cases, the hosts generated from Resource attributes will be virtual and used only in the context of OpenTelemetry. Consequently, you can generally use only special agents as monitoring agents (Configured API integrations, no Checkmk agent) and leave the settings for IP addresses set to No IP.
Since many hosts can sometimes be created (and deleted) in dynamic environments, you should set appropriate values for the retention period of deleted hosts and the maximum number of hosts retained by this OpenTelemetry connection.
For more information on the other parameters, see the article on dynamic host management.
Save the new connection using Save and activate the changes.
Once the dynamic host management has been set up, the changes have been activated, and OpenTelemetry data is being received, hosts with the expected services will appear automatically. Configuring a special agent is no longer necessary: Instead of the long processing chain involving special agents and check plug-in, special fetchers now query the metrics backend and pass Checkmk metrics and service states directly to the monitoring core.
Configuring thresholds
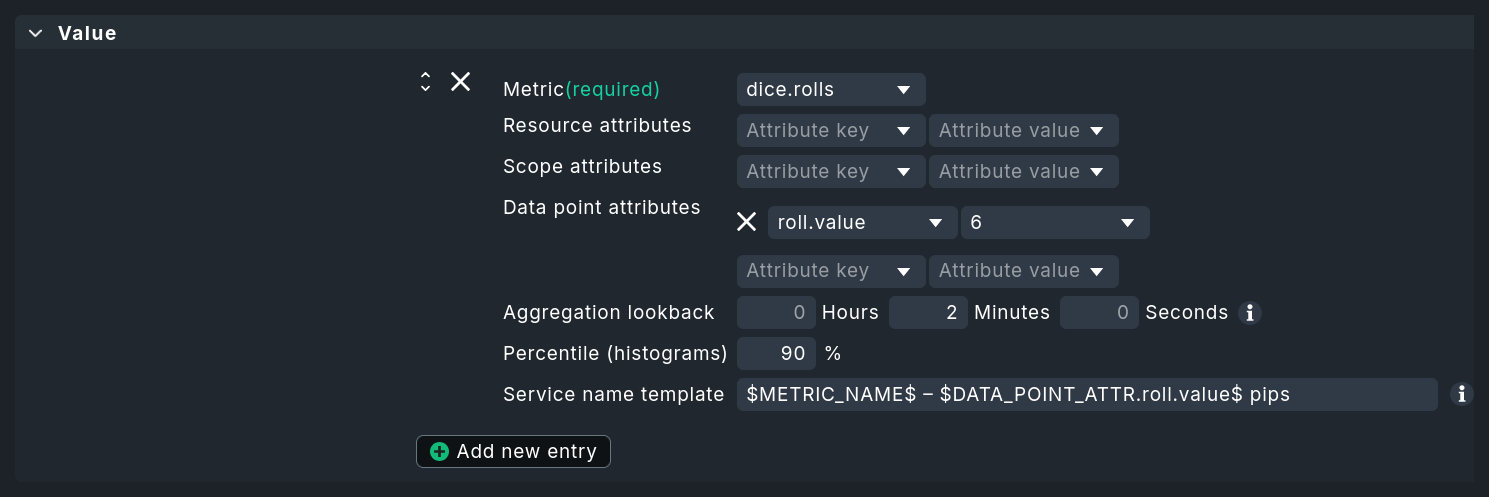
You can set thresholds, and more, for services using the Setup > Services > Service monitoring rules > OpenTelemetry rule.
Here, you can define rules for individual metrics or all metrics for a service.
At this point, the configuration options are significantly greater than for custom metrics created via a custom query.
The example screenshot shows the selection of the counter shown above for the OpenTelemetry metric dice.rolls.
If multiple sources provide data assigned to the same Checkmk service, you can also specify whether an aggregation (such as a sum or average) should be performed, or whether the most recent, largest, or smallest data points within an interval should take precedence.
RED (Rate, Errors, Duration)
If OpenTelemetry metrics contain the data points *.http.server.request.duration (for HTTP-based services) or *.rpc.server.duration (for RPC-based services), Checkmk will automatically generate services that calculate rates (events per second).
If these data points are missing, *.traces.span.metrics.duration will instead be used for the calculation of metrics that include spans.
By default, a 5-minute interval is set. Under Setup > Services > Service monitoring rules, you will find the rules OpenTelemetry RED Requests, OpenTelemetry RED Errors, and OpenTelemetry RED Latency, which you can use to adjust this interval.
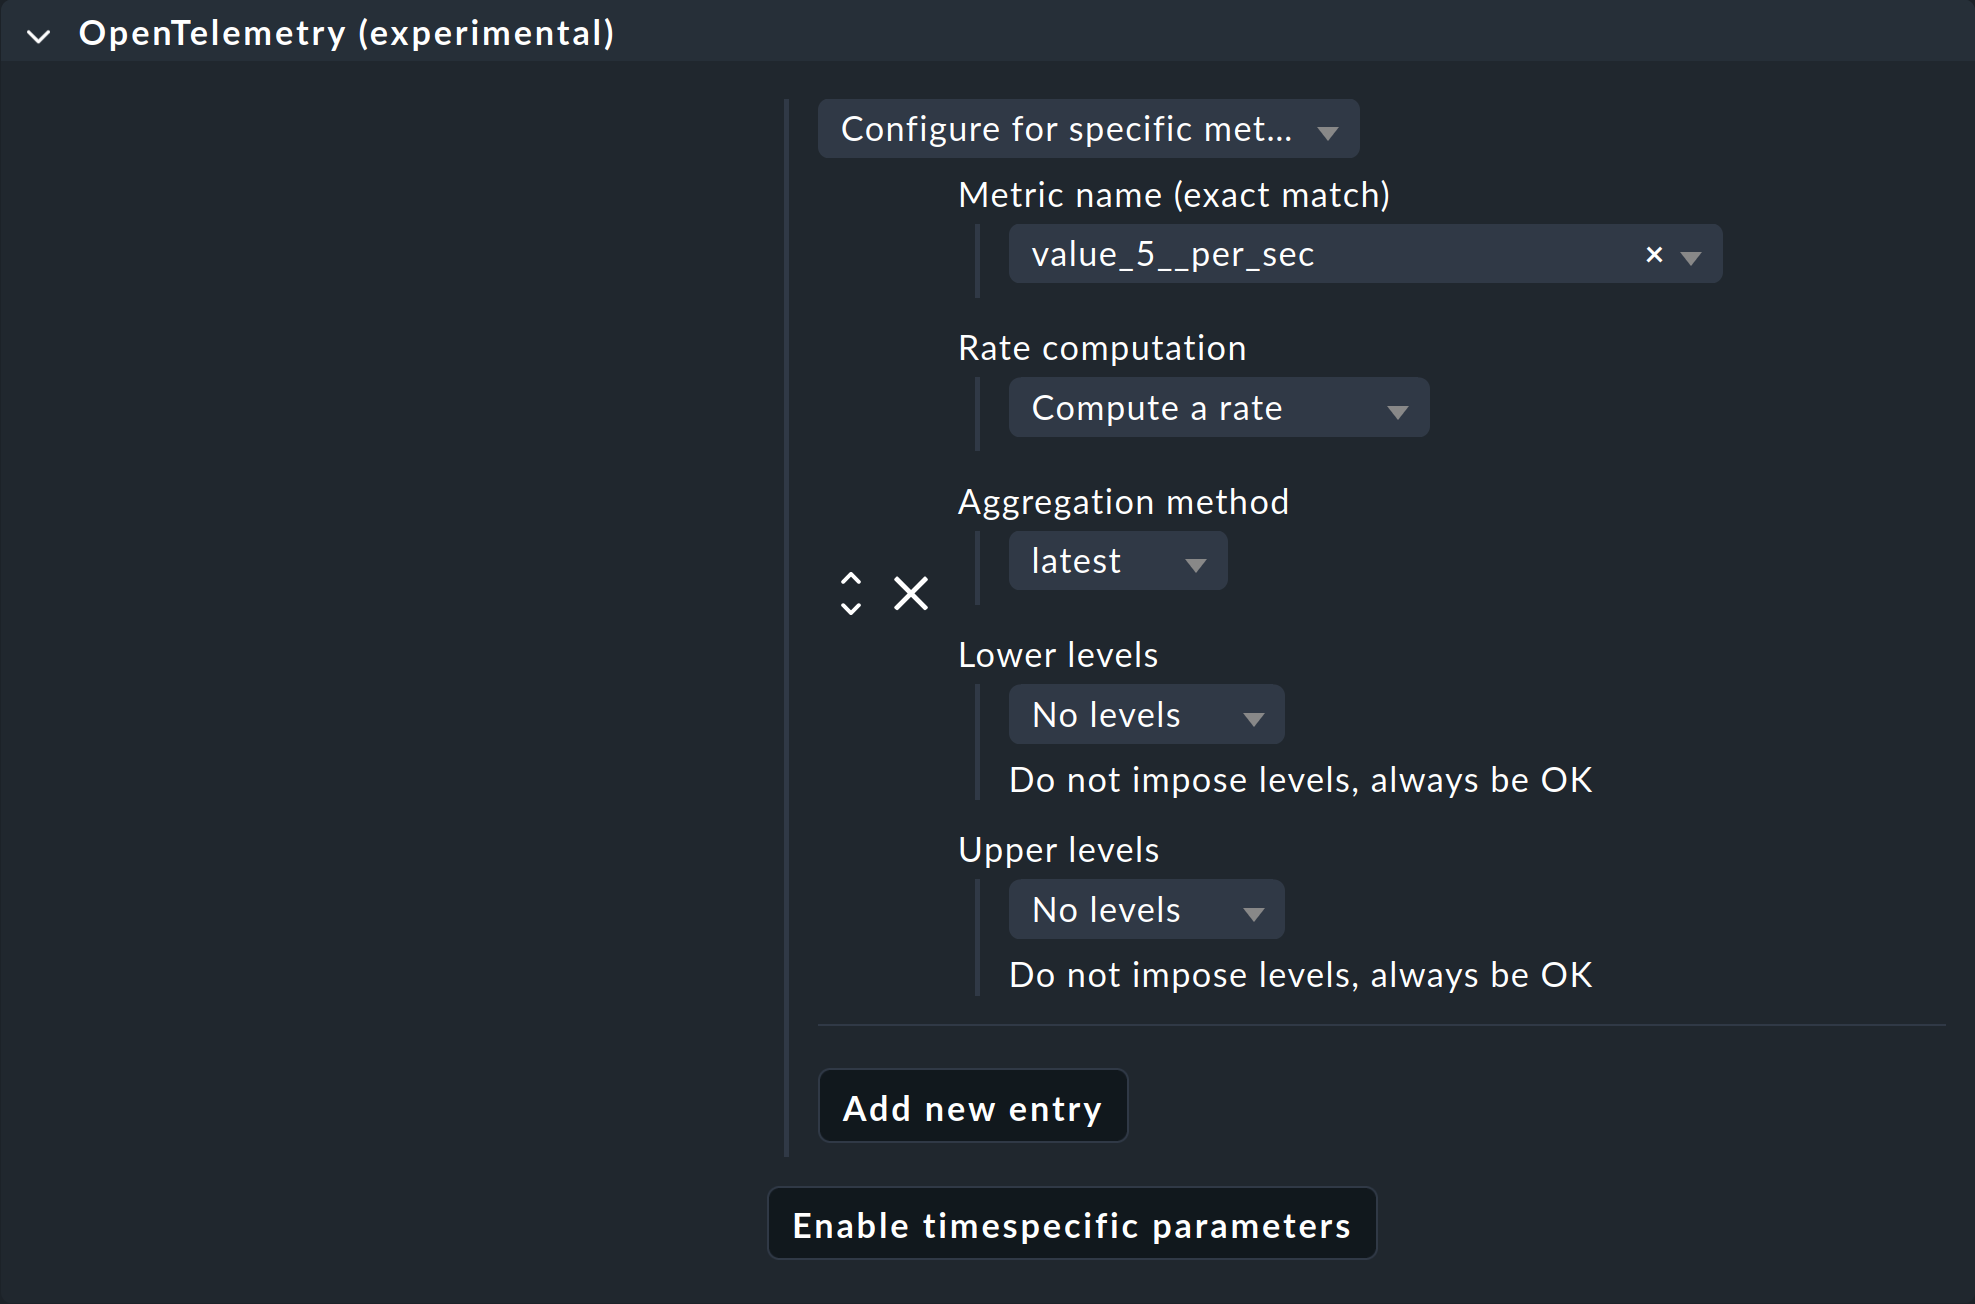
Rates are always calculated using the first and last data points of the specified interval. This means that, with OpenTelemetry data arriving every minute, there are four minutes between the first and last data points. This should make it clear that significantly shorter intervals make little sense: With data arriving every minute and a one-minute interval, the first and last data points would be identical, and the calculated rate would therefore always be zero.
If a metric does not contain the aforementioned data points, you can force rate calculations for counters using the rule shown above Setup > Services > Service monitoring rules > OpenTelemetry. This is useful, for example, for dropped network packets or failed requests.
6. Self-monitoring of the collector
If a Checkmk agent version 2.5.0 or higher is installed, Checkmk will detect the OMD mysite OTel collector service while monitoring the Checkmk server on which the Checkmk site mysite is running and which has an OpenTelemetry Collector enabled.
If multiple Checkmk sites are running on the Checkmk server, multiple examples of this service will also be found.
The thresholds for transitioning to WARN and CRIT are the memory usage thresholds specified in the global settings (OpenTelemetry Collector memory limit).
In addition to memory usage, the service displays graphs for incoming OpenTelemetry metrics, those forwarded to the metrics backend, and those rejected. This can help with debugging ("Is any data even reaching the collector?") or be useful for identifying bottlenecks ("Whoa, there’s always a lot of activity here at 2 a.m.!").