1. Introduction
Once your Checkmk server has been set up and configured, sooner or later questions will come up: Can the configuration be performed more quickly? Can it be optimized? Can the system be made more secure?
One approach to answering these questions is to review and consequently optimize the site setup on the Checkmk server. The more performant your system is, the faster and more effectively it works. So the more reliably you can secure your site, the more confident you can be when working with it.
Checkmk quickly and clearly analyzes the essential parameters associated with the current site as well as any attached sites in the case of a distributed monitoring.
The hosts and services within your site(s) are not affected by these checks, they are still shown in the views of hosts and services. The results of the checks for the site covered here are displayed on the Setup > Maintenance > Analyze configuration page.
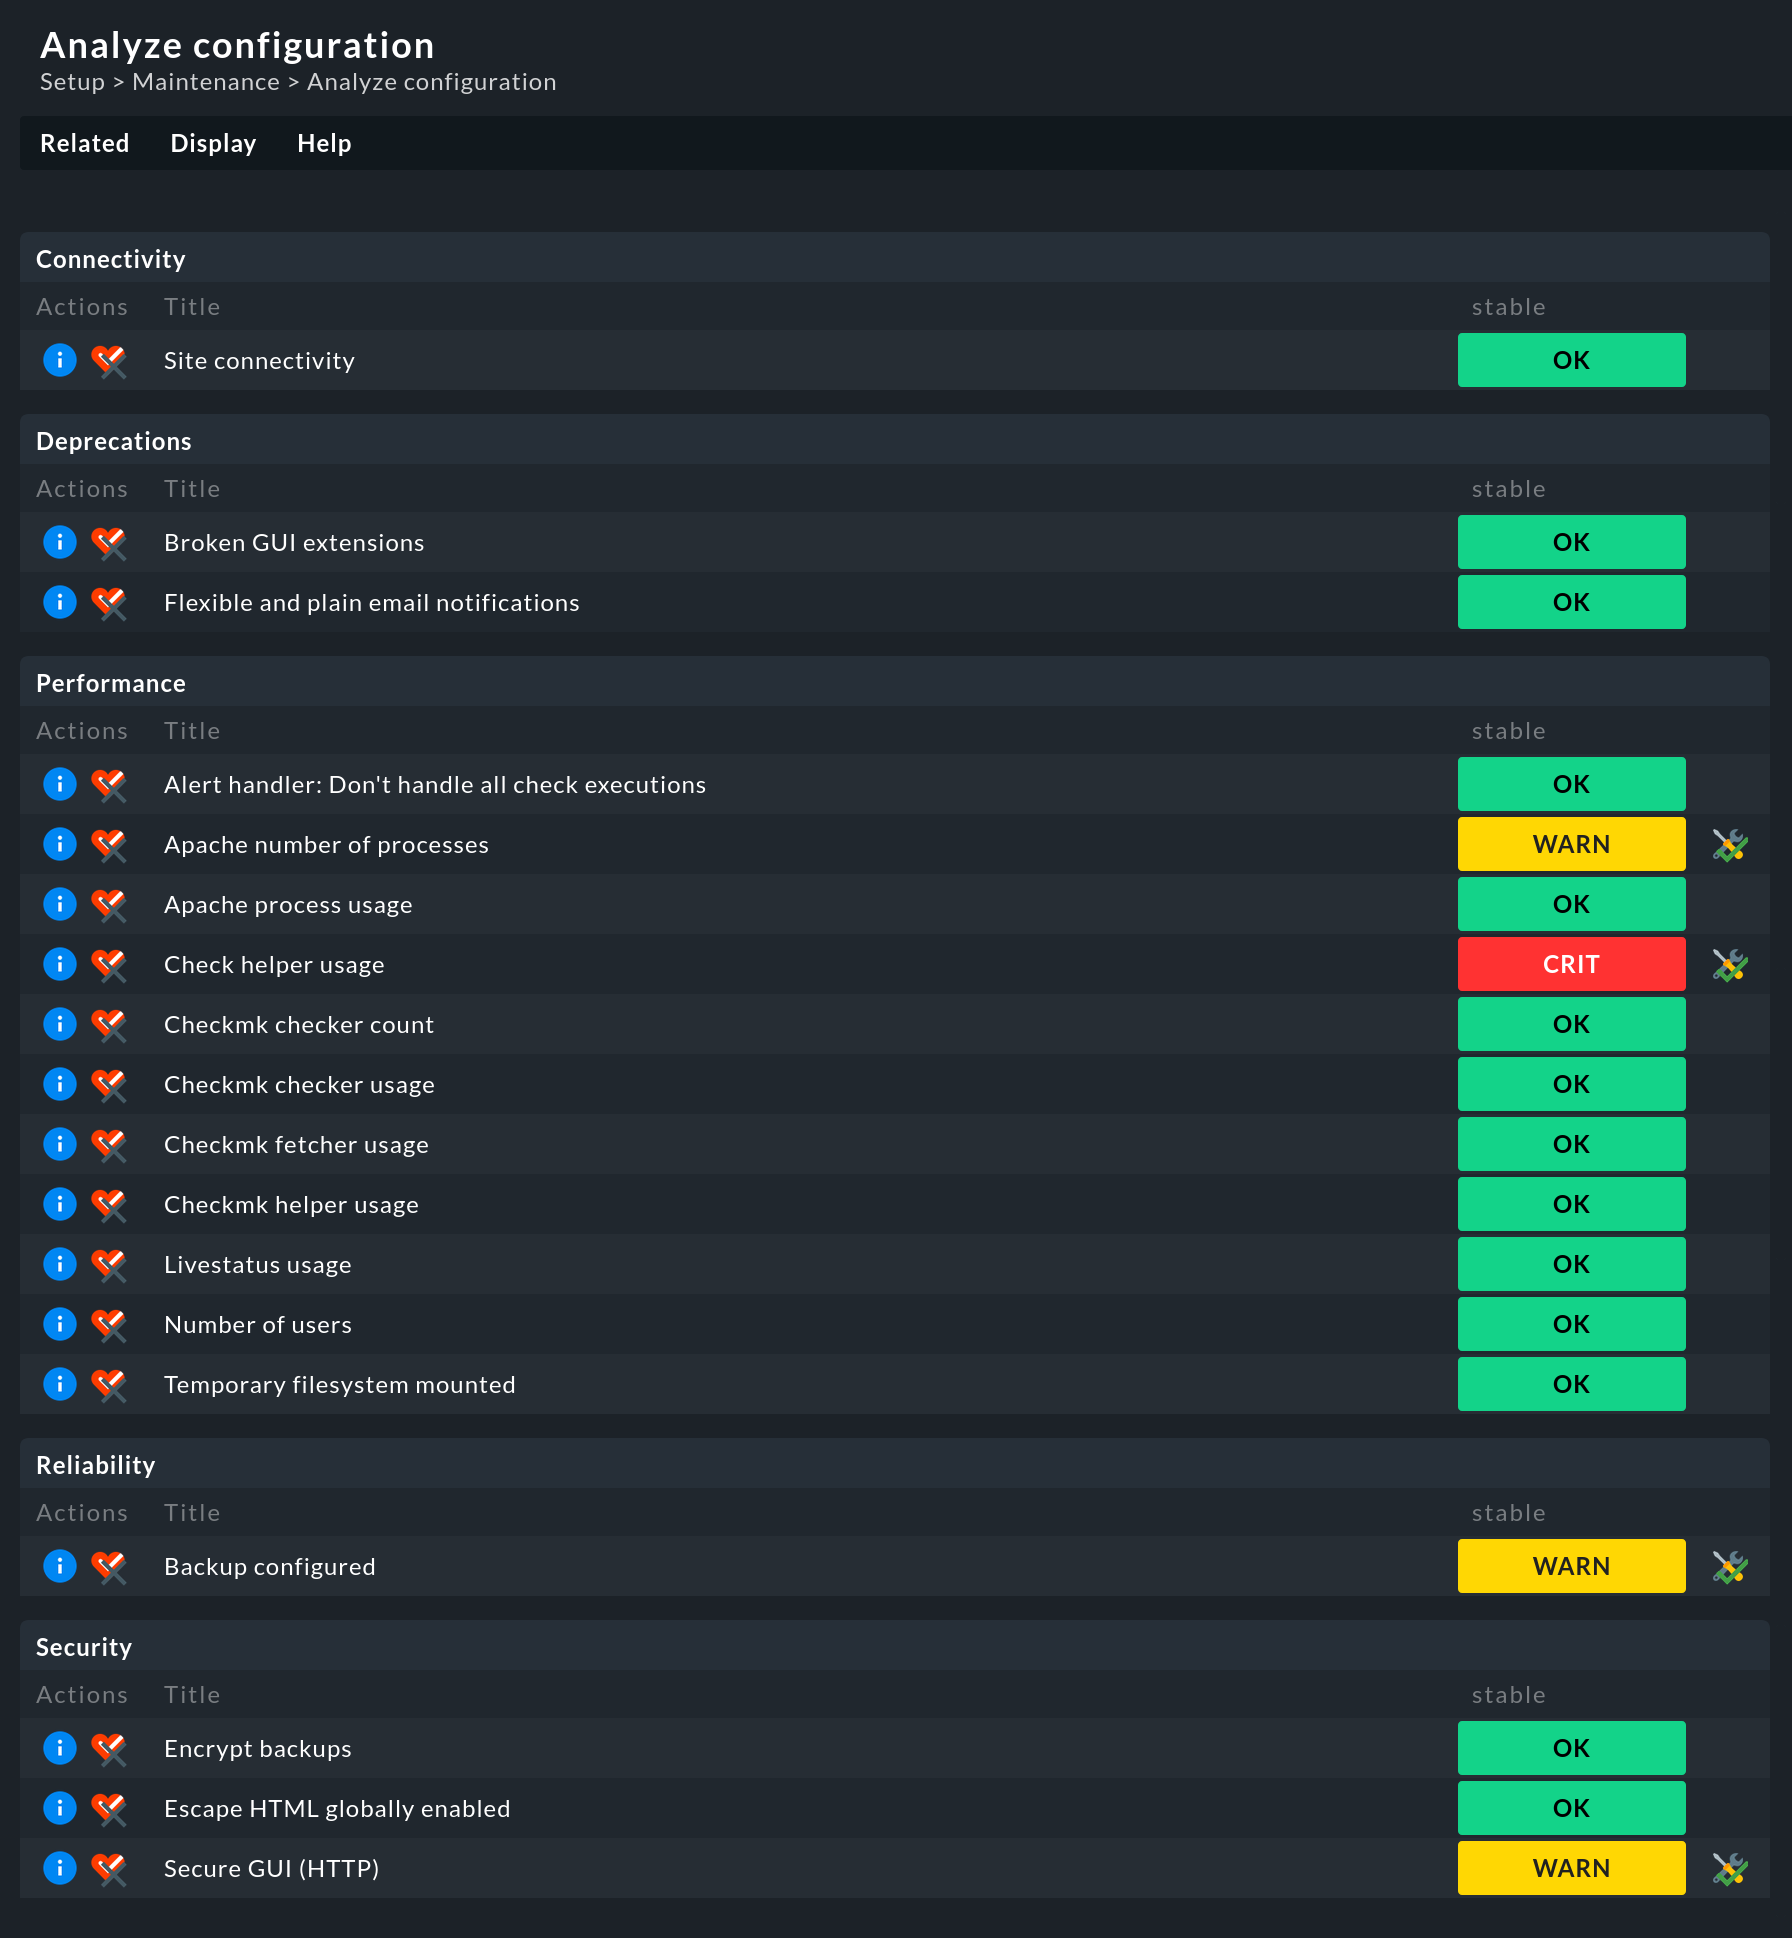
When Analyze configuration is run, the current state of all checks is always assessed and displayed. Therefore, after calling the menu item it may take a little while before the page with the results is displayed: |

The above screenshot shows the checks that are executed by default for a single site in Checkmk Community. However, this is not the whole story, as more checks may well be offered. What these are depends, for example, on whether you have installed Checkmk Community or one of the commercial editions, whether your site is used in a distributed monitoring, whether a specific rule has been set up, an LDAP connection exists, a global setting has been defined — or even the value of an option in a rule. Which check is relevant for your site — Checkmk takes care of that.
2. Interpreting the analysis
The analyzed site data is divided into different categories as checks. Each check has a colored status display. A check can have the following states after analysis:
| State | Color | Description |
|---|---|---|
OK |
green |
The check is completely fine. All checked values are considered optimal. |
WARN |
yellow |
The check is basically fine, but Checkmk has identified potential for improvement. |
CRIT |
red |
The check has detected critical values. These should be examined and fixed if necessary to ensure a smooth operation of Checkmk. |
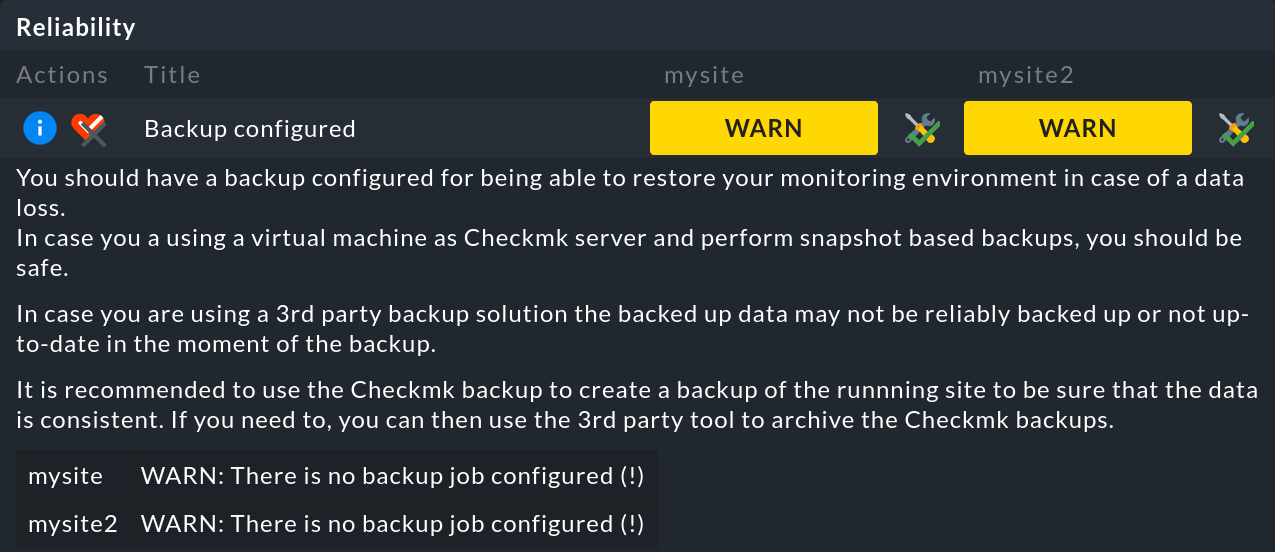
Let’s consider the Backup configured check with two sites in a distributed monitoring:

This check is in a WARN state, so an ![]() button appears after the WARN for acknowledging this.
This button also appears for checks in the CRIT state.
Acknowledgment causes the yellow or red color of the state to disappear.
The entry itself remains, but becomes visually more discreet.
If the check is acknowledged, the button changes to
button appears after the WARN for acknowledging this.
This button also appears for checks in the CRIT state.
Acknowledgment causes the yellow or red color of the state to disappear.
The entry itself remains, but becomes visually more discreet.
If the check is acknowledged, the button changes to ![]() .
This button can be used to cancel the acknowledgment.
.
This button can be used to cancel the acknowledgment.
In general, it makes sense to check the system environment for all parameters.
However, if you do not want to run individual checks (again), you can disable any of the checks by clicking on the associated ![]() button.
For example, turn off the Backup configured check if your organization uses a different solution for backup creation.
button.
For example, turn off the Backup configured check if your organization uses a different solution for backup creation.
3. The checks in detail
For each check, clicking on the associated ![]() button will give you more details on the detected values, an assessment of the status, as well as hints for optimization.
button will give you more details on the detected values, an assessment of the status, as well as hints for optimization.

Much can be readily understood and acted upon based on this. This User Guide — as well as other sources — provides additional information on the following topics:
| Category | Check | Further information |
|---|---|---|
Connectivity |
Site connectivity |
In distributed monitoring, remote sites may not be reachable due to unstable or slow connections. |
Deprecations |
Deprecated HW/SW inventory plug-ins |
In Werk #14084 you will find further details and information on the migration of plug-ins that still use the old API for the HW/SW inventory. |
Deprecated check plug-ins (legacy) |
In the User Guide you will find articles about the developing of extensions for Checkmk and the developing of agent-based check plug-ins with the Check API V2. |
|
Performance |
Check helper usage |
Auxiliary processes for the Checkmk Micro Core (CMC) in the commercial editions. |
Checkmk checker count | ||
Checkmk checker usage | ||
Checkmk fetcher usage | ||
Checkmk helper usage | ||
Livestatus usage |
||
Persistent connections |
Persistent connections between central and remote sites in distributed monitoring. |
|
Number of users |
||
Size of extensions |
In distributed monitoring, the data between central and remote sites may be synchronized slowly because synchronization of extensions such as MKPs is switched on. |
|
Use Livestatus Proxy Daemon |
The Livestatus proxy of the commercial editions for connections between central and remote sites in distributed monitoring. |
|
Reliability |
Backups configured |
|
Security |
Encrypt backups |
|
Encrypt notification daemon communication |
The Werk #13610 explains how to activate the transport encryption of the notification spooler |
|
Livestatus encryption |
Connecting Livestatus with encryption for sites that have Livestatus activated via the network (TCP). |
|
Secure Agent Updater |
Setting up automatic updates in the commercial editions. |
|
Secure GUI (HTTP) |
||
Secure LDAP |
Securing LDAP with SSL for established LDAP connections |
In addition, the article on Security provides an overview of other security-related matters relevant to Checkmk.
