1. Monitoring individual CPU utilization in all cores
Checkmk automatically sets up a service under both Linux and Windows that monitors the average CPU usage over the course of the last minute. On the one hand, this makes sense, but on the other hand it does not recognize some errors, for example, that a single process runs amok and continuously utilizes one CPU at 100 %. In a system with 16 CPUs, however, a CPU only contributes 6.25 % to the overall performance, and so even in the extreme case described, a total utilization of only 6.25 % is recorded — which does not trigger a notification.
For this reason, Checkmk provides the option (for Linux and for Windows) of monitoring all available CPUs individually and determining whether any of their cores is constantly busy over a longer period of time. Setting up this check has turned out to be a good idea.
To set up this check for your Windows servers, you need for the CPU utilization service the CPU utilization for simple devices rule set, which you can find under the Service monitoring rules. This rule set is responsible for monitoring all CPUs — but it also has this option: Levels over an extended time period on a single core CPU utilization.
Create a new rule and activate only this option in it:
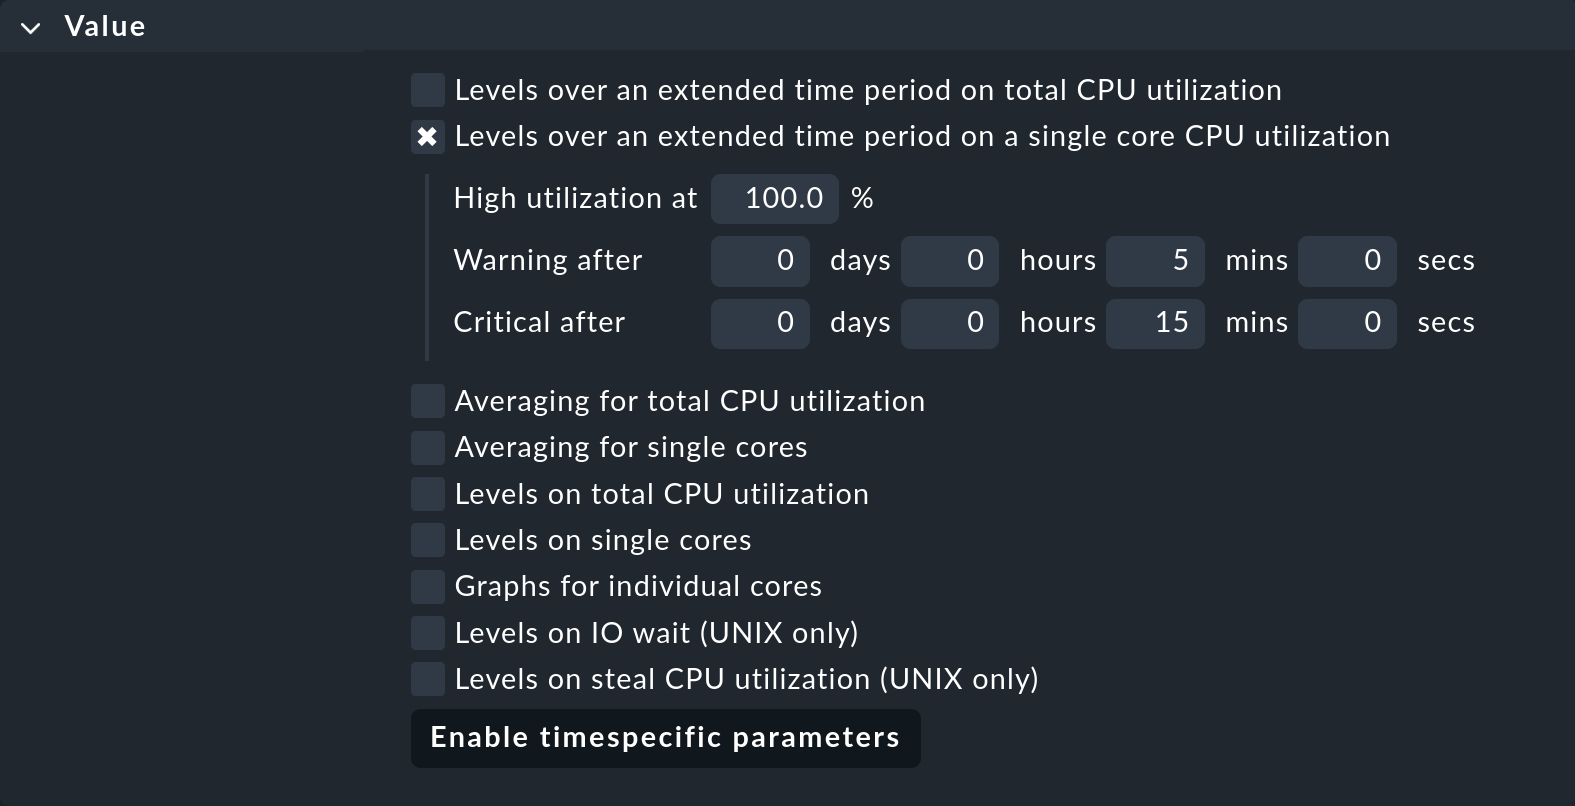
Define the condition so that it only applies to the Windows servers, for instance by using a suitable folder or host tag. This rule will not affect other rules of the same rule set if they set other options, such as the thresholds for the total CPU utilization.
For Linux servers, this is the responsibility of the CPU utilization on Linux/Unix rule set, in which you can set the same option.
2. Monitoring Windows services
By default, Checkmk does not monitor any services on your Windows servers. Why not? This is simply because Checkmk does not know which services are important to you.
If you do not want to go to the trouble of manually determining for each server which services are important, you can also set up a check that simply checks whether all services with the start type "automatic" are in fact running. In addition, you can be informed whether services are running that were started manually — out of order, so to speak. These will no longer run after a reboot — which could be a problem.
To implement this, you first need the Windows Services rule set which you can find under the Service monitoring rules, by using the search function Setup > General > Rule search, for example. The crucial option in the new rule is Services states. Activate this and add three new elements for the states of the services:
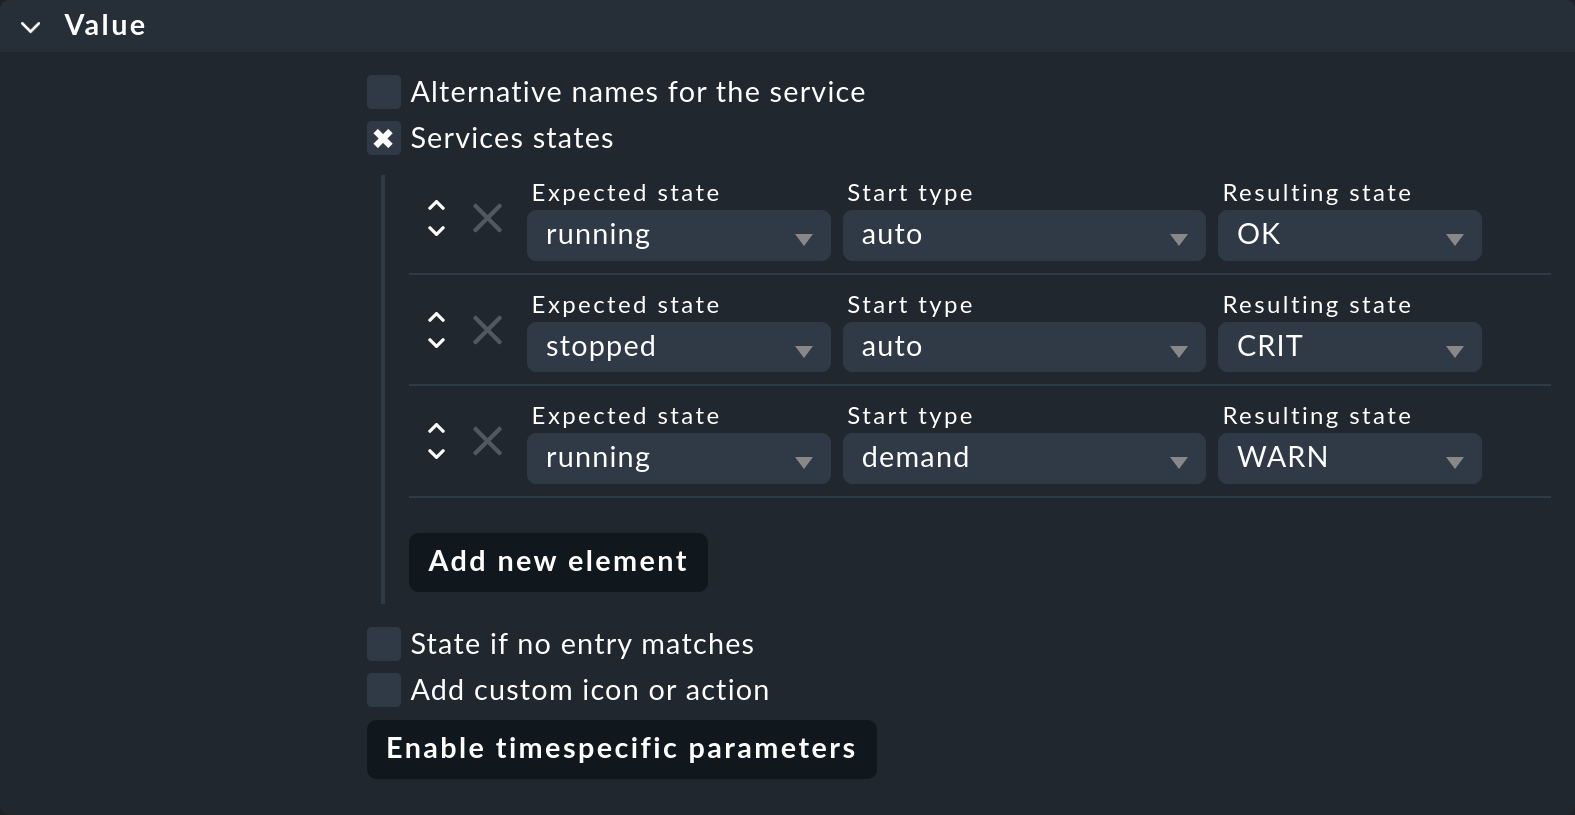
This allows you to implement the following monitoring:
A service with the start type auto, and which is running, is considered to be OK.
A service with the start type auto that is not running is considered to be CRIT.
A service with the start type demand, and which is running is considered to be WARN.
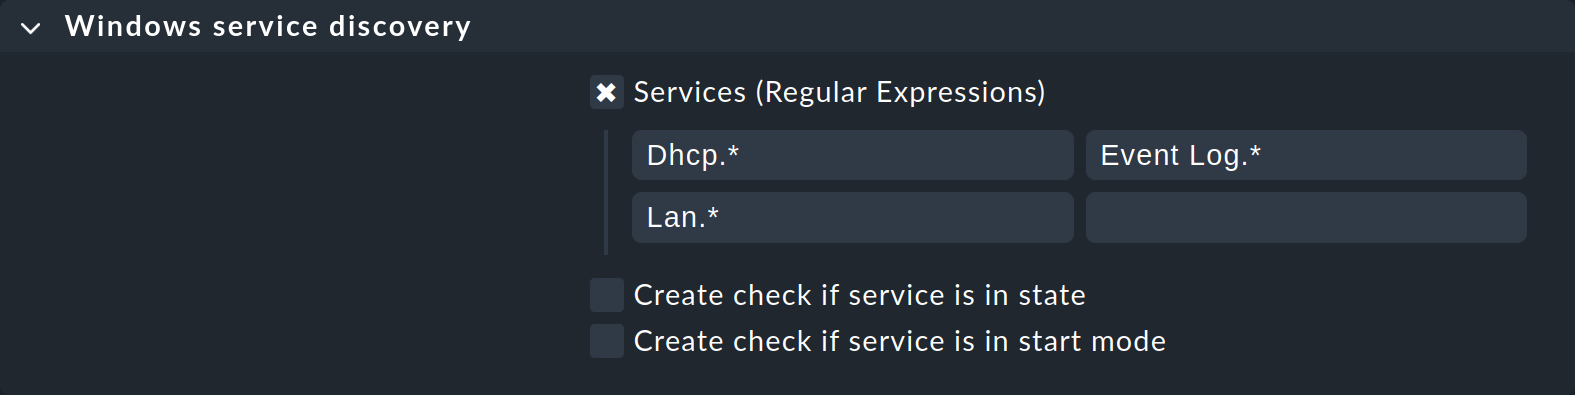
However, this rule only applies to services that are actually being monitored. Therefore, you need a second step and a second rule, this time from the Windows service discovery rule set, with which you define which Windows services Checkmk should monitor as services.
When you create this rule, you can first enter the regular expression .* in the Services (regular expressions) option, which will then be applied to all services.
After saving the rule, switch to the service configuration for a suitable host. There you will find a large number of new services — one for each Windows service.
To limit the number of monitored services to those of interest to you, return to the rule and refine the search terms as needed. This is case-sensitive. Here is an example of a customized service selection:
If you have previously included services that do not match the new search expressions now in the monitoring, they will appear as vanished in the service configuration. With the Rescan button you can clear the air and have the entire service list recreated.
3. Monitoring internet connections
Your organization’s access to the internet is certainly very important to everybody. Monitoring the connection to 'the internet' is a bit difficult to implement, as it involves the billions of computers which could (hopefully) be accessible — or not. Nevertheless, you can still set up an efficient monitoring system, based on the following construction plan:
Select several computers on the internet that should normally be reachable via a
pingcommand and note their IP addresses.Create a new host in Checkmk, for example with the name
internetand configure it as follows: For IPv4 address enter one of the noted IP addresses. Under Additional IPv4 addresses enter the remaining IP addresses. Under Monitoring agents, enable Checkmk agent / API integrations and select No API integrations, no Checkmk agent there. Save the host without service discovery.Create a new rule from the Check hosts with ping (ICMP echo request) rule set that only applies to the new host
internet(for example, via the Explicit hosts condition, or a matching host tag). Configure the rule as follows: Enable Service name and enterInternet connection. Enable Alternate address to ping and select Ping all IPv4 addresses there. Enable Number of positive responses required for OK state and enter1.Create another rule that also only applies to the host
internet, this time from the Host check command rule set. There, select as Host check command the Use the status of the service… option and enterInternet connectionas its name - the same name you chose as the service name in the previous step.
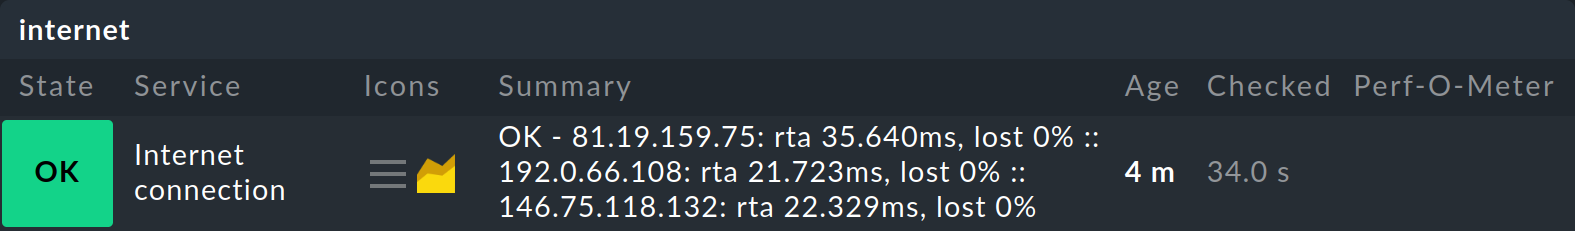
If you now activate the changes, you will get the new host internet with the single service Internet connection in the monitoring.
If at least one of the ping destinations is reachable, the host will have the state UP and the service will have the state OK. At the same time, the service provides you with performance data for the average packet round trip time (round trip average) and packet loss for each of the specified IP addresses. This will give you an indication of the quality of your connection over time:
The default behavior of Checkmk is, that a host changes its state to DOWN if the first IP address cannot be reached by ping. The fourth and final step in the procedure shown above overrides this default behavior by mapping the state of its only service to the state of the host. Since Checkmk basically does not notify for services when a host is DOWN, it is important that you control the notifications via its host — and not via the service. As well, in this particular case, you should use a notification method that does not require an internet connection. |
4. Monitoring HTTP/HTTPS services
Let’s say you want to check the accessibility of a website or web service. The Checkmk agent does not offer a solution here, as it does not display this information. Additionally, you may not even have the possibility of installing an agent on the server.
The solution is a so-called active check. This is one that is not performed by an agent, rather by directly contacting a network protocol at the target host — in this case HTTP(S).
The procedure is as follows:
Create a new host for the web server, e.g. for
checkmk.com. Under Monitoring agents, activate the Checkmk agent / API integrations option and select No API integrations, no Checkmk agent. Save the host without a service discovery.Create a new rule from the Check HTTP web service rule set, which only applies to the new host (e.g. via the condition Explicit hosts).
In the Value box you will find numerous options for performing the check. The principle is as follows: Define a new endpoint for each URL to be checked. A service is created for each endpoint. Next, define the service name (e.g.
Basic webserver health) and, if necessary, a prefix (HTTPorHTTPS) for the endpoint.-
You can also make additional settings in the Value box below the endpoints. For example, you can use Response time to set the service to WARN or CRIT if the response time is too slow and use Certificate validity to check the certificate’s validity period. With Search for strings you can check whether a certain text appears in the response — i.e. in the delivered page. This allows you to check a relevant part of the content so that a simple error message from the server is not interpreted as a positive response.
You can define these settings identically for all endpoints or individually for each endpoint.

You can find very useful information on all available options in the inline help.
Save the rule and activate the changes.
You will now have a new host with the services you specified that check access via HTTP(S):
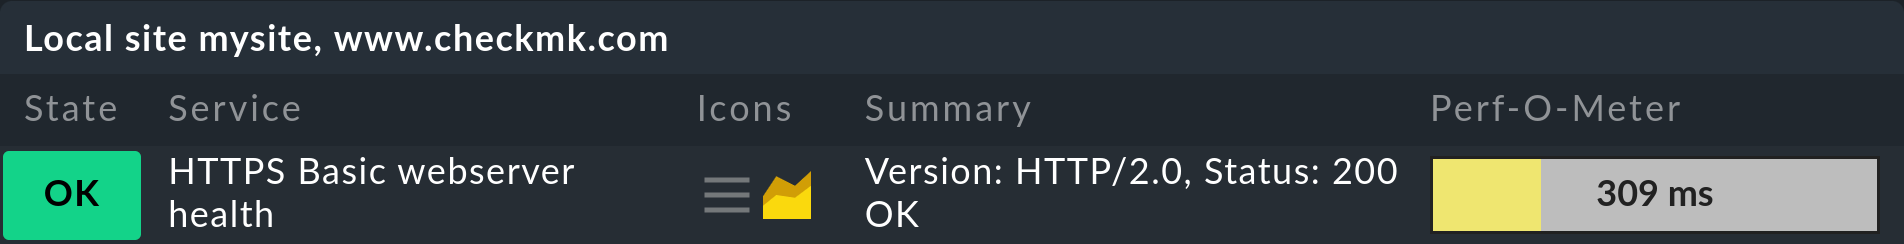
You can of course also perform this check on a host that is already being monitored with Checkmk via an agent. In this case, there is no need to create the host and you will only need to create the rule for the host. |
5. Customizing file system thresholds 'magically'
Finding good thresholds for monitoring file systems can be tedious. After all, a threshold of 90 % is much too low for a very large hard disk and is perhaps already too marginal for a small one. We have already introduced the facility for setting thresholds depending on a files system’s size in the chapter on fine-tuning the monitoring — and hinted then that Checkmk has another, even cleverer option on offer — the magic factor.
You set up the magic factor like this:
In the File systems (used space and growth) rule set, you create just a single rule.
In this rule, enable Levels for used/free space and leave the default for the thresholds at 80 %, or 90 % unchanged.
In addition, activate Magic factor (automatic level adaptation for large filesystems) and confirm the 0.8 default value.
Also set Reference size for magic factor to 20 GB. Since 20 GB is the default value, it will take effect even without you explicitly activating the option.
The result will look like this:

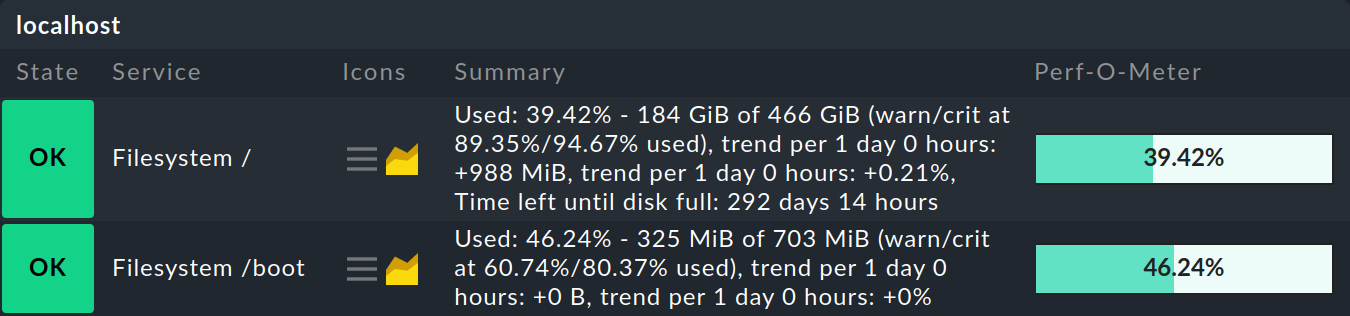
If you now save this rule and activate the change, you will have threshold values that vary automatically depending on the size of the file system:
File systems that are exactly 20 GB in size are given the thresholds 80 % / 90 %.
File systems smaller than 20 GB are given lower thresholds.
File systems larger than 20 GB are given higher thresholds.
Exactly how high the threshold values are is, well — magical! The factor (here 0.8) determines how much the values are adjusted. A factor of 1.0 changes nothing, and all file systems get the same values. Smaller values have a greater effect on the adjustment of the values. The default values for Checkmk used in this section have proven themselves in practice with very many installations.
You can see exactly which thresholds apply for each service in its Summary:
The following table shows some examples of the effect of the magic factor with a reference value of 20 GB / 80 %:
| Magic factor | 5 GB | 10 GB | 20 GB | 50 GB | 100 GB | 300 GB | 800 GB |
|---|---|---|---|---|---|---|---|
1.0 |
80 % |
80 % |
80 % |
80 % |
80 % |
80 % |
80 % |
0.9 |
77 % |
79 % |
80 % |
82 % |
83 % |
85 % |
86 % |
0.8 |
74 % |
77 % |
80 % |
83 % |
86 % |
88 % |
90 % |
0.7 |
70 % |
75 % |
80 % |
85 % |
88 % |
91 % |
93 % |
0.6 |
65 % |
74 % |
80 % |
86 % |
89 % |
93 % |
95 % |
0.5 |
60 % |
72 % |
80 % |
87 % |
91 % |
95 % |
97 % |
With this chapter on the magic factor, we conclude our Beginner’s Guide.
If you want to take a break now, you can log out. In the Checkmk navigation bar you will find the entry Logout in the User menu. |
We hope that you have been able to set up a solid foundation for your Checkmk system, either with or without involving magic. For nearly all the topics we have covered in this Beginner’s guide, you will find more in-depth information in other articles in the User Guide.
We wish you every success with Checkmk in the future!