1. Synthetic monitoring with Robot Framework
Checkmk Synthetic Monitoring is available in the commercial Checkmk editions, but it requires an additional subscription.
You can however test the function with up to three tests free of charge and without a time limit.
With Checkmk you can monitor your own infrastructure very closely — right down to the question of whether a particular service, such as a web server, is running properly. If your website is operated via a third-party cloud service, you will not have access to the service itself, but you can use an HTTP check to verify whether the website is accessible. But will that say anything about the user experience? The fact that an online store is accessible does not mean that navigation, ordering processes and the like work smoothly.
This is where Checkmk Synthetic Monitoring comes in. With the Robotmk plug-in, Checkmk offers genuine end-to-end monitoring, i.e. the monitoring of running applications from the user’s perspective. The actual testing is carried out by the open-source software Robot Framework — of which Checkmk GmbH is also a member.
The automation software can be used to fully replicate a user’s behavior, for example to simulate order processes in online stores, 'click-by-click'.
The special thing about Robot Framework is that tests are not written in a fully-fledged programming language, but are defined using easy-to-use keywords such as Open Browser or Click Button.
An Open Browser checkmk.com is sufficient to call up the Checkmk website.
Several test cases are then combined in so-called test suites (in the form of a .robot file).
Robotmk can now deploy these Robot Framework test suites on the host and monitor their execution and results as services in Checkmk. In the Checkmk web interface you will then find the status, associated performance graphs and the original evaluations of Robot Framework itself.
1.1. Components
Multiple components work together to create this end-to-end monitoring, so here is a brief overview.
Checkmk server
Checkmk Synthetic monitoring is realized via Robotmk, which uses an agent plug-in as a data collector, and the Robotmk scheduler (on the monitored host) for triggering Robot Framework projects. Synthetic monitoring is activated and configured via the Robotmk Scheduler rule. Here you specify which test suites should be executed and how exactly Robot Framework should start them — summarized in a plan. Once deployed, the Robotmk scheduler on the target host ensures the scheduled execution of your Robot Framework suites.
In the monitoring, a number of new services will be generated: RMK Scheduler Status shows the status of the scheduler itself, i.e. whether test suites could be started successfully. There are also services for all configured test plans (such as RMK MyApp1 Plan) and individual tests from test suites (such as RMK MyApp1 Test). The services of the individual tests also include the original Robot Framework reports.
Then there are two optional service rules: Robotmk plan and Robotmk test provide for fine-tuning the plan and test services — for example, to effect status changes at certain runtimes.
Last but not least, there are two rules for KPI monitoring: KPI stands for Key Performance Indicator and in this context means individual keywords. Using the Robotmk KPI discovery rule, keywords can be brought into the monitoring as separate services and evaluated accordingly via Robotmk KPI monitoring. We will show you exactly how keyword monitoring works in a separate chapter below.
Somewhat apart from the normal rules, there is also the Managed robots feature in the Setup area. The short version: Robots that are managed on the Checkmk server and deployed via the Checkmk agent — again, a separate chapter is available for more details on this.
Test machine
You can provide the Robot Framework test suites on a Windows (from Windows 10 or Server 2019) or Linux host. For execution, Robot Framework requires access to their dependencies (Python, libraries, drivers for browser automation and so on). This configuration is independent of Checkmk and can be stored declaratively in a portable package. This is performed with the open-source command line tool RCC. This tool uses your configuration files in YAML format to build virtual Python environments including dependencies and the Robot Framework itself. The Robotmk scheduler running as a background process triggers this build and then executes the tests itself.
Such an RCC automation package with the package configuration (robot.yaml), the definition of the execution environment (conda.yaml) and the test suites (tests.robot) is also called robot.
RCC and the scheduler are deployed with the Checkmk agent, the automation package must be available on the host.
The great advantage of RCC is that the executing test host itself does not require a configured Python environment.
The agent itself is only required for the transfer of results, logs and screenshots. This also enables the monitoring of very long-running or locally very resource-intensive suites — provided that your test host has the corresponding capacities.
A word about the operating systems used by the test hosts — Windows and Linux systems behave slightly differently. Note in particular that the defined file paths differ; in the following examples we only use Windows file paths (unless explicit paths are really required). In the event that RCC has to work offline, there are also differences with regard to the user context of the Robotmk scheduler and the necessary commands — here, of course, we explicitly address both systems.
And even if it is not directly related to Checkmk: The browser library of Robot Framework uses Playwright — and Playwright does not run on all Linux systems supported by Checkmk. Note the corresponding system requirements (whereas Node.js is provided by RCC in our case).
System requirements for the test machine:
CPU: at least 4 cores, 8 cores recommended
RAM: 8 gigabytes, 16 gigabytes recommended
Internet access (if packages are to be downloaded)
For web-based tests (Robot Framework browser library, based on Playwright) Debian 12/13, Ubuntu 22.04/24.04
2. Monitoring test suites with Robotmk
In the following, we will show you how to include a test suite in the monitoring. As an example we will use a simple Hello World suite which only outputs two strings and which waits briefly between each. An introduction to Robot Framework is of course not the subject of this article, but a brief look at the automation package and the demo test suite is necessary so that you can see which data ends up where in the monitoring.
The example runs on the basis of RCC, so that the Windows host does not have to be configured separately.
The rcc.exe is deployed with the agent and can be found under C:\ProgramData\checkmk\agent\bin\.
You can download the sample suite as a ZIP file via GitHub.
The directory of the suite:
conda.yaml
robot.yaml
tests.robot
RCC can also process test suites based on a number of other programming languages, but for use in Checkmk it must be the Robot Framework declaration. |
The suite directory now contains two important files:
The declaration of the environment required for execution in the file conda.yaml and the actual tests in the file tests.robot (the suite).
The robot.yaml file is not relevant for use in Checkmk, but is required by RCC.
For the sake of completeness, here is a brief look into robot.yaml file:
At first, tasks defines which tasks, here tests, are to be executed at all.
However, although this part is formally required by RCC, it is not used by Robotmk.
Robot Framework distinguishes between tests and tasks, which stand for automations. However, both are used in exactly the same way. |
In the environmentConfigs area, only the conda.yaml is referenced, which takes care about the actual environment.
In this case, only the Python, Pip and Robot Framework dependencies are installed for the environment. The environment build later appears in the monitoring as RCC environment build status. The tests can only be processed and consequently monitored if the environment has been built successfully.
The actual test suite now looks like this:
*** Settings ***
Documentation Template robot main suite.

*** Variables ***
${MYVAR}    Hello Checkmk!

*** Test Cases ***
My Test
    Log ${MYVAR}
    Sleep 3
    Log Done.
Here, only the value of the MYVAR variable is output, then following a 3 second wait, Done will be output.
You can set the value of the variable later in the Checkmk web interface — otherwise the default value Hello Checkmk! specified here will be used.
You can run this test suite manually.
To do this, the agent and RCC must already be installed (or you can download the RCC binary yourself).
First navigate to your test suite directory, where the |
And this is exactly what the Robotmk scheduler does as soon as the agent plug-in has been activated.
2.1. Configure a rule for the agent plug-in
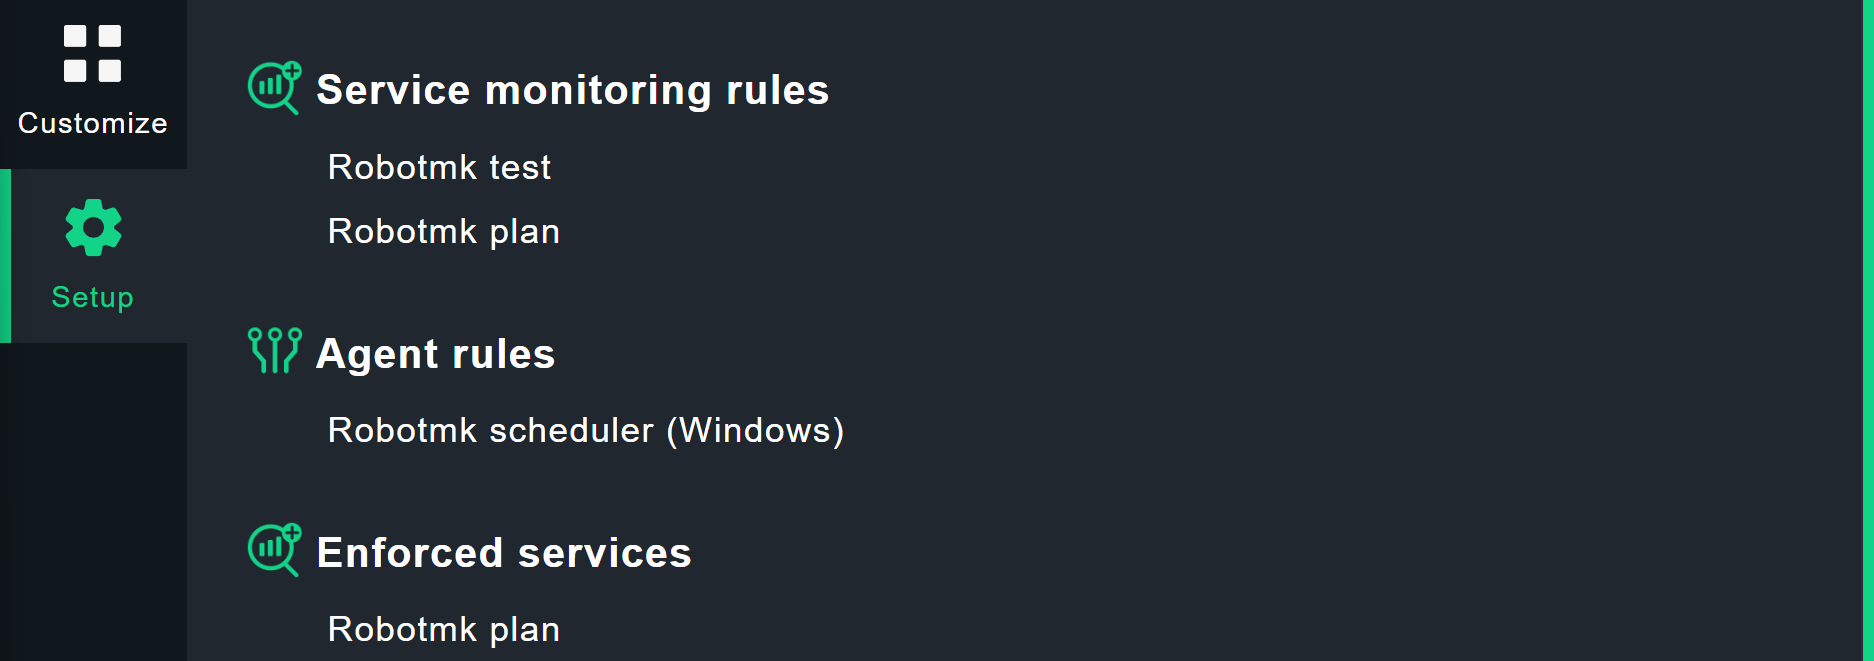
You can find the Robotmk scheduler under Setup > Agent rules > Robotmk scheduler (Windows). As the rule is quite extensive, here is a look at the empty configuration:
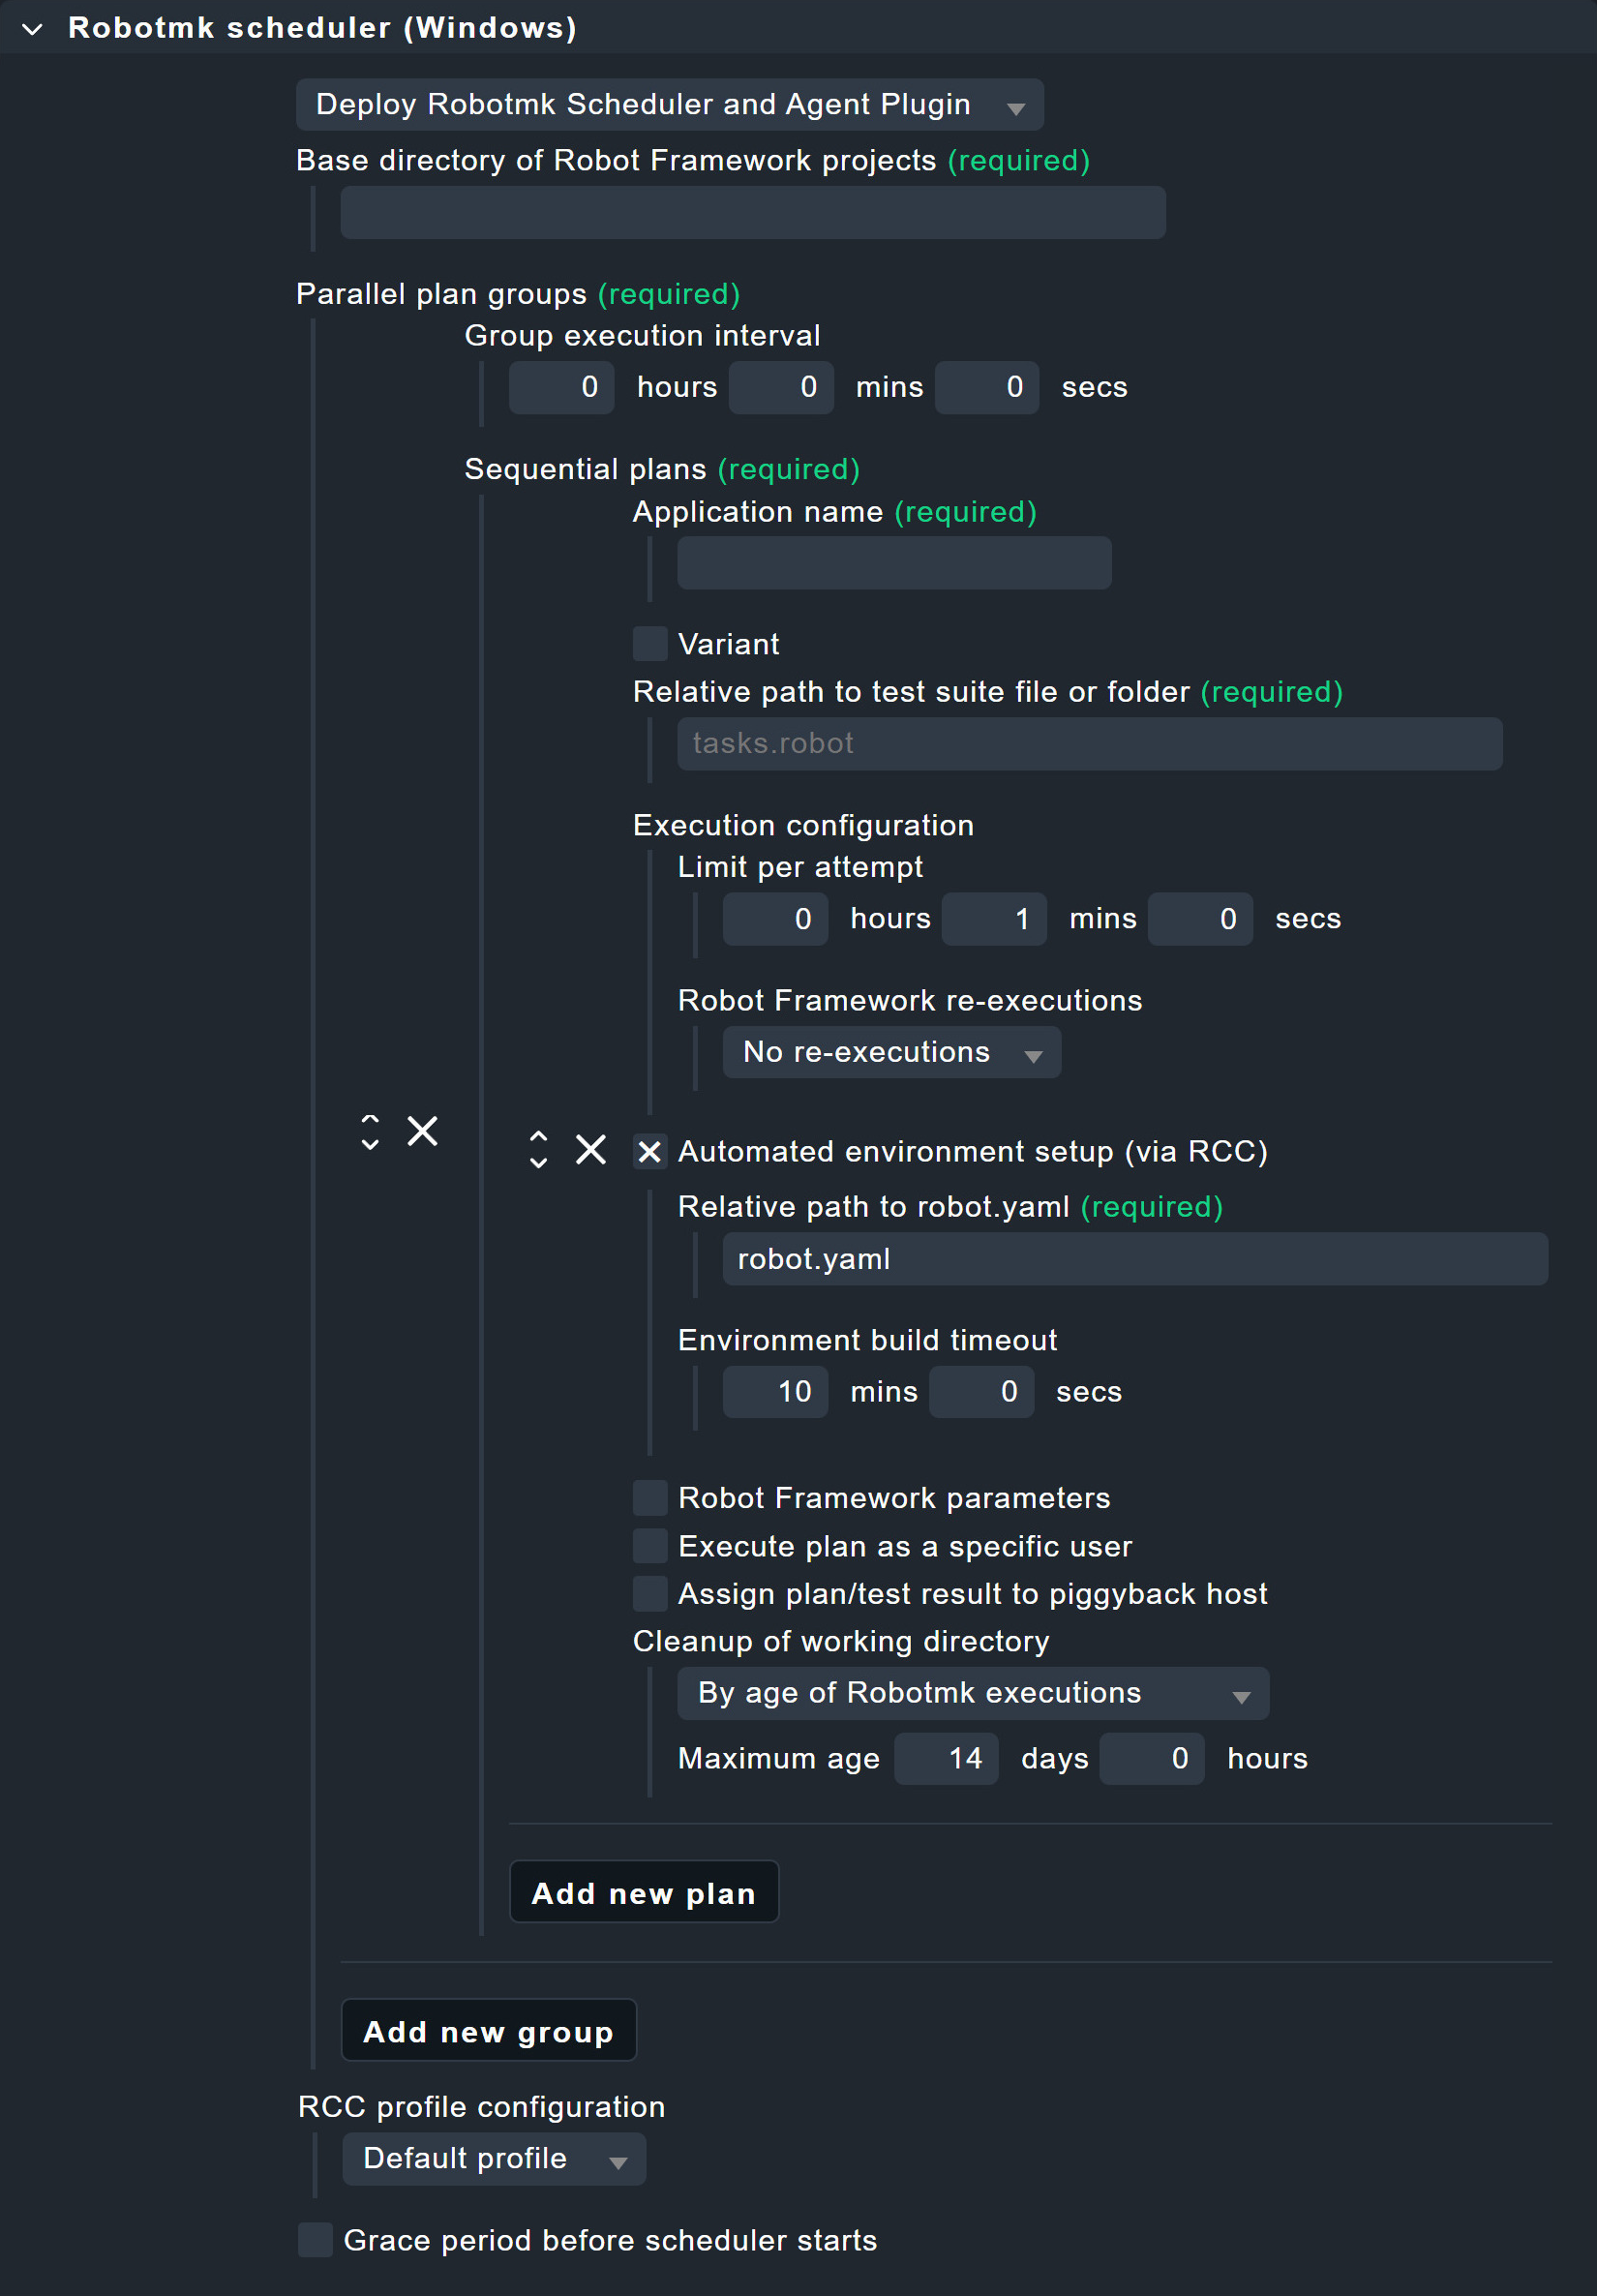
First, the scheduler requires the base directory in which all your test suites are located.
Enter this arbitrary, explicit file path under Base directory of suites, for example C:\robots.

The Parallel plan groups that are shown now are a Checkmk-specific concept.
To explain this, we must first go down one hierarchy level: Here you can see the item Sequential plans. Such a sequential plan defines which suites are to be executed with which parameters. Robot Framework will process these suites one after the other. The reason for this is simple: in practice, tests are sometimes run on the desktop and several test suites could get in each other’s way at the same time (think of them stealing each other’s control of the mouse cursor).
The plan groups are now an encapsulation for sequentially executed plans — and are themselves executed in parallel. Again, the reasoning is simple: this allows test suites that do not rely on the desktop to be executed in their own plans without delay — the test suite used in this article is a good example of such processing.
Back to the dialog: The only explicit setting is the execution interval, which you set under Group execution interval.

The plans in the plan group naturally have their own runtimes, determined by the timeout of a single execution and the maximum number of repeated executions in the event of failed tests. The execution interval of the plan group must therefore be greater than the sum of the maximum runtimes of all plans in the group. The maximum runtime of a plan is calculated as follows: Limit per attempt × (1 + Maximum number of re-executions). |
Now it’s time to configure the first plan.
You can enter any name under Application name.
This name does not have to be unique!
The name of the application to be monitored makes sense here, for example OnlineShop, or here in this example simply MyApplication.
Of course, it can happen that this online store is tested several times, either by other test suites or by the same test suite with different parameters.
In such cases, the Variant field is used to achieve unambiguous results despite identical names.
For example, if the application OnlineShop is tested once in German and once in English (via corresponding parameters), you could use corresponding abbreviations here.
The monitoring will then return results for My OnlineShop_en and My OnlineShop_de.
However, the specification under Relative path to test suite file or folder is necessary.
The path is relative to the base directory specified above, e.g. mybot\test.robot for C:\robots\.
Alternatively, a directory (with several robot files) can also be specified here, in which case it would simply be mybot.

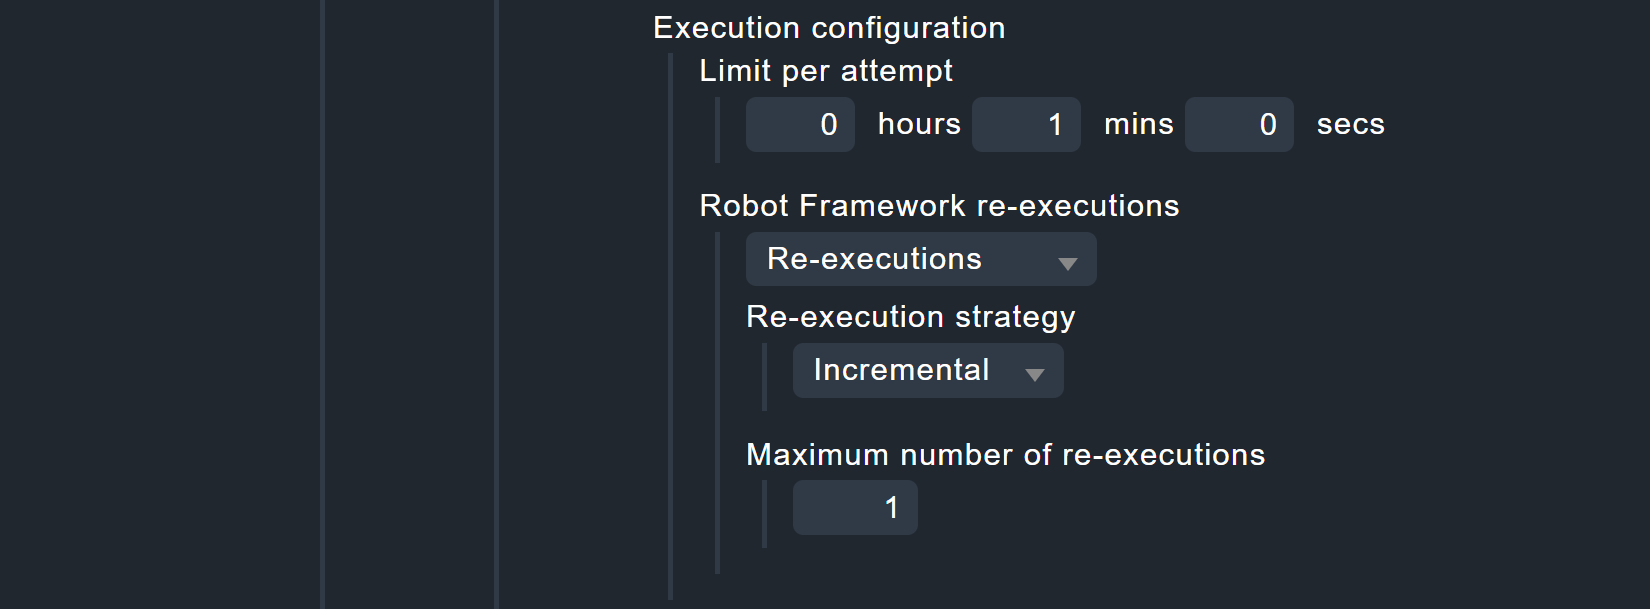
Continue with the Execution configuration. Under Limit per attempt you define the maximum elapsed time — per attempt — that a test suite may run. With Robot Framework re-executions you can now instruct Robot Framework to repeat test suites completely or incrementally if tests fail. If the individual tests in a test suite are independent of each other, the incremental strategy is the best way to save time. If, on the other hand, the test suite tests a logical sequence, such as "Login > Call up product page > Product in shopping cart > Checkout", the test suite must of course be completely reprocessed. In the end, there is always only one result.
In the case of complete retries, only the results from self-contained suites are taken into account for the final result: If a test fails on its final retry, the test suite is counted as a failure. In the case of incremental retries, the final result is made up of the best partial results: If some tests only run successfully on the third attempt, the final result is also counted as a success. Reminder: The combination of attempts and maximum run times of all plans in a plan group determines their minimum execution interval.
By default, execution via RCC is activated under Automated environment setup (via RCC), for which you must enter two values.
Firstly, RCC requires the specification of where the robot.yaml file is located.
Its primary purpose is to reference the conda.yaml file, which is responsible for setting up the Python environment, i.e. installing Python and dependencies.
This specification is relative to the base directory that you have set above under Relative path to test suite file or folder.
The YAML files can be saved in subdirectories, but best practice is the top suite directory.
For the above base directory C:\robot\ and the suite directory C:\robot\mybot it is accordingly mybot\robot.yaml.
With the following time limit for building the Python environment, you should bear in mind that sometimes large volumes of data need to be downloaded and set up.
Especially for the required browsers, several hundred megabytes are quickly accumulated — but only for the first run.
RCC only rebuilds environments if the content of conda.yaml has changed.

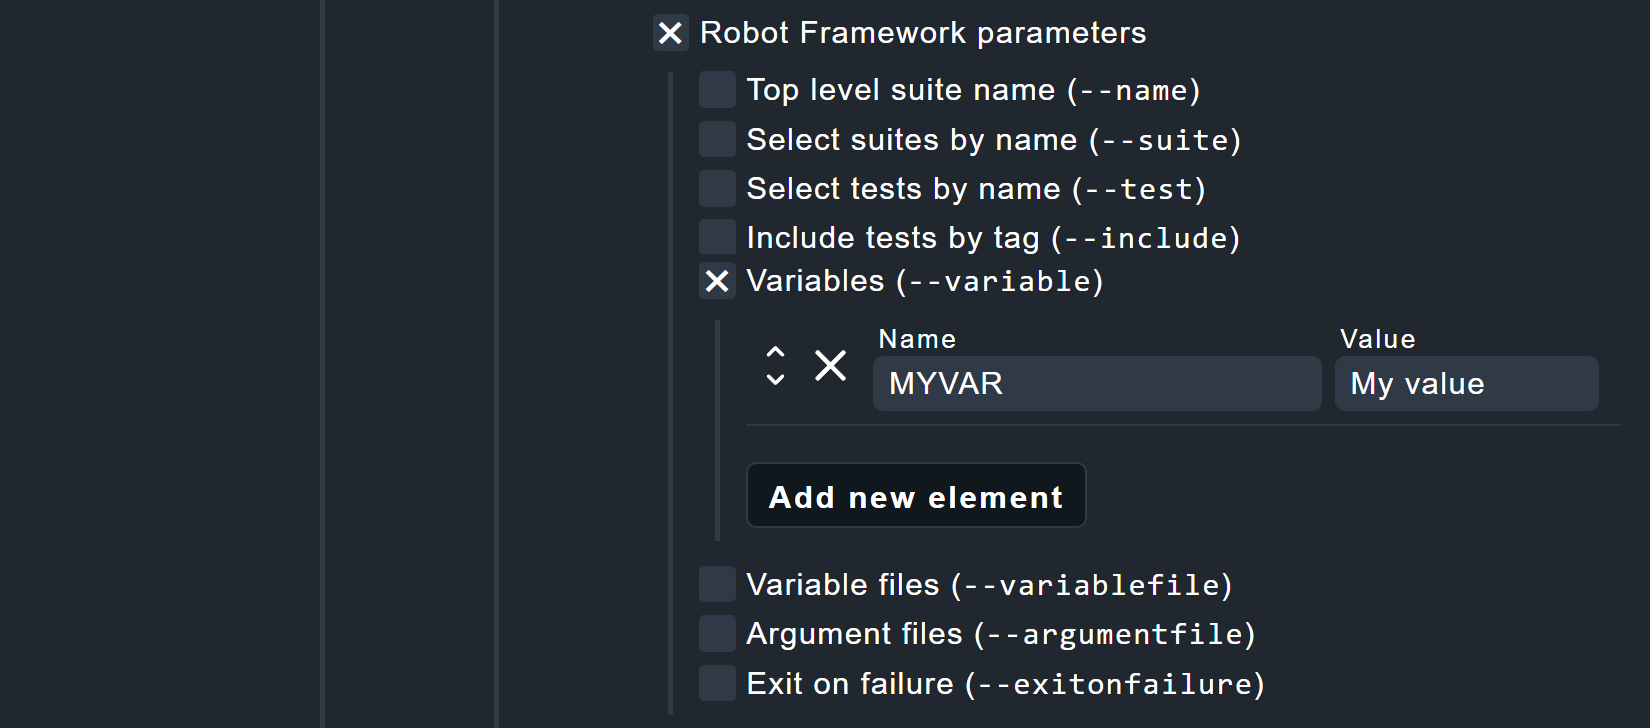
Under Robot Framework parameters you have the possibility to use some of the command line parameters of Robot Framework (which are also displayed by the command robot --help).
If you want to use additional parameters, the option Argument files will help.
A file specified here can contain any robot parameters.
Further information about the individual parameters can be found in the inline help.
For our example project, only the option Variables is activated and a variable MYVAR with the value My Value is set.
Remember the command Log ${MYVAR} at the top of the file tests.robot?
This is the corresponding reference.
robot commandThe Secret environment variables option deserves special attention as it is not an original Robot Framework function.
You can set secret environment variables here, intended for passwords in conjunction with the CryptoLibrary Robot Framework library.
The variables set here do not appear in logs, but are written in plain text to the Checkmk configuration files on the respective test hosts.

At the end of the suite configuration, there are three largely self-explanatory options.
Execute plan as a specific user allows Robotmk to be executed in the context of a specific user account. Background: By default, Robotmk is executed in the context of the Checkmk agent (LocalSystem account), which has no authorization to access the desktop. Here a user can be specified who must be permanently logged in to a desktop session and who has access to graphical desktop applications accordingly.
However, do not be too hasty: browsers are an exception here! They can run and render web pages in headless mode. You should only check the box for a specific user if a dedicated desktop application is launched outside of browsers — not least for security reasons.
With Assign plan/test result to piggyback host the results of the plan/test can be assigned to another host. For example, if Robot Framework is testing the ordering process of an online store, the results can be assigned to the corresponding web server.
Each test run produces data that is stored under C:\ProgramData\checkmk\agent\robotmk_output\working\suites\.
By default, results from the last 14 days are retained, but you should bear in mind that large volumes of data can quickly accumulate here.
At least 500 kilobytes of data are generated per run — with more complex test suites and embedded screenshots, for example, this can quickly add up to several megabytes of data.
Depending on the execution interval, the size of the report and your documentation requirements, you should intervene in such a situation.
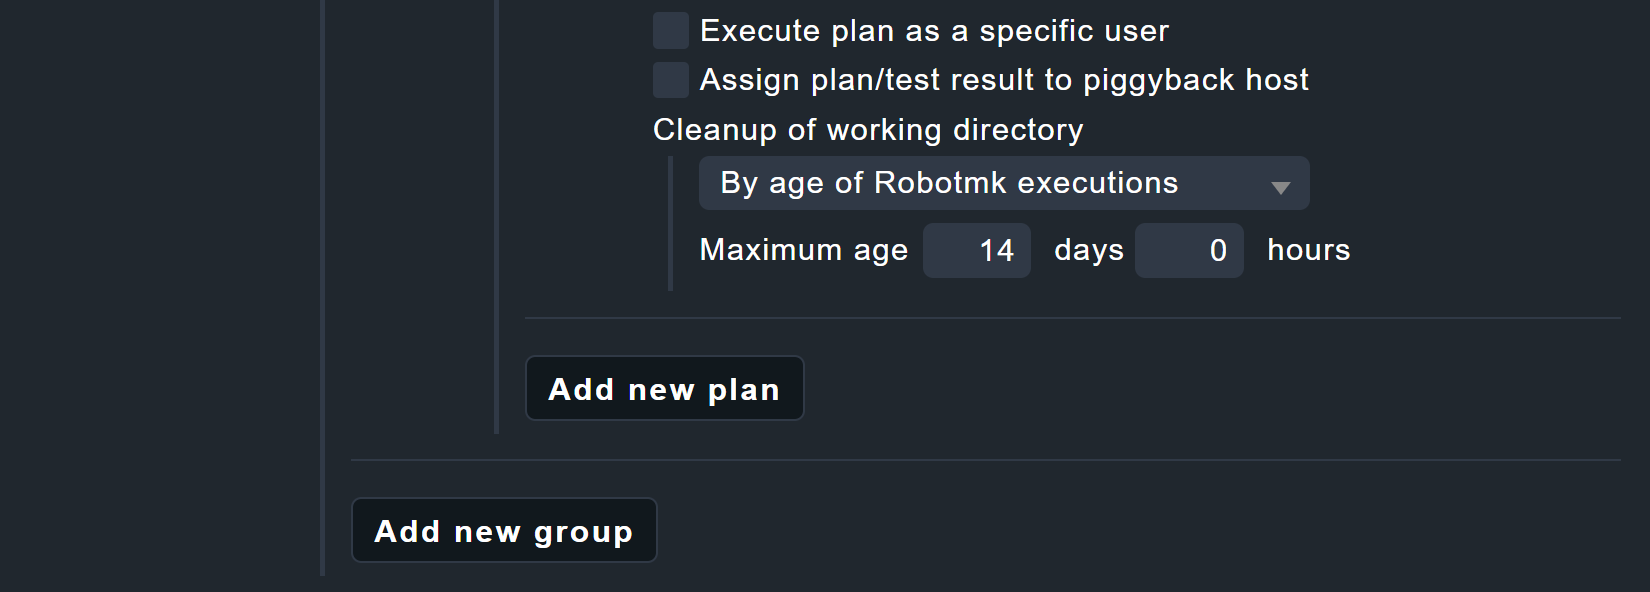
Once here, you can now create further plans in this plan group or further plan groups.
At the end there are two more options, which in turn relate to the complete Robotmk scheduler configuration.
RCC profile configuration allows you to specify proxy servers and hosts to be excluded.
Grace period before scheduler starts can also be very useful: The scheduler starts together with the Checkmk agent before the desktop logon — which, of course, means that any tests on the desktop must fail. The start can be manually delayed using a grace period.

This completes the configuration and you can bake a new agent with the plug-in, and then deploy, manually or via the automatic agent updates.
Data in the agent output
The output in the agent is quite extensive:
error messages, status, configuration and test data are transmitted in several sections.
The latter can be found in the robotmk_suite_execution_report section, here is an abbreviated excerpt:
<<<robotmk_suite_execution_report:sep(0)>>>
{
    "attempts": [
        {
            "index": 1,
            "outcome": "AllTestsPassed",
            "runtime": 20
        }
    ],
    "rebot": {
        "Ok": {
            "xml": "<?xml version=\"1.0\" encoding=\"UTF-8\"?>\r\n
			<robot generator=\"Rebot 6.1.1 (Python 3.10.12 on win32)\"
			generated=\"20240319 16:23:19.944\"
			rpa=\"true\"
			schemaversion=\"4\">\r\n<suite id=\"s1\"
			name=\"Mybot\"
			source=\"C:\\robots\\mybot\">\r\n<suite id=\"s1-s1\"
			name=\"Tests\"
			source=\"C:\\robots\\mybot\\tests.robot\">\r\n<test id=\"s1-s1-t1\"
			name=\"Mytest\"
			line=\"6\">\r\n<kw
			name=\"Sleep\"
			library=\"BuiltIn\">\r\n<arg>3 Seconds</arg>\r\n<doc>Pauses the test executed for the given time.</doc>\r\n<msg
			timestamp=\"20240319 16:23:02.936\"
			level=\"INFO\">Slept 3 seconds</msg>\r\n<status
			status=\"PASS\"
			starttime=\"20240319 16:23:00.934\"
			endtime=\"20240319 16:23:02.936\"/>"
        }
    },
    "suite_id": "mybot",
    "timestamp": 1710861778
}
...
"html_base64":"PCFET0NUWVBFIGh0bWw+DQo8aHRtbCBsYW ...
Two areas are of particular interest here.
Firstly, rebot: The rebot tool has produced the actual status report for Robot Framework from several partial results (hence re-bot).
Secondly, the last line html_base64: The HTML reports from Robot Framework are then base64-encoded.
Screenshots taken via tests are also transferred in this way — the output/data volume in the agent can be correspondingly extensive.
Data in monitoring
As soon as the Robotmk scheduler and the test suite have been run, the service discovery will produce three new services:

The service RMK Scheduler Status exists once and immediately after deployment. The services for plans and tests, here RMK MyApplication_mybot Plan and RMK MyApplication_mybot Test: /Test: My Test, are added to the monitoring as soon as the associated suites have been run for the first time.
2.2. Configuring service rules
Creating a rule for the plan status
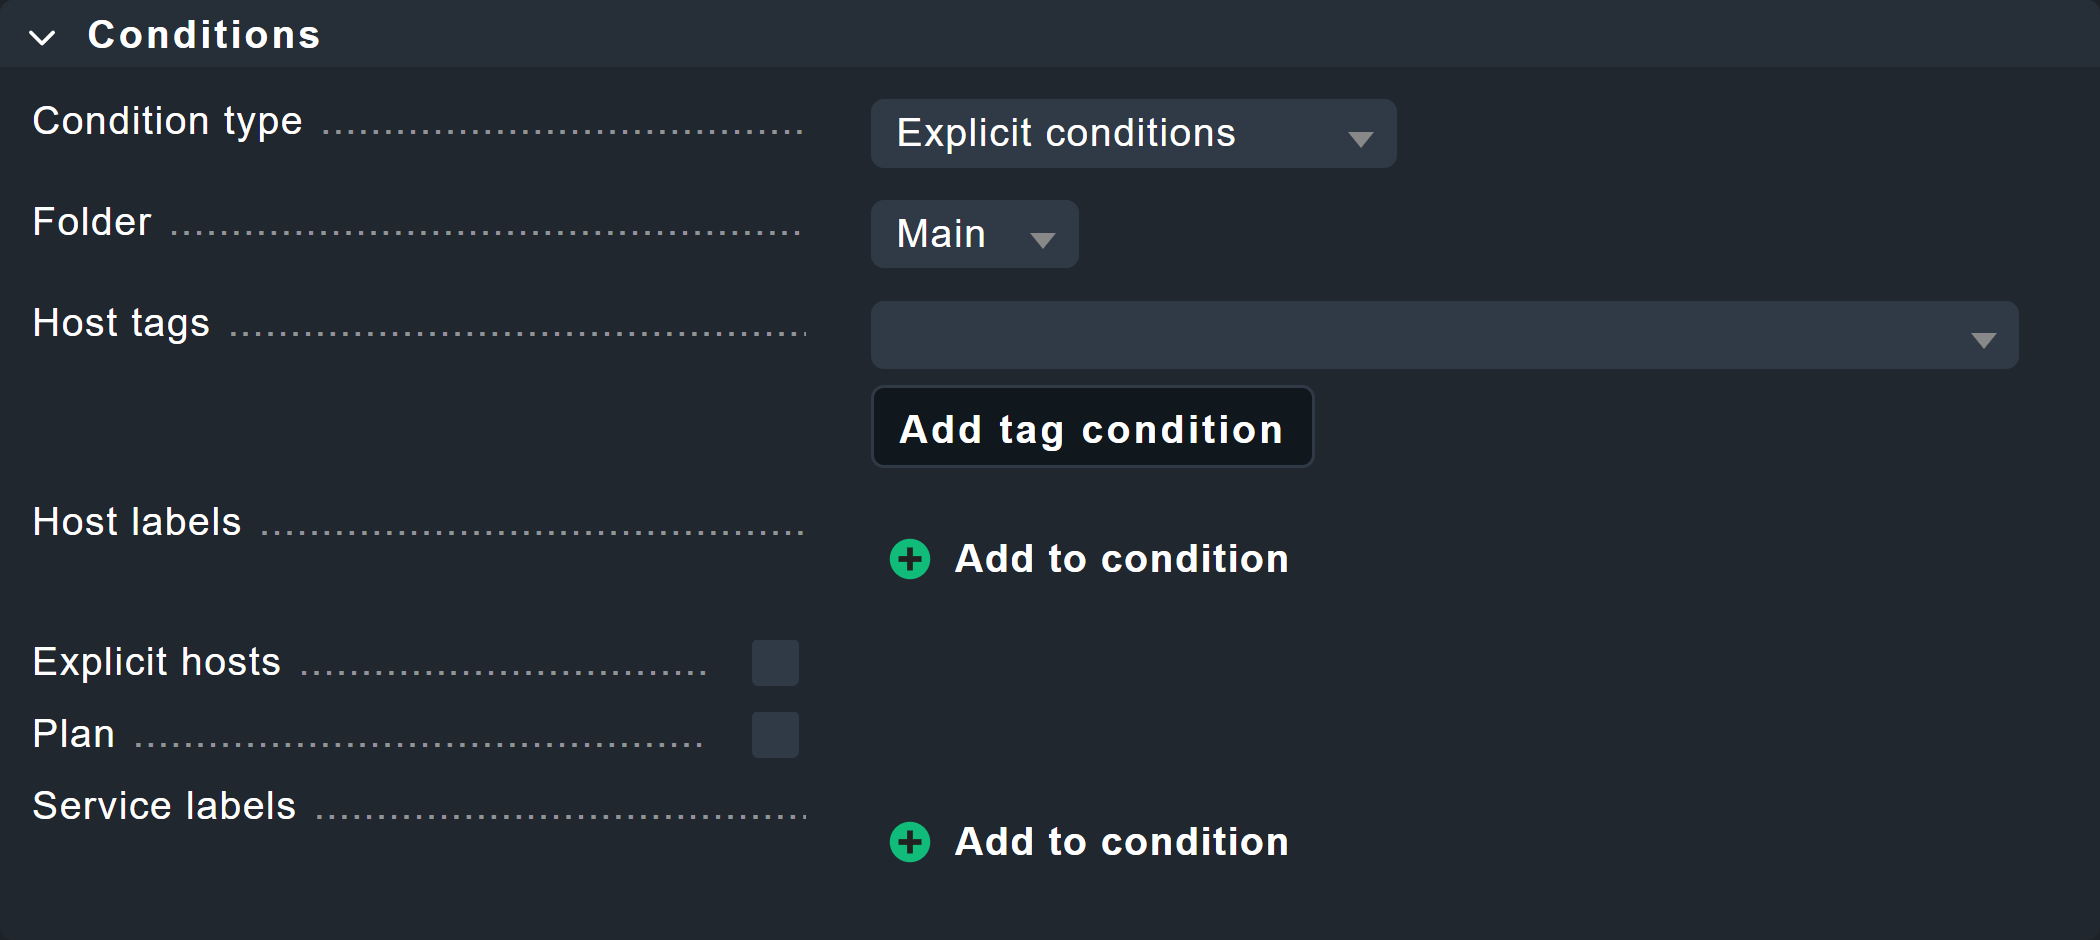
Reminder: Maximum runtimes for plans were defined in the agent rule above. These runtimes can be evaluated with the Robotmk plan rule. For example, you can set the service to CRIT when 90 percent of all calculated timeouts have been reached.

In the Conditions box, there is the option of restricting the rule to specific plans.
Creating a rule for the test status
Additional data can also be retrieved for individual tests in the test suites via the Robotmk test rule.
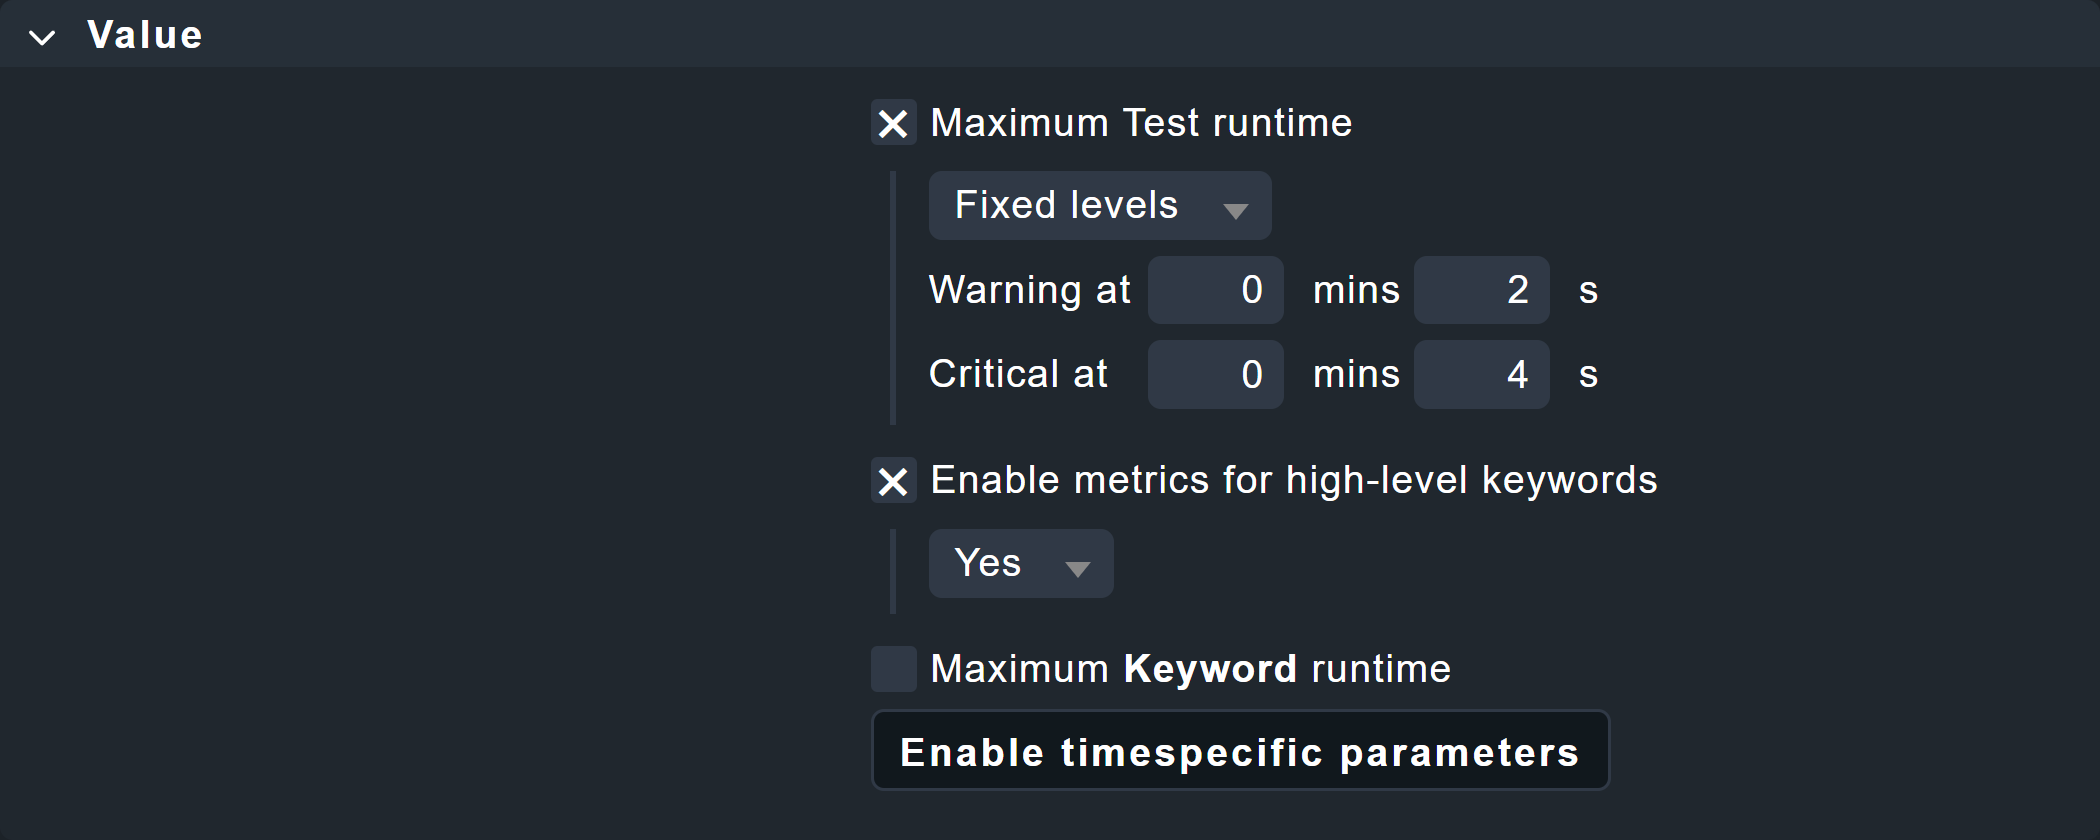
Here you will again find the option to monitor runtimes, both for tests and keywords.
The monitoring of keywords is a Checkmk-specific function.
Therefore, the suite-internal status in the Robot Framework report could also be OK because the test suite was processed within the maximum permitted runtime — in Checkmk, however, WARN or CRIT, because a status change takes place at, for example, 80 percent of this maximum permitted runtime.
In addition, the Enable metrics for high-level keywords option can be used to generate metrics for higher-level keywords. This is particularly useful if your tests are organized in such a way that the higher-level keywords describe the 'what' and the lower-level keywords describe the 'how' — this gives you more abstract evaluations.
In this example, the threshold values for the maximum runtime of a test are 2 and 4 seconds. You will see the effects below in the chapter Robotmk in monitoring.
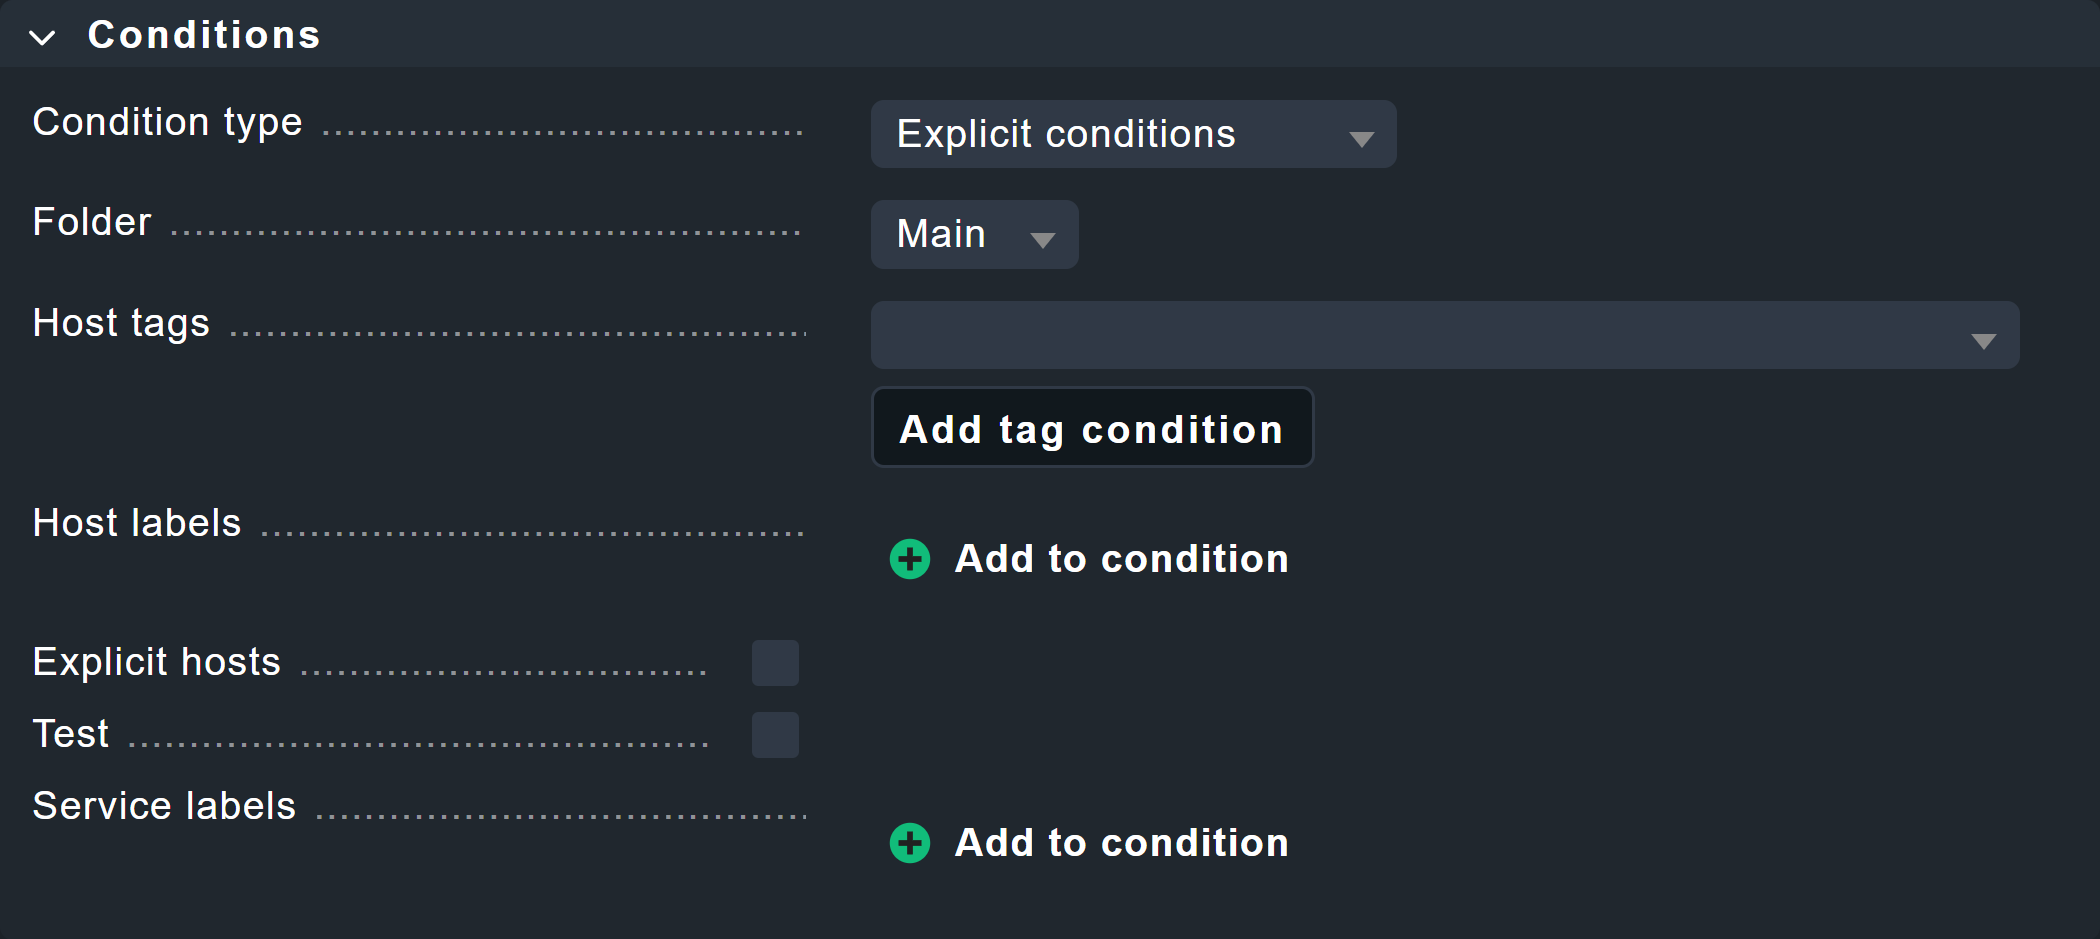
Once again, there is an explicit filter option in the Conditions box, here for individual tests.
2.3. Robotmk in monitoring
In monitoring, you will find services for the status of the Robotmk scheduler as well as the individual plans and tests — even if you have not created any separate service rules.
Scheduler status
The service RMK Scheduler Status is OK if the scheduler is running and has successfully built the execution environments.
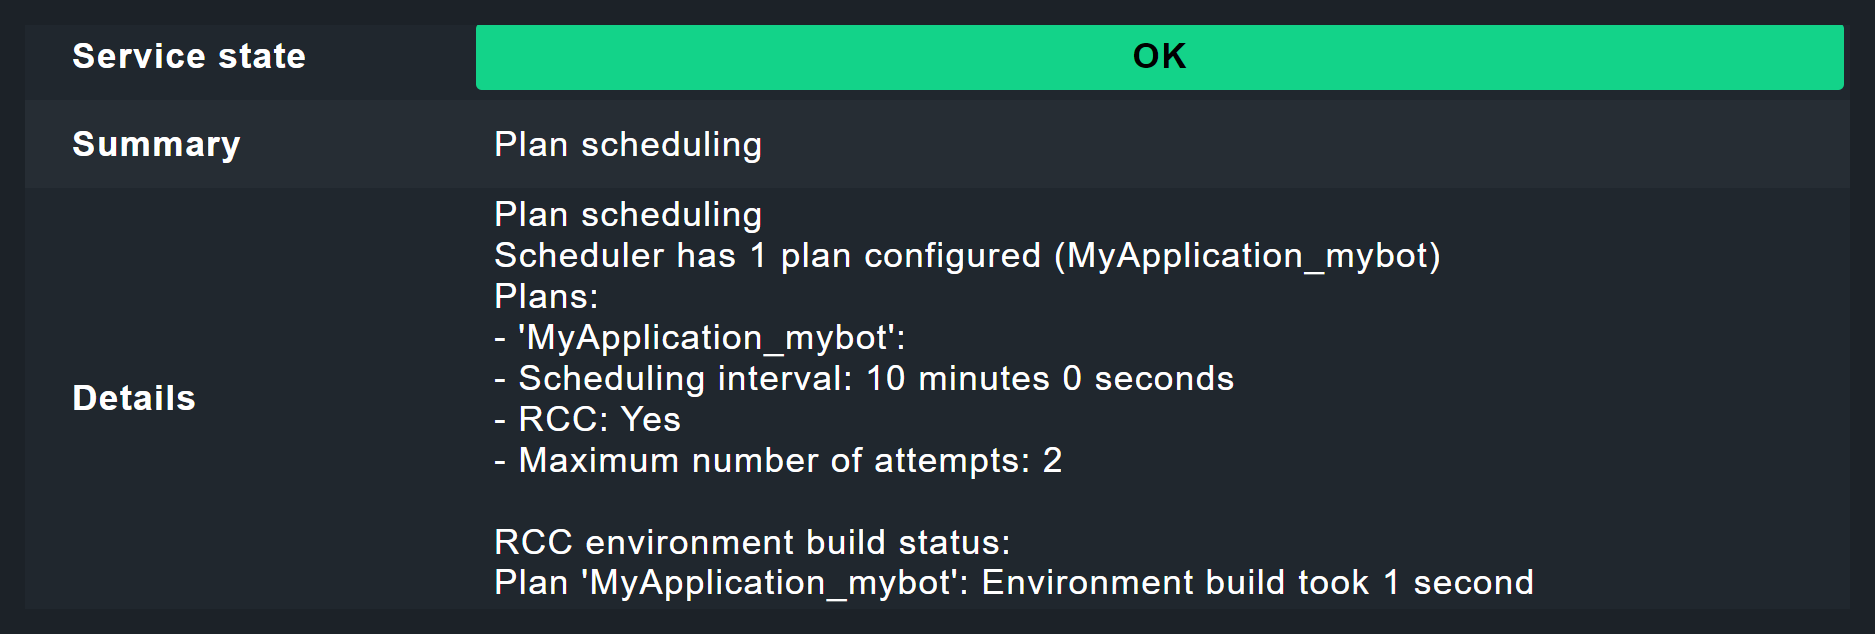
Here in the image you can see the note Environment build took 1 second.
One second to build a virtual Python environment with Pip and Robot Framework?
This is possible because RCC is clever: files that have already been downloaded are reused and a new build is only carried out after changes have been made in conda.yaml.
The first build would have taken 30 seconds or more.
Plan status
The status of a plan is reflected in a service named by application name and suite, for example RMK MyApplication_mybot Plan.
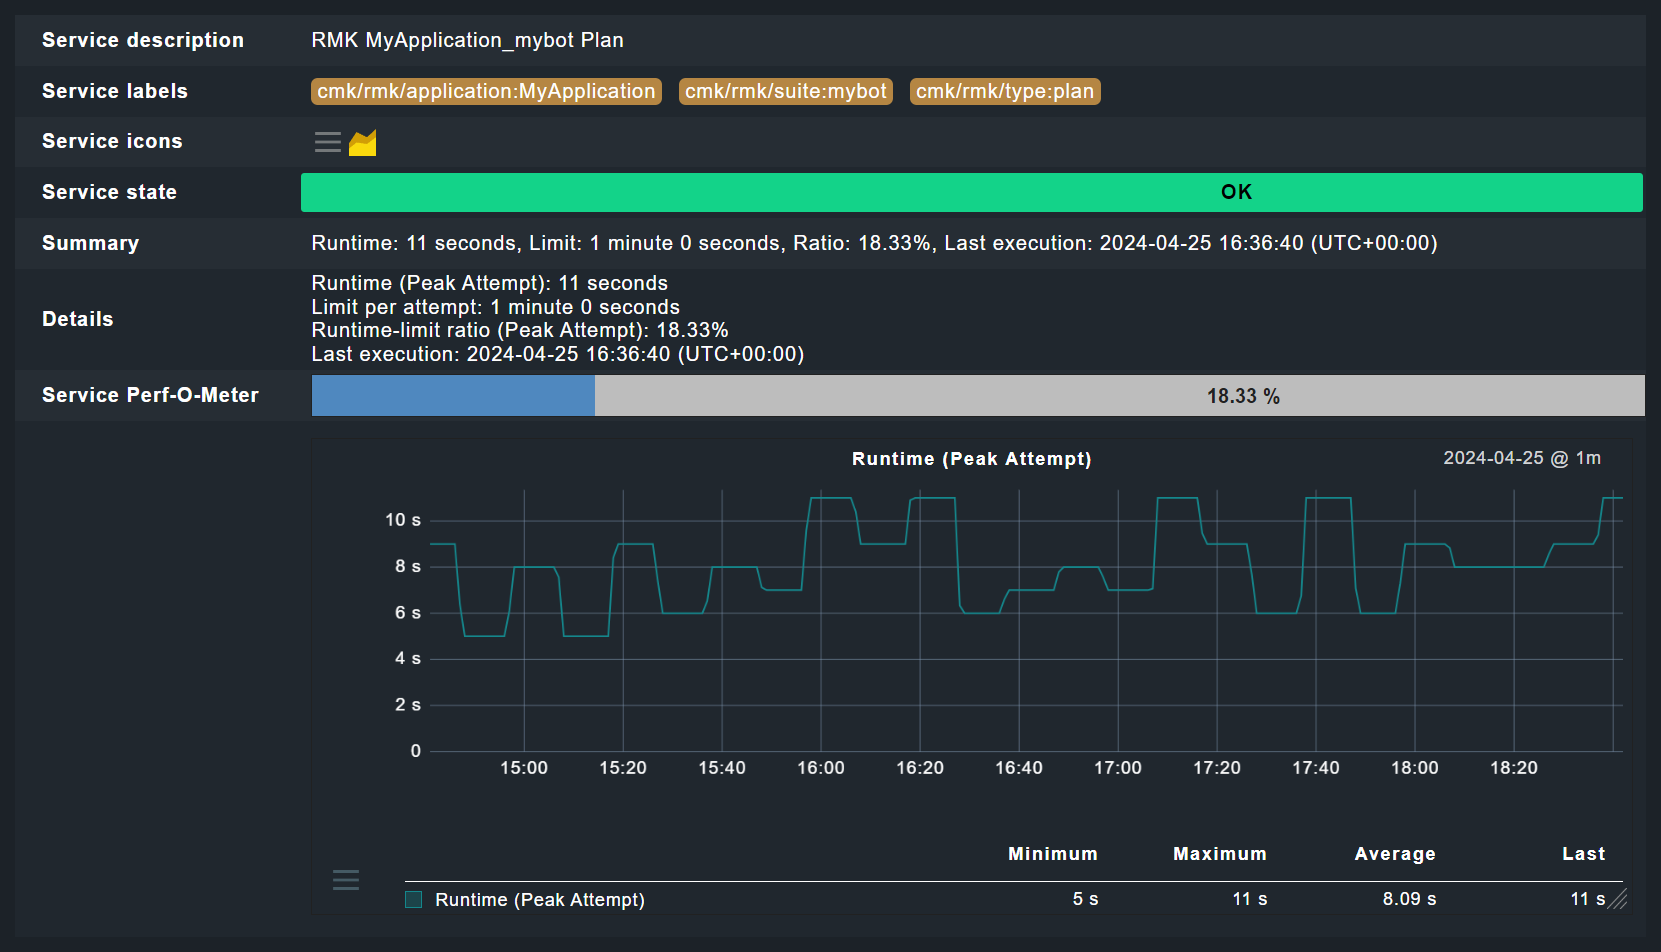
Test status
The evaluation of the tests is where it gets really interesting.
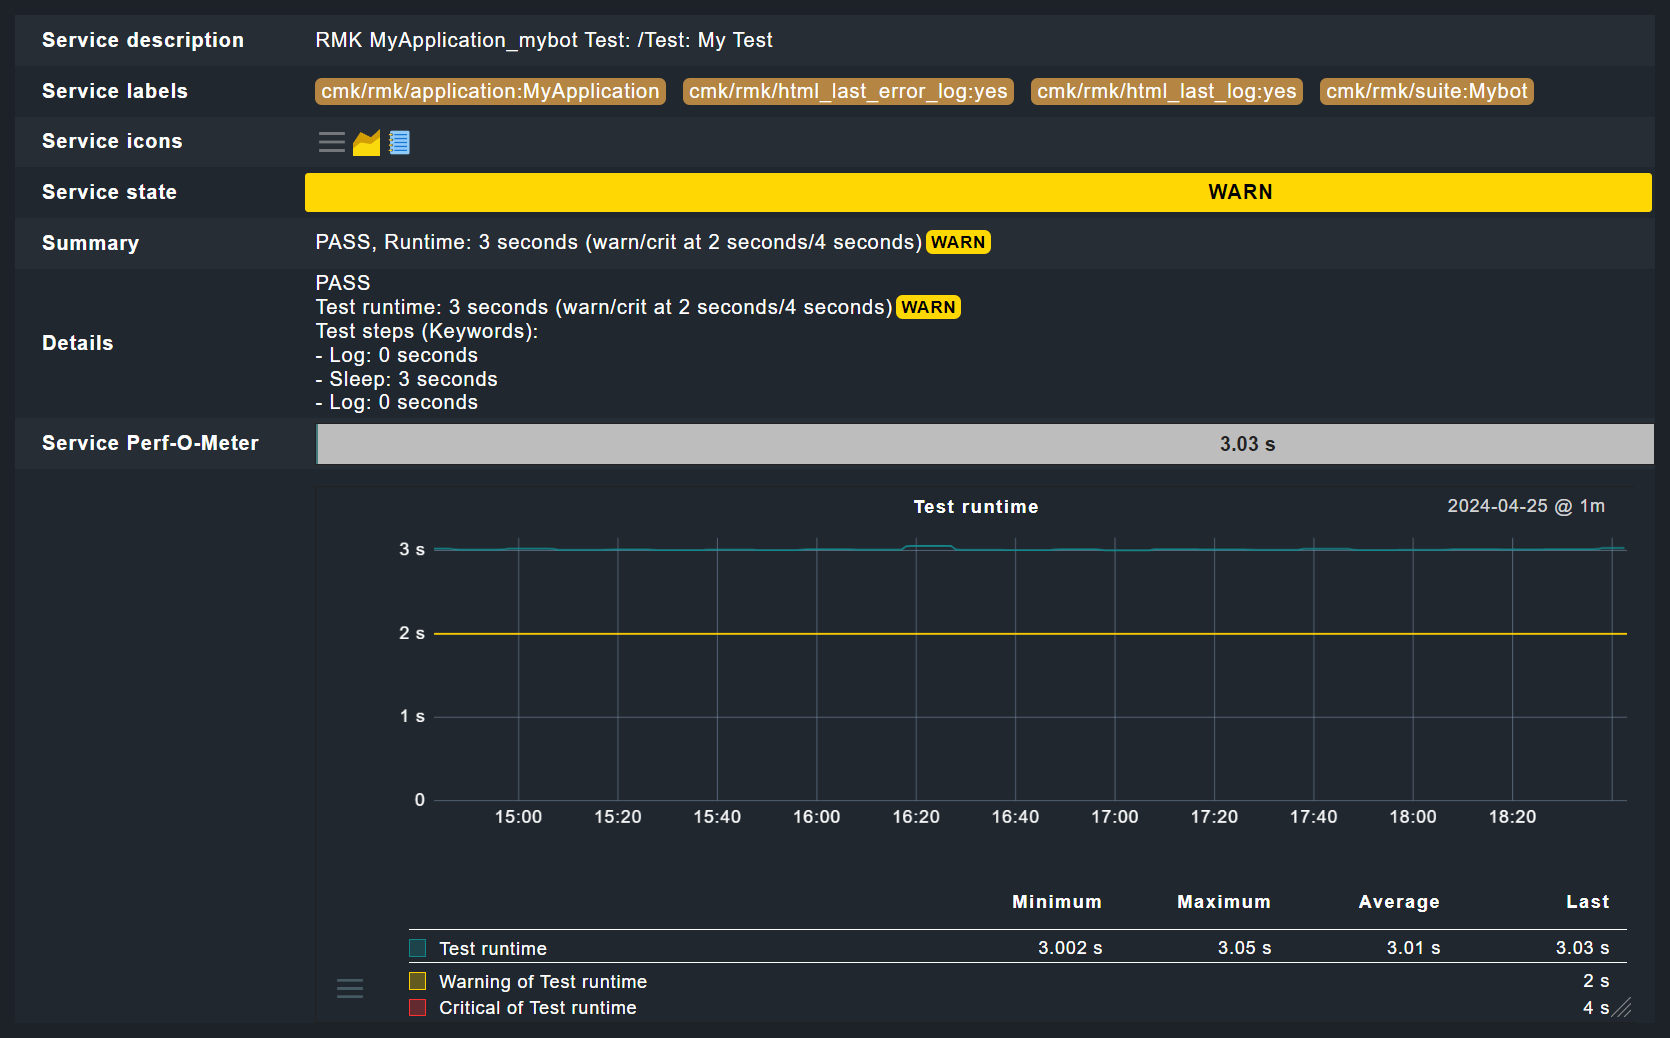
In the image you can now see the effect of the threshold values set above for the runtime of tests — here the 2 seconds for the WARN status.
As the Sleep 3 Seconds instruction in the test itself already ensures a longer runtime, this service must go to WARN here, although the test was successful.
The fact that the test was successful is shown by the Robot Framework report, which you can access via the ![]() log icon.
log icon.
The report now clearly shows that the test and test suite have run successfully.
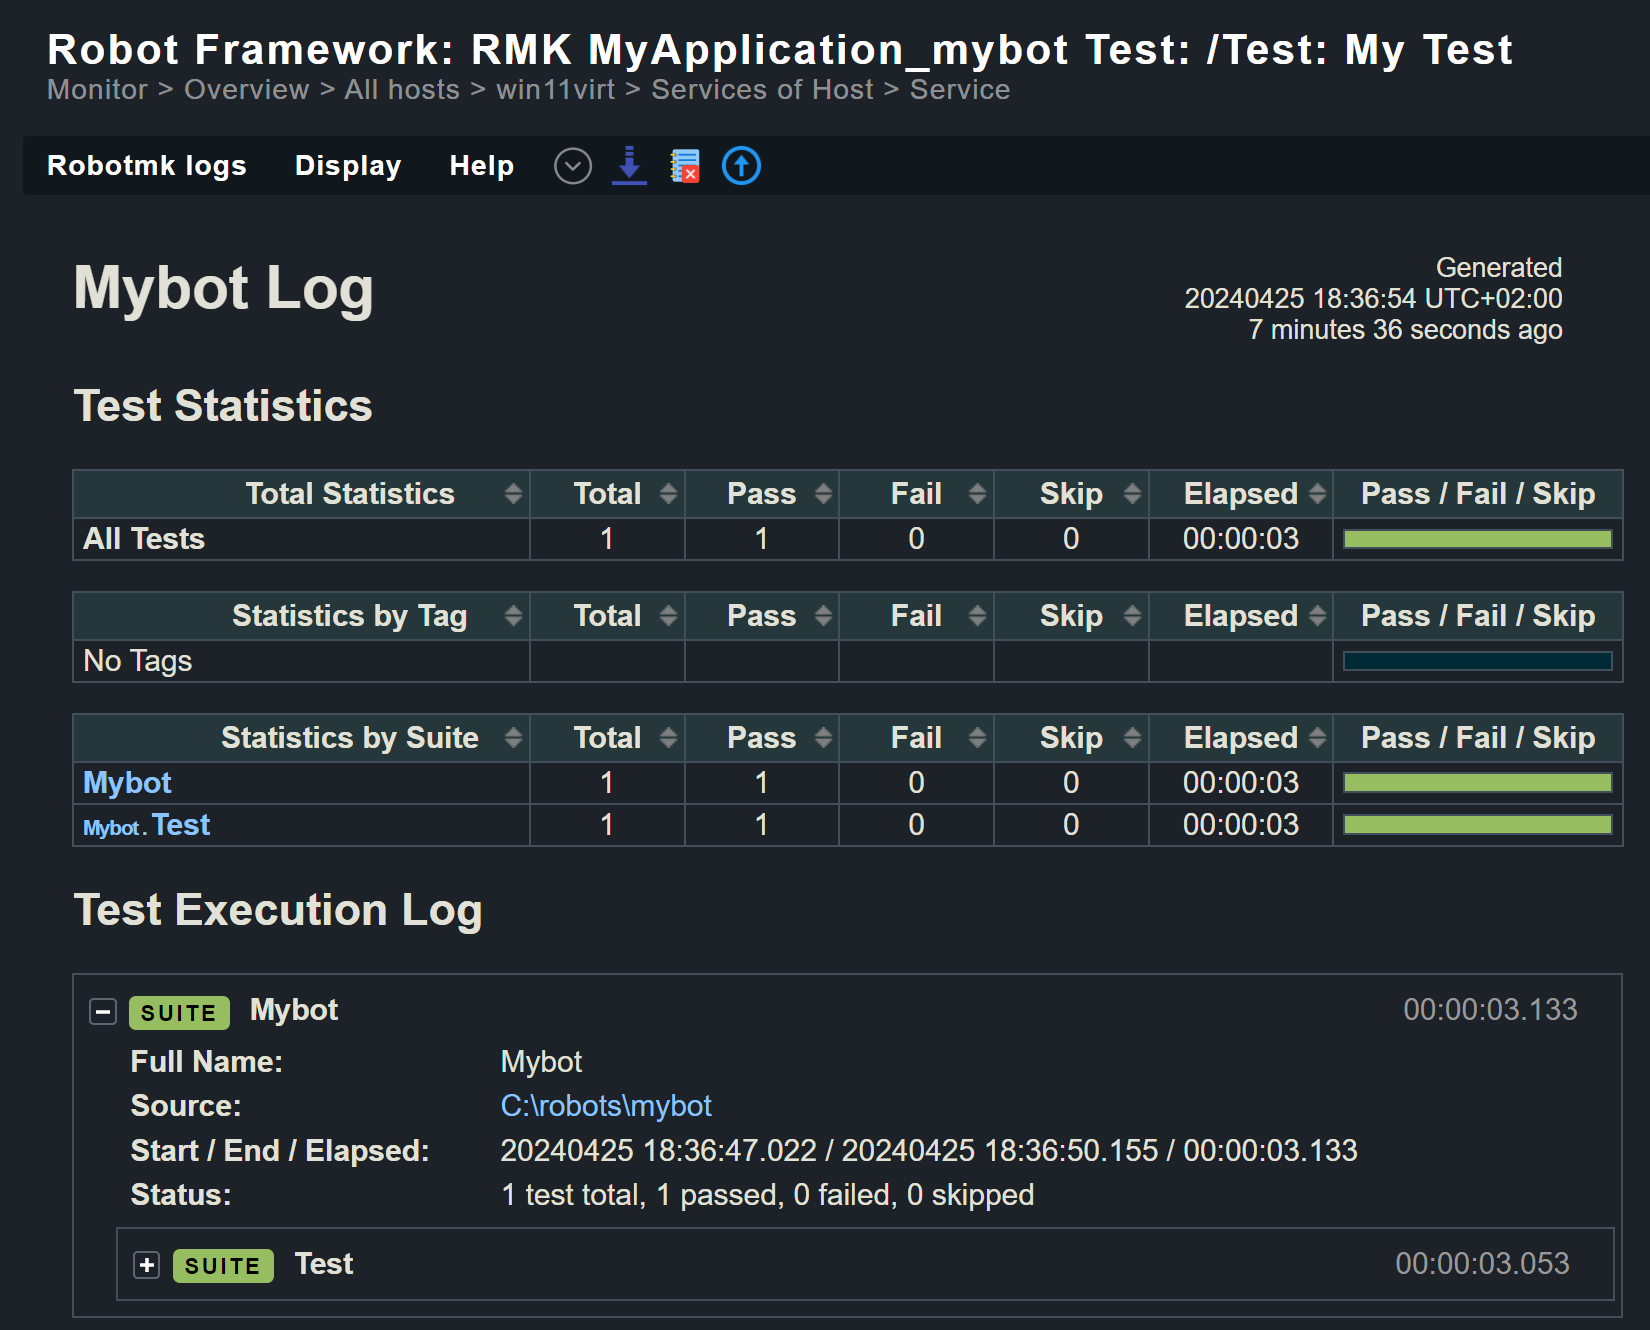
At the bottom of the data you can also see the individual keywords, here for example Log ${MYVAR} together with the value My value set in Checkmk for MYVAR.

Dashboards
Of course, you can build your own dashboards as usual — but you can also find two built-in dashboards under Monitor > Synthetic Monitoring.
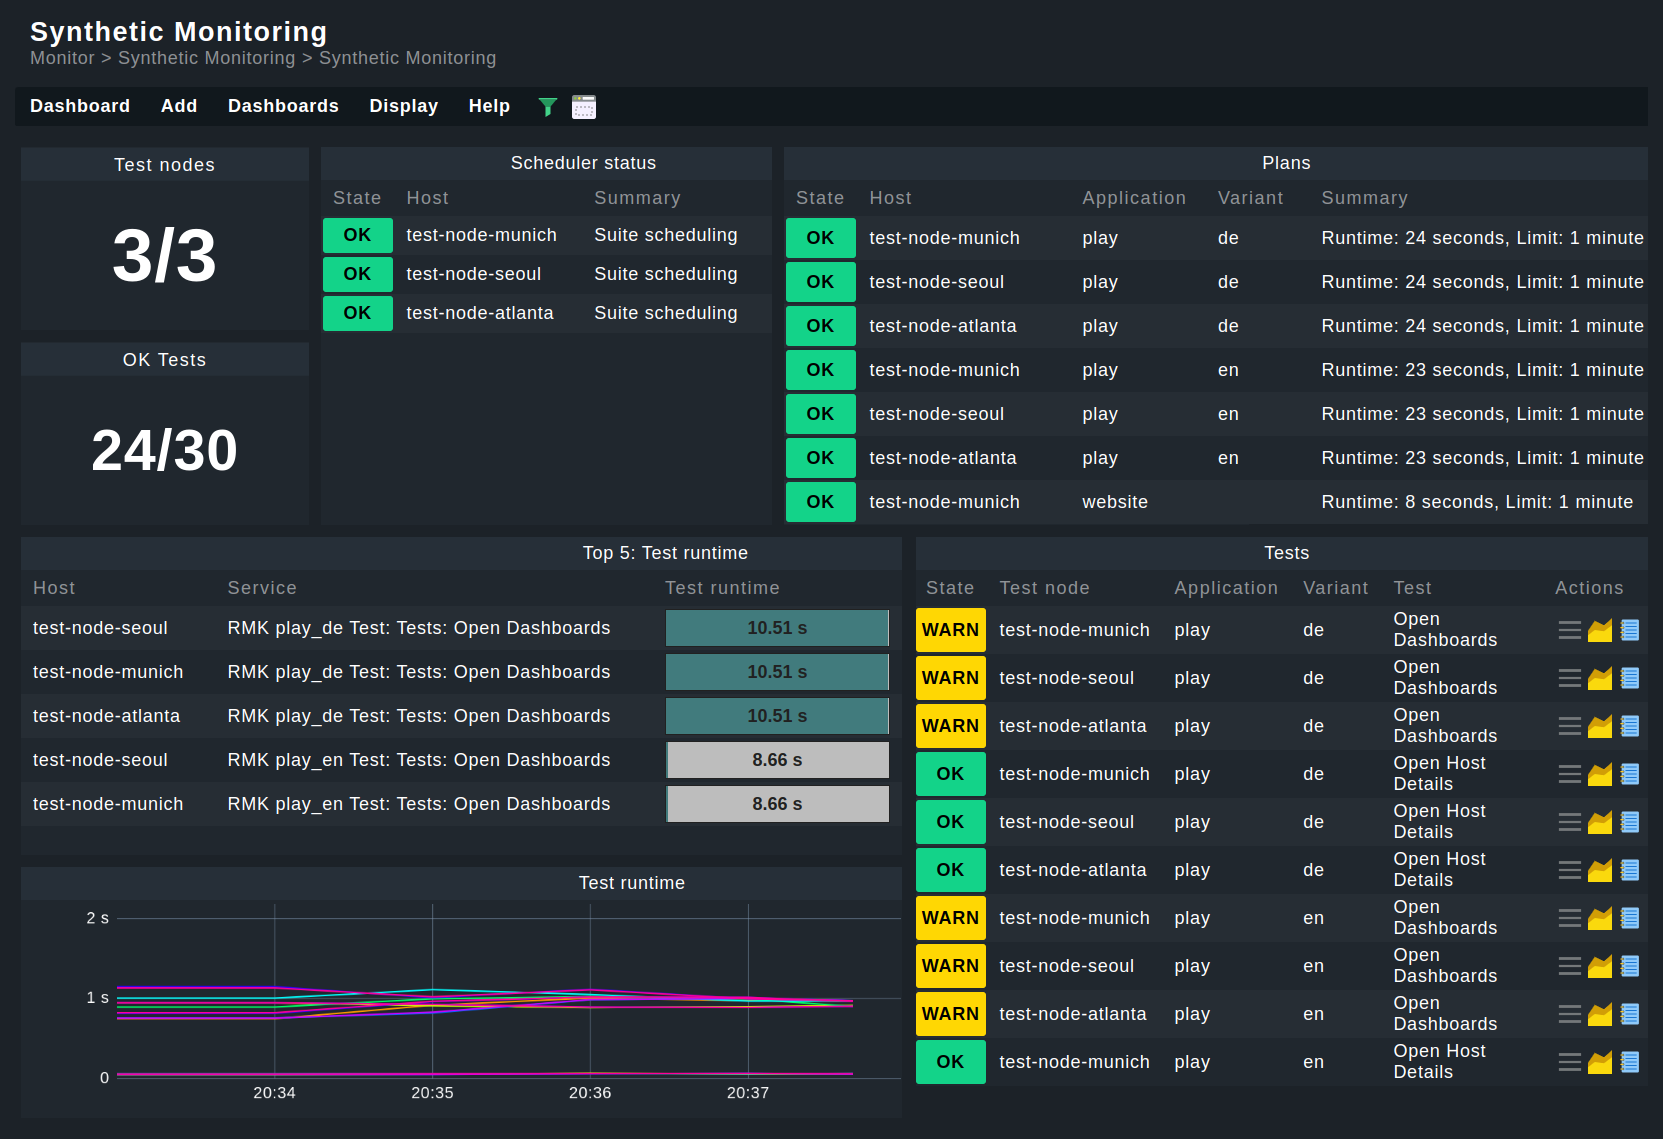
Prerequisite: For dashboards to work, HW/SW inventory must be activated on the hosts concerned.
3. Managed robots
We have so far assumed a scenario in which the test suites are already available on the test hosts. However, with the managed robots feature, robots can also be managed centrally on the Checkmk server and distributed via Checkmk agents.
From the above procedure you already know the entire configuration for existing robots using the Robotmk scheduler (Windows|Linux) rule.
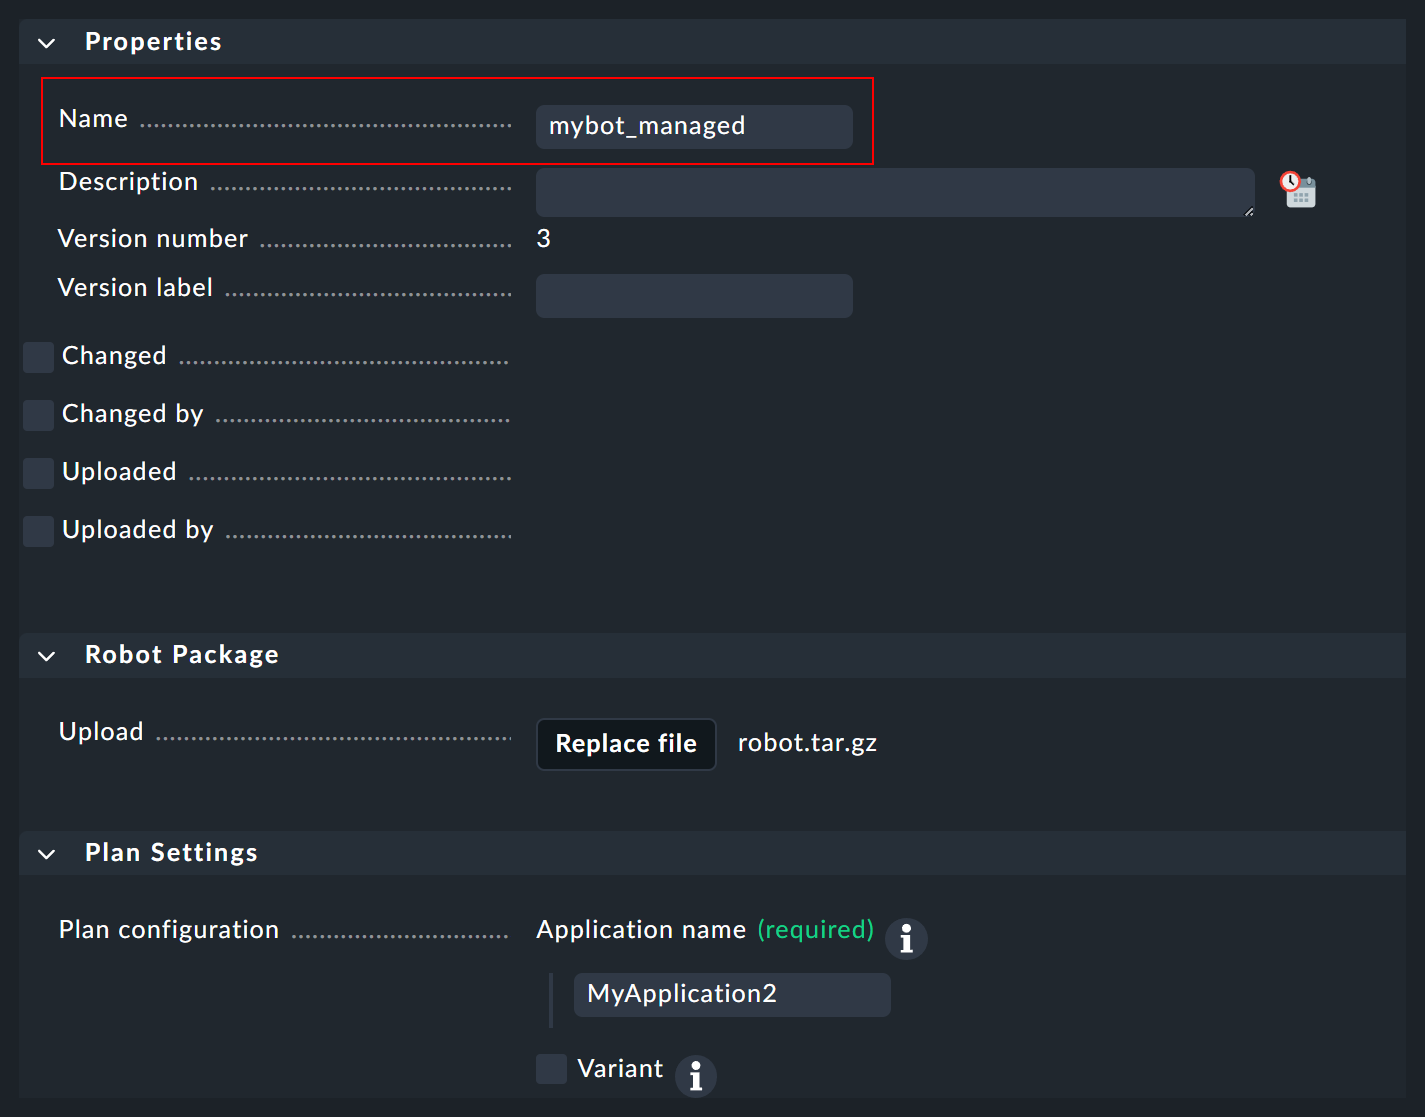
In addition, simply enter the archive file (see below) with the packed robot. Here in the screenshot, under Plan Settings you can see the upload field for the robot — the same options as in the scheduler. Pay attention to the name at the top under Properties. This is mandatory, as the robot will later be configured in the scheduler using this name.
To use such a Managed robot, the Robotmk scheduler (Windows|Linux) rule is again used. But instead of scheduling the execution of the robot here, simply specify the desired, preconfigured robot under Sequence of plans. If required, you can still adapt the plan’s configuration for the preconfigured robot for this application here. In practice, the feature is therefore usually limited to outsourcing the known configuration and having the robot archive files distributed by the agent.
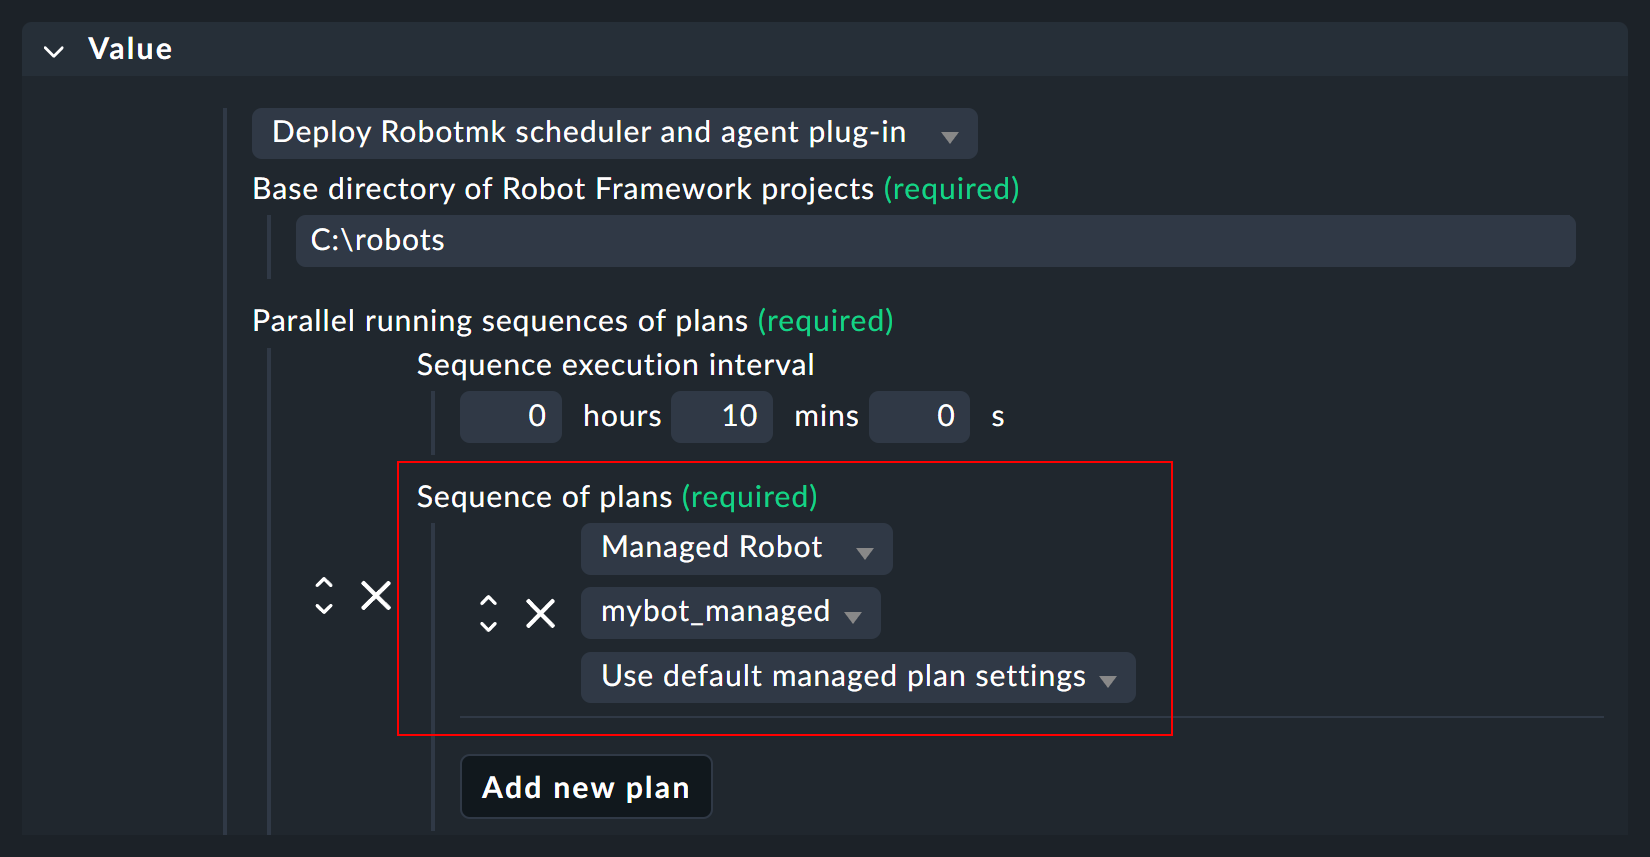
The agent then transfers the specified archives to the desired hosts and stores them in the agent directory under robomk_output/managed, where they are then unpacked and finally executed.
3.1. Creating a robot archive
In principle, you could simply archive the complete robot directory with the standard files (robot.yaml, conda.yaml, test.robot).
However, such tests are often managed via Git and consequently there are regularly files that should not be distributed — these are typically managed via a gitignore file.
As an aid to ensuring clean archives, here are two small scripts for Windows and Linux that create archives without the files to be ignored.
Use these scripts only as an aid and always test the functionality for your system beforehand.
- Windows
- Linux
4. Monitoring key performance indicators (KPI)
Above you have already seen that the runtimes of high-level keywords can be monitored as part of a test.
However, you can also include any keywords as individual services in the monitoring.
This is particularly useful for highly-abstract user keywords, which in turn call up several simple (standard) keywords such as Click or Log — in other words, these are basically used as functions.
Two variants are available for service discovery: Patterns in Checkmk and markers in the test suites.
For pattern-based discovery, the desired keywords are stored as regular expressions using Checkmk rules.
For marker-based discovery, markers are coded directly in front of the keywords in the tests themselves. These markers are processed using Robotmk’s own library.
Regardless of how the keyword data enters the monitoring, it must be configured there using the Robotmk KPI monitoring service rule.
4.1. Variant 1: Discovery via pattern
For this variant, you do not need to make any changes to your tests themselves. Simply open the Robotmk KPI discovery rule and enter the keywords to be monitored as regular expressions or very specific names.

Caution: If the regular expression matches more than one keyword in the same test, only one keyword will be recognized and its service status will be UNKNOWN (because Checkmk does not know which match is actually intended).
4.2. Variant 2: Discovery via marker
For a discovery via marker, you must perform the following steps:
Install the Robotmk library.
Import the Robotmk library into the suite.
Place the marker keyword in front of relevant keywords.
For the installation, the conda.yaml from above must be extended with robotframework-robotmklibrary.
Modifications compared to the suite above are highlighted in yellow:
The test suite tests.robot must be extended by the library (in the Settings area) and a marker.
KPIs will often refer to individual user keywords, so the keyword Foobar is added here (which only calls the standard keyword Log and is in turn called by the test case My Test).
*** Settings ***
Documentation       Template robot main suite.
Library             RobotmkLibrary

*** Variables ***
${MYVAR}    Hello Checkmk!

*** Test Cases ***
My Test
    Log      ${MYVAR}
    Sleep    3
    Log      Done.
    Monitor Subsequent Keyword Runtime  discover_as=My user keyword
    Foobar

*** Keywords ***
Foobar
    Log    The foo barred!
The Robotmk keyword Monitor Subsequent Keyword Runtime is the marker to (trigger Checkmk to) monitor the following keyword (Foobar); more precisely, its runtime.
The optional discover_as argument can be used to specify an individual name for the service in the monitoring — the keyword Foobar therefore appears in the monitoring as a service called My user keyword.
The big advantage here compared to pattern-based discovery is that the same keyword can also be explicitly monitored multiple times within a single test.
Here is the example above, extended by two Foobar calls:
*** Settings ***
Documentation       Template robot main suite.
Library             RobotmkLibrary

*** Variables ***
${MYVAR}    Hello Checkmk!

*** Test Cases ***
My Test
    Log      ${MYVAR}
    Sleep    3
    Log      Done.
    Monitor Subsequent Keyword Runtime  discover_as=My user keyword
    Foobar
    Monitor Subsequent Keyword Runtime  discover_as=Foobar_2
    Foobar
    Monitor Subsequent Keyword Runtime  discover_as=Foobar_3
    Foobar

*** Keywords ***
Foobar
    Sleep    3
    Log    The foo barred!
The three calls to the Foobar keyword would therefore appear in the monitoring as My user keyword, Foobar_2 and Foobar_3.
4.3. Configuring the service rule
Regardless of which of the two variants the keywords are used for monitoring, the next step is always to configure the evaluation: At what runtime should the services go to WARN or CRIT? To do this, define the corresponding levels in the Robotmk KPI monitoring rule.

4.4. Keywords in monitoring
The keyword services appear in monitoring under one of these two patterns:
Pattern-based: RMK MyApplication_mybot Test: /Test: My Test KPI (cmk): Foobar
Marker-based: RMK MyApplication_mybot Test: /Test: My Test KPI (rf): Foobar
The difference is therefore only in the indication of origin in brackets directly before the keyword.

As shown in the above screenshot with two Foobar keyword services, the suite needed to be extended somewhat:
*** Settings ***
Documentation       Template robot main suite.
Library             RobotmkLibrary

*** Variables ***
${MYVAR}    Hello Checkmk!

*** Test Cases ***
My Test
    Log      ${MYVAR}
    Sleep    3
    Log      Done.
    Foobar
    Monitor Subsequent Keyword Runtime  discover_as=Foobar
    Barfoo

*** Keywords ***
Foobar
    Sleep    3
    Log    The foo barred!

Barfoo
    Sleep    11
    Log    The End of Barfoo
The two keywords Foobar and Barfoo both appear under the name Foobar in the monitoring, but can be distinguished by the indication of origin in brackets.
The example with two different keywords that are listed under the same name primarily serves to clarify the origin information.
As already mentioned above, the actual purpose of discover_as is to be able to call up one keyword multiple times in a test but to name each occurrence individually.
5. Offline mode for test environments/RCC
By default, RCC takes care of setting up the environments by reading the YAML configuration and downloading the corresponding packages and dependencies from the network.
But what if the hosts on which the tests are to run have no or very limited Internet access?
Checkmk, or more precisely the Robotmk scheduler, can help here by being able to create RCC environments without requiring a direct Internet connection. The short version: The environments are built in advance on any computer and then distributed either via a ZIP archive or from a remote server.
Read below to find out exactly how the two methods work. A little RCC knowledge is required to understand this, however — and we need to elaborate a little — on the one hand to explain the technical internals of RCC, and on the other hand to explain why in this particular context we do not follow our usual practice of referring to the manufacturer.
5.1. RCC — a brief digression
RCC history
Where does the tool come from? RCC was originally developed by the Robocorp company (nowadays Sema4.ai). Sema4.ai’s business model is a cloud-based platform in which customers can run their own scripts to automate business processes. RCC forms the basis for creating exactly the same virtual environments both locally at the customer’s site and in the cloud.
At Checkmk we use RCC for a different use case: Here, your Robot Framework scripts should be able to run both on your local (development) computer and on the Robotmk test hosts (Windows or Linux).
In the course of the acquisition of Robocorp by Sema4.ai in 2024, RCC was re-licensed and is now proprietary software. This process was unfortunately not very transparent — hence this brief explanation.
The variant that is delivered with Checkmk is based on the final open RCC version and is maintained by us. The RCC fork is therefore now an integral part of Checkmk and is also documented here — as far as is relevant for its use in Checkmk.
It is a little more difficult with RCC remote server, the tool that is responsible for the distribution of RCC environments. This is merely a component of RCC that is only created during compilation, it is not a product in its own right. This is why there has never been any real documentation from Robocorp apart from a very specific application for the Robocorp platform.
RCC internals
You should be familiar with some terms and concepts in order to understand them:
| Term | Explanation | Note |
|---|---|---|
Catalog |
Blueprint for environments |
Templates for building virtual environments |
Hololib |
Collection of available catalogs |
Hololib is a repository for blueprints where each unique file is stored only once — and can be used to create multiple Spaces. |
Space |
Instance of an environment |
Multiple Spaces can be created from one catalog |
(Shared) Holotree |
Collection of available Spaces |
(Shared) Holotree is a storage for spaces, in which each unique file is stored only once — and is available for multiple spaces. |
|
Environment variable |
Path where RCC stores Hololib and Holotree; by default |
|
Secured variant with limited write access |
Path under which Checkmk-RCC stores Hololib and Holotree; below |
Holotree path |
Absolute path, below |
Under this path Hololib blueprints are compiled to Holotree spaces; must be identical on source and target computer in an environment. |
RCCRemote |
Server for the provision of catalogs. |
Is usually operated via the RCCRemote-Docker container. |
ROBOCORP_HOME
ROBOCORP_HOME requires a closer look.
This environment variable defines the file path under which RCC saves Hololib and Holotree.
All binary files within Hololib, i.e. the template collection, are compiled under an absolute path — the so-called holotree path, a subfolder of ROBOCORP_HOME.
This also means that the same file paths must be available on the test hosts on which the robots will later run as on the computer on which you create the robots.
Also relevant in this process: User context.
Under Windows, the Robotmk scheduler is executed by default as a sub-process of the Checkmk agent under the LocalSystem account (in the SYSTEM context).
Under Linux, the scheduler runs under the same user as the agent, i.e. root.
If the user contexts are now to be changed, Windows and Linux will behave differently.
Windows: The scheduler user SYSTEM cannot be changed, but the option Execute plan as a specific user can be used to configure a user for the execution of individual robots/plans.
Linux: The Customize agent package (Unix) rule and its Customize user option can be used to change the user for the agent; however, it is not possible to run individual robots/plans in other contexts.
In Checkmk, the Robotmk scheduler allows itself an additional security measure for RCC:
To ensure that only schedulers and manually configured users really have write access to ROBOCORP_HOME, a very specific file path must be defined here — according to the table above plus an additional hierarchy level for the desired user context (see below for what this looks like in practice).
This prevents malicious files from finding their way into Hololib/Holotree, i.e. code injection (in a nutshell: If ROBOCORP_HOME on the development machine were set to something like C:\foobar and if this directory already existed on the test hosts and contained malware, it could be executed).
5.2. Variant 1: ZIP archives
The practice is far simpler than the technical background — especially when working with a catalog as a ZIP archive (or tar.gz archive under Linux).
Basically, you just build the catalog by specifying the ROBOCORP_HOME variable, export it as an archive and then distribute it manually.
Below is the path in detail.
The paths in the following examples are limited to Windows — only if Linux requires different commands will these be specified explicitly.
Set ROBOCORP_HOME
The catalog, i.e. the template for explicitly implemented environments (spaces), can be created on any computer.
First set ROBOCORP_HOME in the terminal.
Under Windows:
For the headless execution under the LocalSystem account:
For robots that require desktop access and a corresponding user:
Under Linux:
For the headless execution as standard user:
For the robots that require desktop access and a corresponding user:
You can then enter your bot directory and build the environment/catalog:
Creating the ZIP catalog
The catalog must now be exported as a ZIP.
First check whether a Hololib catalog with the correct Holotree file path already exists.
To do this, you need the hash of the conda.yaml:
Then display all available Hololib catalogs (abridged version shown here):
When the hash is found in the list, you can export:
Deploying the ZIP catalog
The zipped catalog is simple to deploy:
Copy the archive manually to the test host, for example to C:\robotmk\holotrees\myrobot-env.zip.
In the Robotmk Scheduler (Windows|Linux) rule (or in Managed robots), set the Environment dependency handling option to Load from ZIP file, and enter the desired file path to the zipped catalog, in this case C:\robotmk\holotrees\myrobot-env.zip.
Please do not confuse this path with the holotree path!
This serves only as a repository for the Hololib catalog ZIPs to be imported.

When the scheduler is later started, it will import all Hololib catalog ZIPs and build the spaces from these templates, i.e. the environments that are actually going to be used. So instead of downloading all dependencies via pip and Conda from the Internet, only an archive is unpacked — which is not only offline, but also much faster.
And just to avoid any misunderstandings — the robots themselves must of course still be available on the test host or deployed as managed robots — this is purely about the environments!
5.3. Variant 2: RCCRemote server
First of all: RCCRemote is not a stand-alone tool, you will not find any documentation or even a product page from Robocorp/Sema4. The remote server is merely a part of RCC and is built when RCC is compiled. The server is usually operated via a container. For container operation, there is now a project on the GitHub pages of Elabit, the developer of the original Robotmk plug-in, called RCCRemote-Docker. However, RCCRemote and RCCRemote-Docker are not parts of Checkmk Synthetic Monitoring and are not covered by Checkmk support!
Catalogs for this distribution path can be created in two ways: Catalogs exported as ZIP files (see above) can be used for both Windows and Linux. For Linux only, it is also possible to build the catalogs directly in the RCCRemote-Docker container, which completely eliminates the need for manual intervention.
You can find out how to set up RCCRemote-Docker, handle certificates and import catalogs on the project pages.
The configuration on the Checkmk side is now again — typically — quite simple: The Environment dependency handling option is this time set to Fetch from RCC remote server and supplied with the server’s address.

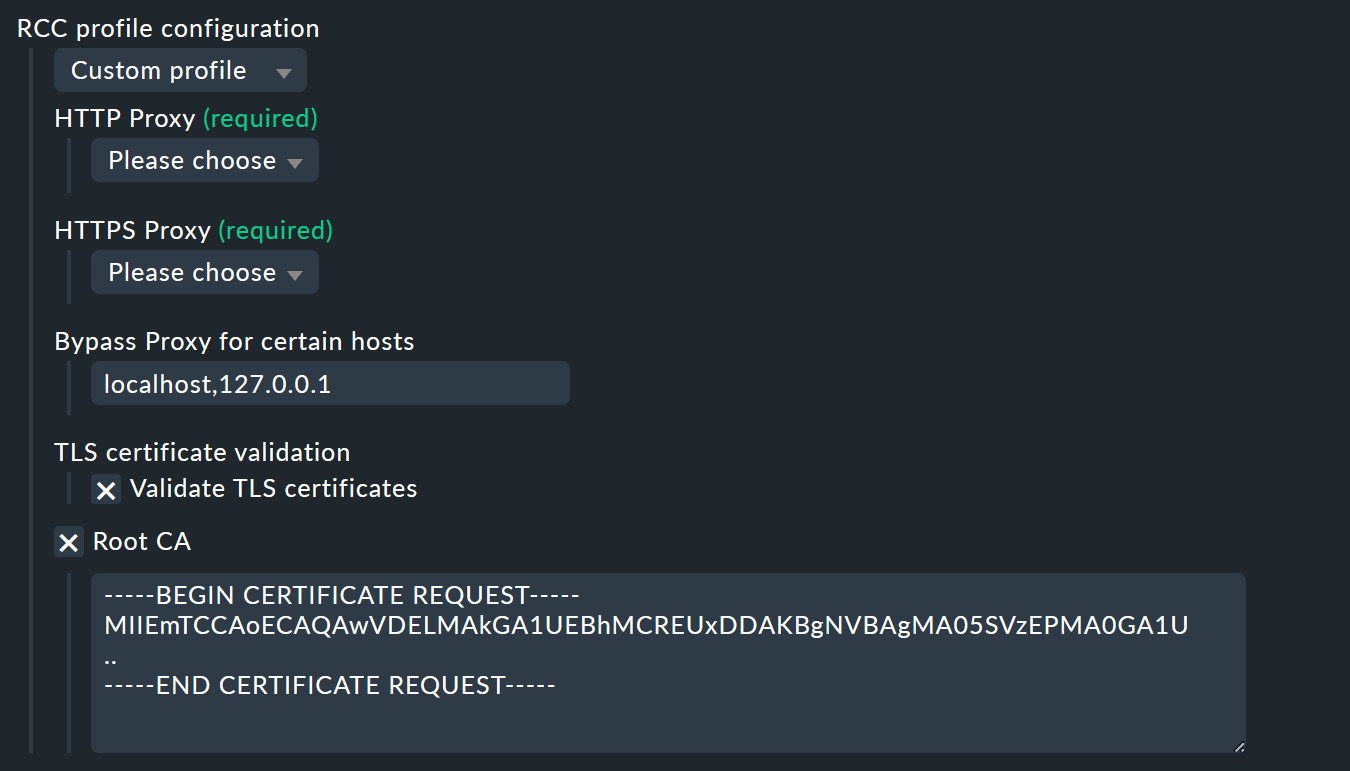
One final setting is still missing, depending on whether your RCCRemote server uses a self-signed or a CA-signed certificate. In both cases, you usually have to set Robotmk scheduler (Windows|Linux) the option RCC profile configuration to Custom profile.
For a self-signed certificate, it is sufficient to leave the Validate TLS certificates box unchecked:
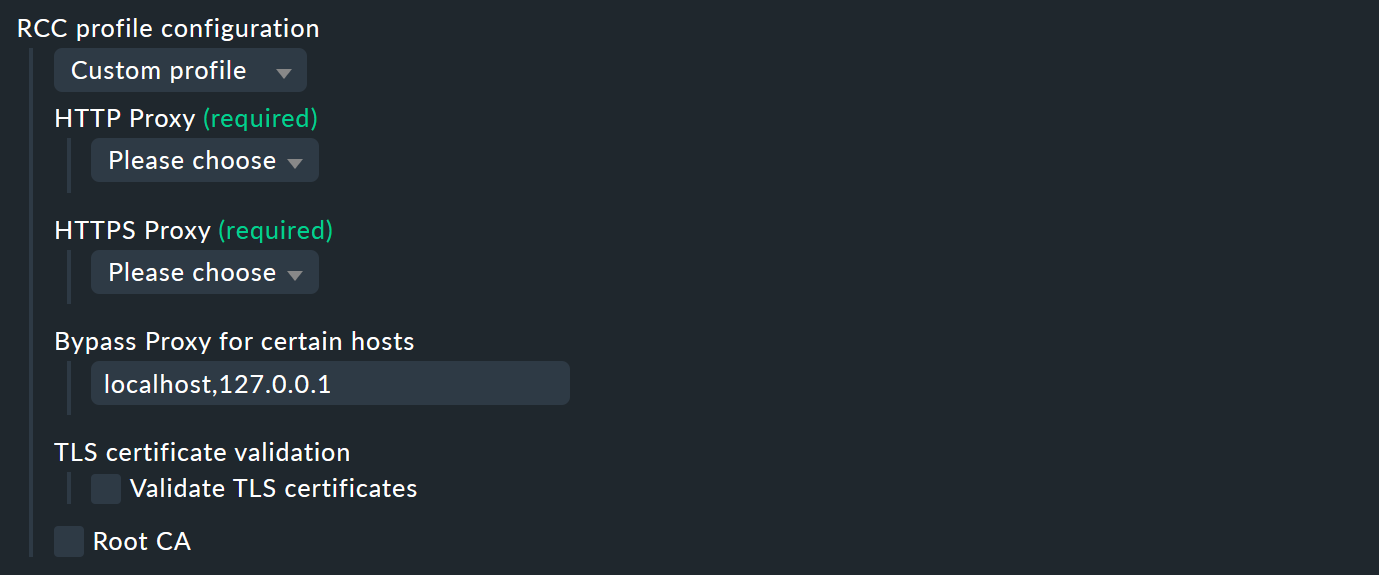
If, however, it is a CA-signed certificate, this option must be activated and the certificate from the signing authority must be stored under Root CA (in PEM format):
6. Troubleshooting
6.1. Scheduler reports No Data
If the scheduler does not receive any data, building the environment probably did not work.
A common reason for this are network problems, for example, due to which certain dependencies cannot be loaded.
In this case, take a look at the corresponding log file under C:\ProgramData\checkmk\agent\robotmk_output\working\environment_building.
6.2. Environment building fails: post-install script execution
This is a particularly interesting error that you might encounter on fresh Windows systems.
The conda.yaml can also contain instructions that are to be executed after the installation of the dependencies — for example, the initialization of the Robot Framework browser.
Python commands should therefore be executed here.
By default, Windows 11 has aliases for python.exe and python3.exe that refer to the Microsoft Store.
You must deactivate these aliases under 'Settings/Aliases for app execution'.
7. Files and directories
7.1. Windows
| File path | Description |
|---|---|
|
Log files and results from the suites |
|
Log files for building virtual environments |
|
Messages from the RCC execution |
|
Log file of the agent plug-in |
|
|
|
Agent plug-in |
7.2. Linux
| File path | Description |
|---|---|
|
Log files and results from the suites |
|
Log files for building virtual environments |
|
Messages from the RCC execution |
|
|
|
Agent plug-in |
|
Execution location for managed robots |
|
Storage location for managed robots archives |
Attention: Under Linux, the Robotmk scheduler does not create its own log file (under Windows the robotmk_scheduler_rCURRENT.log), but instead logs via agent and syslog.
The corresponding command:
