1. Why bother to create your own checks?
Thanks to the large number of check plug-ins supplied as standard, Checkmk can already monitor a great deal of relevant data. Nevertheless, every IT environment is unique, so that very individual requirements often arise. With the local checks, you are able to create your own services quickly and easily by making small extensions to the agent on the target host.
These local plug-ins differ from other checks in one important respect: Their state is determined directly on the host on which the data is being retrieved.
This eliminates the need to create checks using Python, and you are completely free to choose the scripting language. Local checks also give server admins a great deal of freedom. Monitoring admins only have to decide whether to include new local checks as services.
You can combine the mechanism provided by local checks with all of the methods supported by Checkmk for transporting agent data: data source programs, special agents, piggyback data and spool files. The data from all sources is merged, but conflicts will occur if the service name is (inadvertently) assigned twice — for this reason, make sure that each service names are unique. |
2. Writing a simple local check
2.1. Creating the script
A local check can be written in any programming language supported by the target host. The script must be constructed so that each check produces a state line consisting of four parts. Here is an example:
0 "My service" myvalue=73 My output text which may contain spacesThe four parts are separated by blanks and have the following meanings:
| Example value | Meaning | Description |
|---|---|---|
|
State |
The state of the service is given as a number: |
|
Service name |
The service name as shown in Checkmk, in the output of the check in double quotes. |
|
Value and metrics |
Metric values for the data. More information about the construction can be found in the chapter on metrics. Alternatively a minus sign can be coded if the check produces no metrics. |
|
State detail |
Details for the state as they will be shown in Checkmk in the Summary field. This part can also contain blanks. |
Up to Checkmk 2.4.0p4 there must always be exactly one space (ASCII |
If you are unsure about a possible output, you can simply test it by writing a small script with the echo command.
Insert the output you want to test into the echo command.
Our example uses double quotation marks on the outside, as variables inside (environment variables and those set in the script) are evaluated.
As a result, you must enclose the quotation marks for the service name with \ so that these characters are not interpreted by the shell as the end and beginning of a string (and thus removed from the output):
For Windows hosts, such a script will look very similar to this:
@echo off
echo 0 "My 1st service" - This static service is always OK
Both scripts produce the same result in the output:
0 "My 1st service" - This static service is always OKFor Checkmk only this output is relevant, not how you created this output.
By the way — you can write any number of outputs in a script. Each output line will have its own service created in Checkmk. Therefore, no newline characters are allowed in the output — unless they are masked, for example for a multi-line output in Checkmk.
How it can be checked whether the local script will be correctly invoked by the agent can be seen in the Error analysis.
If the Nagios core is used (always in the Checkmk Community), the following special characters are not permitted in the service name:
|
2.2. Distributing the script
Once the script has been written it can be distributed to the appropriate hosts. The path used will depend on the operating system. A list of path names can be found in Files and directories below.
Don’t forget to make the script executable on Unix-like systems. The path shown in this example is for Linux (agent package with default settings):
If you use the Agent Bakery, the script can be distributed with a rule-based procedure. More on rule-creation can be found in the chapter Distribution via the Agent Bakery.
2.3. Adding the service to the monitoring
At every invocation of the Checkmk agent the local check contained in the script will also be executed and appended to the agent’s output. The service discovery also functions automatically like with other services:
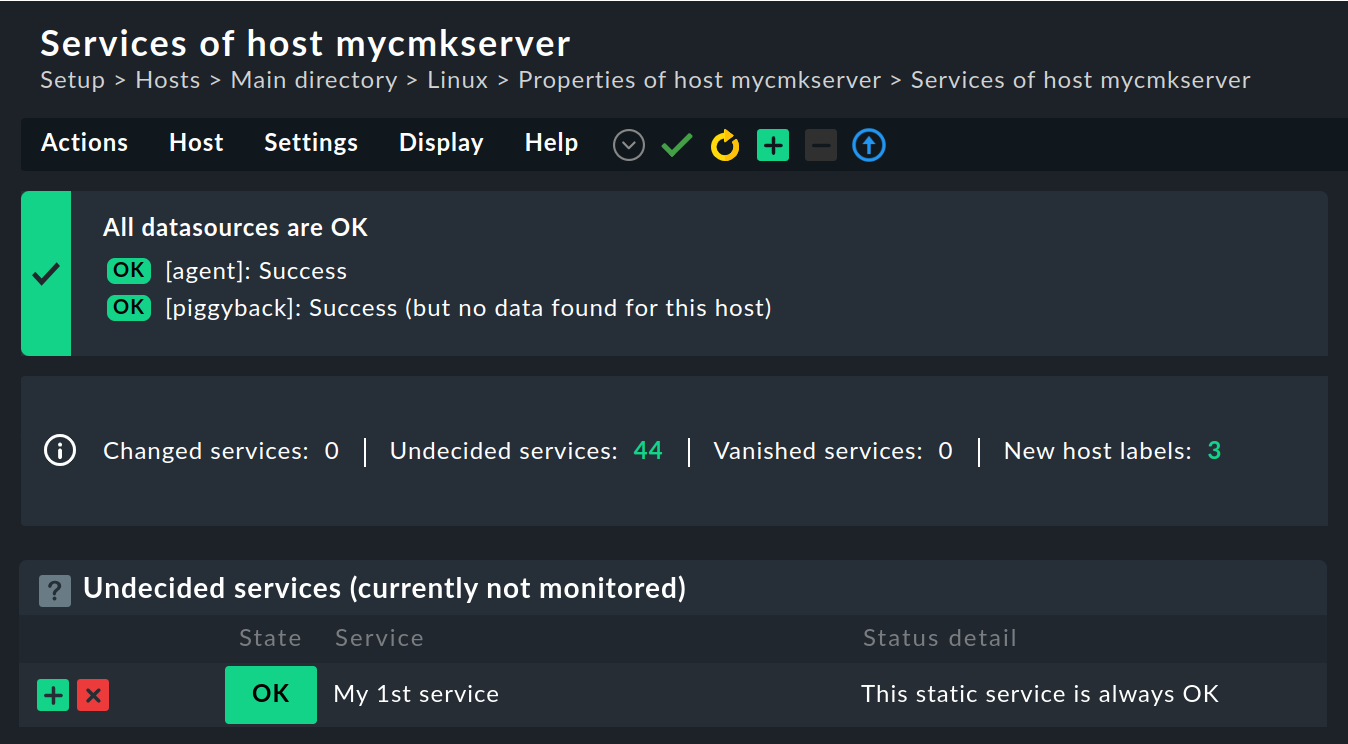
Once the service has been added to the monitoring and the changes have been activated, the implementation of the self-created service with the aid of a local check will be complete. Should a problem arise during the service discovery, the Error analysis can be of help.
3. Metrics
3.1. Defining metrics
You can also define metrics in a local check. The shortest possible syntax for metrics data is:
metricname=valuewhere value is the current value.
The full syntax for metric data is:
metricname=value;warn;crit;min;maxHere, warn and crit define the (upper) threshold values.
In order for these threshold values to be displayed in the graph, dynamic calculation must be activated (state P).
The state is then calculated using Checkmk.
The last parameters specified for min and max fix the value range.
A complete example could therefore look like this:
count=73;80;90;0;100The values are separated by semicolons.
If a value is not required, the field remains empty or is omitted at the end, as in the following for warn, crit and max:
count=42;;;0In the commercial editions
the values for |
3.2. Names and units used by metrics
Metric definitions for local checks are no different from metric definitions for other types of checks. Ultimately, you have three options for assigning units and easy-to-understand names to metrics:
You access existing metric definitions that 'fit' the required purpose.
You create your own metrics ad-hoc and uniquely — this is often sufficient for pure counters.
You create your own metrics and store a metric definition — this gives you the greatest flexibility.
Using existing metric definitions
The easiest way to get suitable units, an automatically adjusted legend and often a Perf-O-Meter is to use existing metric definitions.
In this article, some examples use the identifiers humidity or temperature.
Predefined metric definitions exist for both (humidity and temperature), which provide the metrics with the correct units.
In both cases, the metric definition provides a Perf-O-Meter and the legends of the graphs then show degrees Celsius and relative humidity in percent.
The most important supplied metric definitions can be found in ~/lib/python3/cmk/plugins/collection/graphing (GitHub), others at ~/lib/python3/cmk/plugins/*/graphing (GitHub) and the units used in ~/lib/python3/cmk/gui/plugins/metrics/unit.py (GitHub).
The search for exactly matching metric definitions is often worthwhile, as Checkmk also provides combined graphs for related metrics.
Defining metrics ad-hoc
In the first examples shown in this article for the metrics we used names such as myvalue, count or metricname.
Without a suitable metric definition, these are given an initial capital letter in the legend of the graph and underscores are replaced by spaces.
Thus, outgoing_queue_size becomes the easily readable Outgoing queue size.
Since a pure counter does not require a unit, the sensibly selected identifier already fulfills its purpose here without the need for an additional metric definition.
If units are actually required, you may need to include them in the name.
It becomes problematic if the attempt to define a metric ad-hoc inadvertently has the effect explained in the last section and assigns an existing metric definition.
Maximum confusion can occur especially when units do not match, for example, a supplied metric uses a percentage scale with floating point numbers between 0 and 100 %, but the value range of your local check provides an open-ended number as a fixed point number.
Or you have a queue for current requests (Current requests queue), which you simply want to call current - the result would be the assignment of the metric definition for amperage.
So, current_requests_queue would be a much better choice here.
You can be completely safe with an additional prefix — for example: mycompany_current_requests_queue.
Writing your own metric definitions
If you have special requirements, for example you need graphs with a legend and a Perf-O-Meter, you will need your own metric definitions. Read the chapter on metrics in the article on programming agent-based check plug-ins
3.3. Multiple metrics
You can also output multiple metrics.
In the definitions these are separated by the 'pipe' character (|), for example like this:
count1=42|count2=23On Windows hosts you must prefix these pipes in the script with a circumflex (^) so that these pipes also appear in the output:
@echo off
echo 0 "My 2nd service" count1=42^|count2=23 A service with 2 graphs
A complete output with two metrics will then look something like this:
Once you have also added the new service to the monitoring, in the service list you will see the text for the state detail in the Summary field. Clicking on the service will display the page with its service details. The metrics are shown in the Details field, and below that you will see the service graphs that are automatically generated by Checkmk:
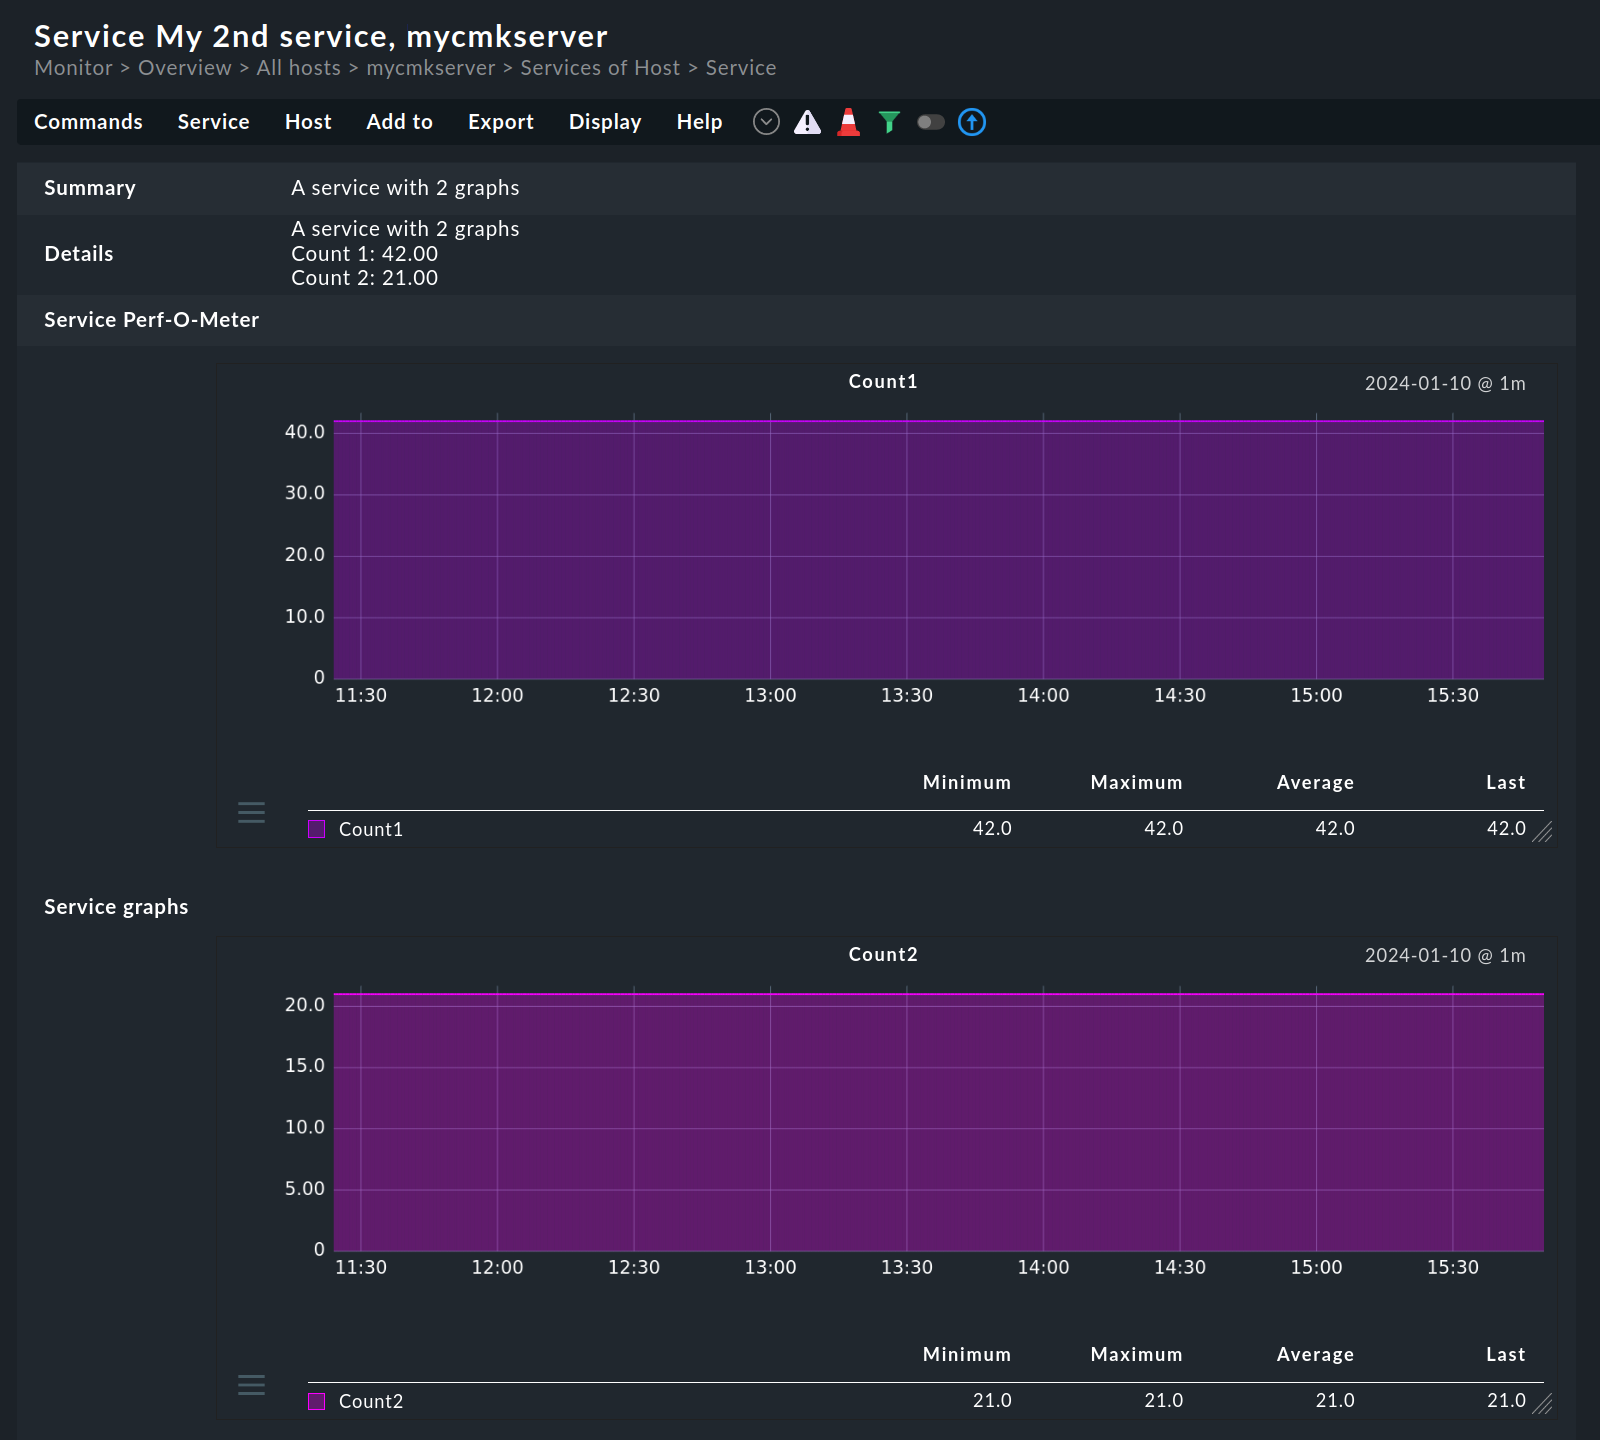
This example uses an evaluation on the host ( |
3.4. Dynamically calculating the state
In the previous sections, you learned how to provide values for metrics and use these to generate graphs. The logical next step is now to use additionally passed threshold values for a dynamic calculation of the service state. This is exactly what Checkmk enables in order to make the preparation of the data received consistent with many of the states generated via plug-ins.
If in the first field of the output, which determines the state, you pass the letter P instead of a number, the service state will be calculated based on the threshold values that are passed.
In addition to the actual value, the transferred threshold values are then also displayed as a yellow and red line in the graph.
This dynamic calculation does not mean that any threshold values can be modified via the monitoring rules defined in Checkmk. The threshold values supplied in the local check are always used for the actual calculation. |
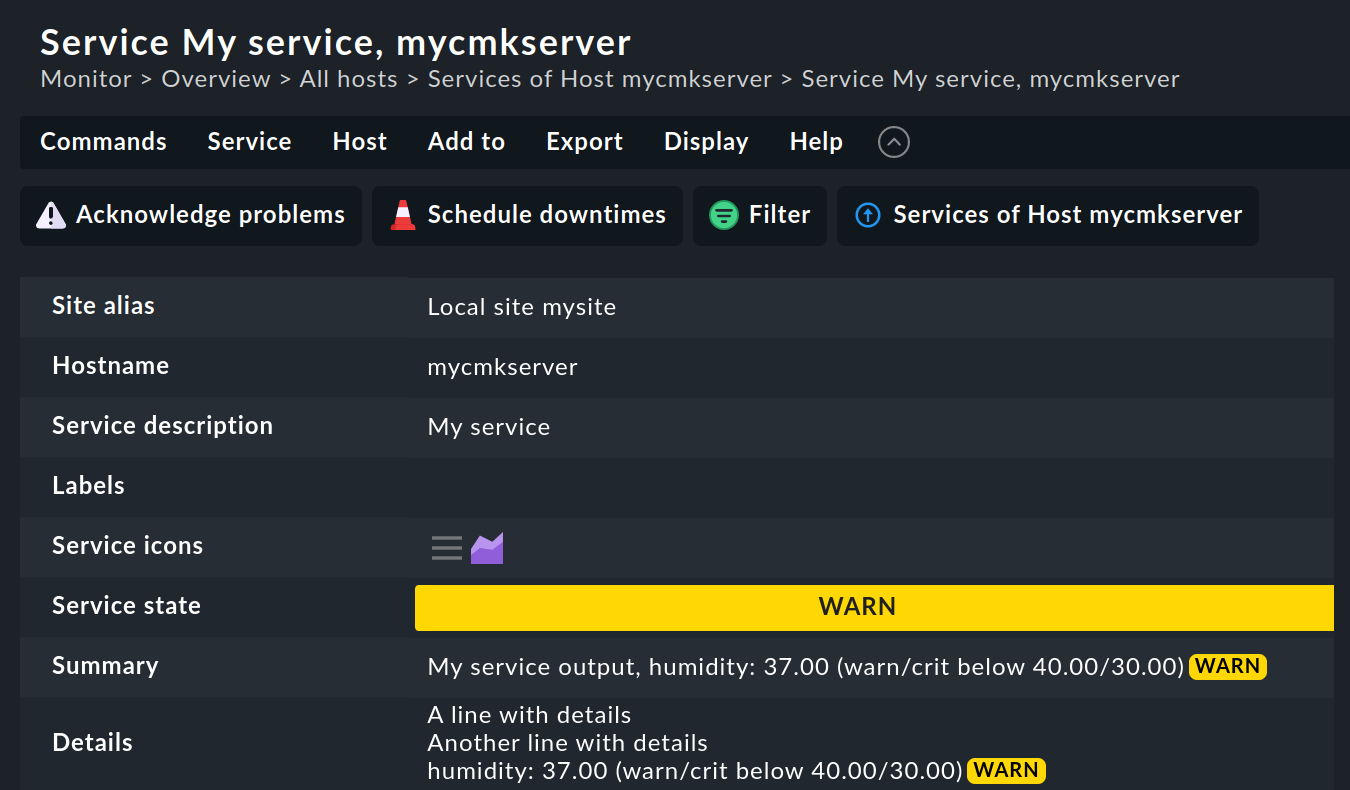
The output would then look like this:
… and the display in a service view like this:
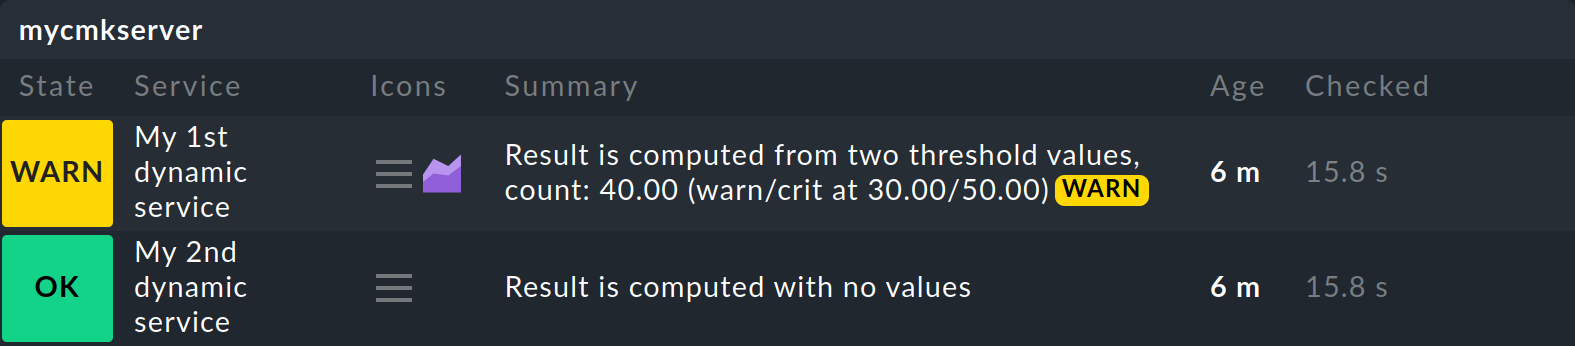
This display differs from the previous one in two respects:
For services in the WARN or CRIT state, the Summary of the service shows all of the important information of the metrics (name, value, thresholds). This means you can always see how this state was calculated from a value. For all other states, the metrics information is only displayed in the Details field.
If no metrics are transferred, the service state will always be OK.
Alternating between dynamic and static state evaluation
It can be useful to switch between dynamic and static state evaluation in the script that provides the local check.
As an example, let’s take a backup script that writes a spool file in the format of a local check.
The state evaluation according to backup duration should be dynamic, and the script should therefore write a P:
P "Backup stuff" duration=2342;1800;3600 Successfully created the backup. Good luck restoring.However, if the backup fails after a short time, the state is determined by the backup script’s return value and not by threshold values. In this case, the script must set the state statically with a number:
2 "Backup stuff" duration=123;1800;3600 Backup failed. Nuff said.In this case, it simply makes sense that no threshold values are displayed in the graph, since it is not a question of the required duration up to the (failed) backup, but the fact that the backup was not successful.
3.5. Upper and lower threshold values
Some parameters not only have upper thresholds, but also lower thresholds. One example of this is humidity recording. For such cases, the local check provides the option of passing two threshold values each for the WARN and CRIT states. These are separated by a colon and represent the lower and upper threshold values respectively.
In the general syntax it looks like this:
metricname=value;warn_lower:warn_upper;crit_lower:crit_upper… in the example like this:
… and in the display of a service view like this:
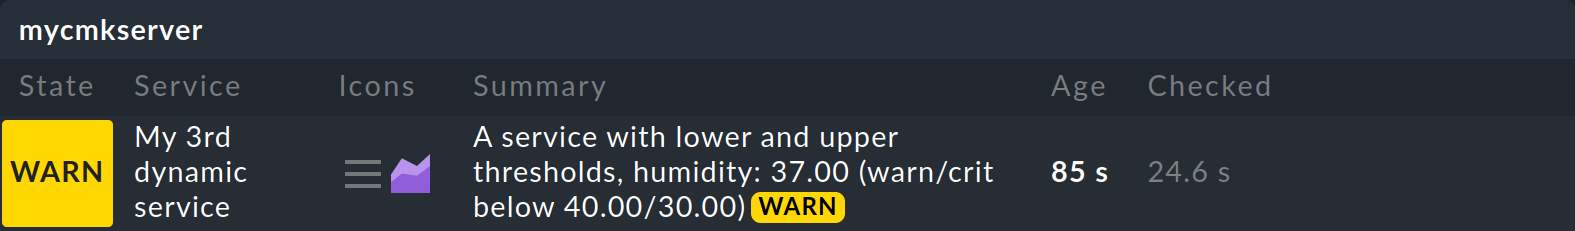
If you are only interested in lower threshold values, omit the fields for the upper threshold values:
With this output, you specify that the service should become WARN if the value is less than 40 and CRIT if it is less than 30: the service will therefore receive the WARN state if the specified value is 37.
The metrics and graphing system in Checkmk is restricted to upper thresholds due to considerations in favor of simplicity. This means that while determining the state of a service works as expected, the information displayed in the metrics and graphing component ignores lower thresholds. For this reason elements such as yellow and red lines in graphs, Perf-O-Meters and Service performance data are completely missing in the Checkmk GUI when only lower thresholds are used. |
3.6. Multi-line outputs
The option to spread an output over multiple lines is also available.
Because Checkmk runs under Linux you can work with the Escape sequence '\n' in order to force a line-break.
Even if due to the scripting language the backslash itself needs to be escaped, it will be correctly interpreted by Checkmk:
In the service’s details these additional lines will be visible under the Summary:
4. Executing asynchronously
The output of local checks, like that of agent plug-ins, can be cached. This can be necessary if a script has a longer processing time. Such a script is then executed asynchronously and only in a defined time interval and the last output is cached. If the agent is queried again before the time expires, it uses this cache for the local check and returns it in the agent output.
Caching is only available for AIX, FreeBSD, Linux, OpenWrt and Windows. On other platforms, use cronjobs in combination with the spool directory. |
4.1. Configuring Linux
Under Linux or another Unix-like operating system, any plug-in can be executed asynchronously. For a local check, the necessary configuration is very similar to that of a plug-in. To do this, create a subdirectory called the number of seconds you want the output to be cached and put your script in that subdirectory.
In the following example, the local check will be executed only every 10 minutes (600 seconds):
The cached data is written to a cache directory.
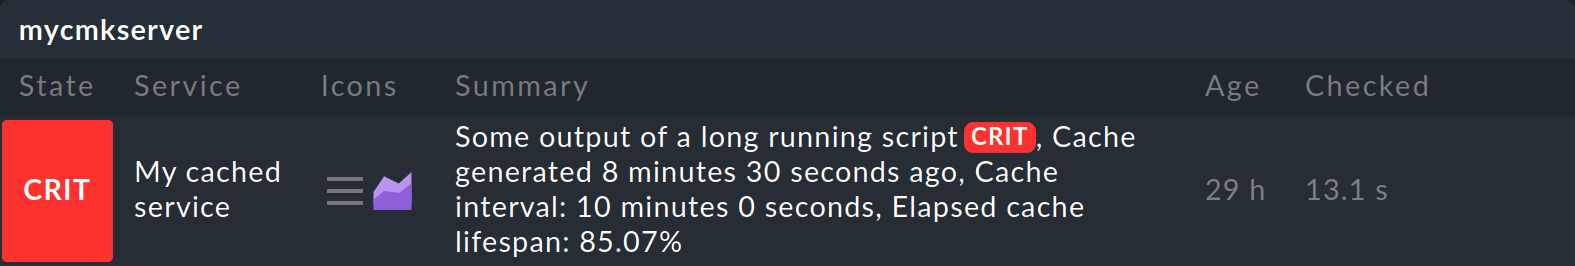
For a service that provides cached data, the cache-specific information is added to the service view:
4.2. Configuring Windows
Under Windows, the configuration is also analogous to that of a agent plug-in. Instead of using a special subdirectory as with Linux & Co, the options are set in a configuration file:
As you can see above, under Windows you can configure the asynchronous execution (with async) and the time interval (with cache_age) separately.
Alternatively, on Windows you can also do the configuration in the Agent Bakery.
5. Distribution via the Agent Bakery
![]() If you are already using the Agent Bakery in the commercial editions, you can also distribute the scripts with local checks to several hosts this way.
If you are already using the Agent Bakery in the commercial editions, you can also distribute the scripts with local checks to several hosts this way.
To do this, first create the directory custom on the Checkmk server as site user below ~/local/share/check_mk/agents/ and in it a subdirectory tree for each package of local checks:
The package directory in the above example is mycustompackage.
Below that, the lib directory flags the script as a plug-in or as a local check.
The subsequent local directory then allocates the file explicitly.
Place the script with the local check in this directory.
On Linux, you can configure asynchronous execution analogously as described in the previous chapter by now creating a directory under |
In the configuration environment of Checkmk, the package directory mycustompackage will be shown as a new option:
Open Setup > Agents > Windows, Linux, Solaris, AIX, create a new rule with Agents > Agent rules > Generic agent options > Deploy custom files with agent and select the newly-created package:
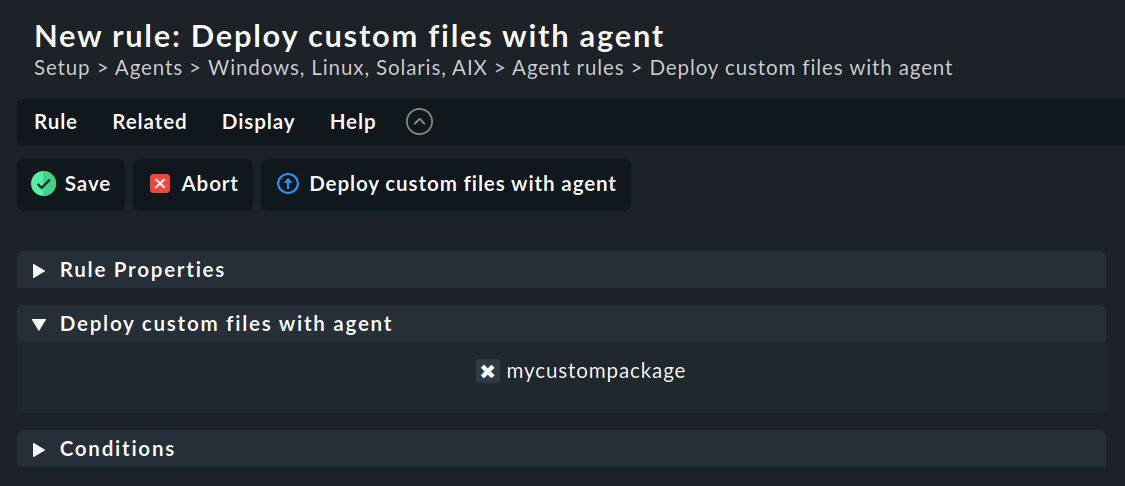
Checkmk will then autonomously integrate the local check correctly into the installation packet for the appropriate operating system. After the changes have been activated and the agent baked, the configuration will be complete. Now the agents only need to be distributed.
6. Error analysis
6.1. Testing the script
If you run into problems with a self-written script, you should check the following potential error sources:
Is the script in its correct directory?
Is the script executable, and are the access permissions correct? This is especially relevant if you are not running the agent or script under root or the LocalSystem account.
-
Is the output compliant with the given syntax? The output of the local check must conform to the syntax as described in the chapters Creating the script and Metrics. Otherwise, error-free execution cannot be guaranteed.
Problems and errors can arise in particular when a local check is intended to perform a task that requires a full-fledged check plug-in, for example when the output of the local check itself contains a section header or the definition of a host name as used when transporting piggyback data.
Under Linux, when the agent script or the plug-in is called directly in a shell, different environment variables may be available than when called by the Agent Controller of the Checkmk agent. Under Windows, the Agent Controller also runs under the LocalSystem account, but the call in the terminal is made under a normal user or administrator. In addition to the different environment, this can mean that permissions are missing. In order to be able to analyze the output from the agent script as closely as possible to the conditions under which the Checkmk agent is called, you should use the Agent Controller in dump mode if possible. |
6.2. Testing agent output on the target host
If the script itself is correct, the agent can be run on the host.
With Unix-like operating systems such as Linux, BSD, etc., the command below is available.
With the -A option the number of additional lines to be displayed following a hit can be specified.
This number can be customized to suit the number of expected output lines:
In the last line, you can recognize a cached service by the preceding cached information with the current Unix time and the execution interval in seconds.
Under Windows, you can achieve a very similar result with PowerShell and the Select-String Cmdlet as with the grep command under Linux.
In the following command, the two digits behind the Context parameter determine how many lines are to be output before and after the hit:
Depending on the environment, programming language used, Windows version and some other conditions, you are often confronted with the UTF-16 character set under Windows. In addition, the combination of Carriage Return and Line Feed for line breaks is frequently encountered there. However, Checkmk as a Linux application expects UTF-8 and simple Line Feeds without any ifs and buts. Our article on the spool directory includes a chapter explaining the troubleshooting of character set-related problems. |
6.3. Testing agent output on the Checkmk server
As a last step the processing of the script output can also be tested on the Checkmk server with the cmk command — once for the service discovery:
… and also the processing of the service output with a similar command:
For both commands we have shortened the output by lines not relevant for this topic.
Alternatively, you can open the service list of the host in the monitoring, navigate to the service Check_MK and its column Icons. There you can choose the menu entry Download agent output to retrieve a text file containing the complete agent output.
If there are errors in a local check, Checkmk will identify them in the service output. This applies as well for erroneous metrics, for false or incomplete information in the script output, or an invalid state. These error messages should aid in quickly identifying errors in a script.
7. Files and directories
All specified paths refer to installation packages that have been packaged with standard configurations. If you have installed a non-packed agent script or have adapted the installation directories using a Bakery rule, look up the paths in the script itself or adapt the paths to your own configuration.
7.1. Script directory on the target host
You store local checks in these directories. Local checks can be any executable files.
| Path | Operating system |
|---|---|
|
AIX, Linux and Solaris |
|
Windows |
7.2. Cache directory on the target host
Cached data of individual sections, including the local section, are stored here and reattached to the agent with each execution as long as the data is valid.
| Path | Operating system |
|---|---|
|
AIX, Linux and Solaris |