1. Introduction
For checks that measure performance values, it is often difficult to set the correct thresholds.
While too low values create WARN or CRIT states that only supposedly indicate problems, setting them too high leaves them in OK state, resulting in the monitoring being blind to problems.
Take the CPU load service on a Linux host (or similarly, Processor Queue on a Windows host) as an example: You may have a server that is idle most of the time, but regularly for a few short periods of time every day except Saturdays and Sundays, from about 0:00 to 7:00 in the morning, some large backup jobs run on this server. During this time, a CPU usage of 10 (with 20 cores) is completely normal. During the rest of the time even a load of 3 could be suspiciously high.
In Checkmk you have several possibilities for implementing this example. One of these is to first define the time ranges with the various workloads and then set specific threshold values for these times. In our example, this means first defining a new time period for the time with high load (Monday through Friday from 0:00 to 7:00). Then you can specify a rule for the (CPU load or Processor Queue) service. Select this new time period, and set different (higher) threshold values for it.
Using a time period has the advantage that it is always easy to understand why a WARN/CRIT state occurred at a certain time. However, the manual linking of threshold values to time periods is also somewhat inflexible and sometimes simply far too complicated.
If you are using one of the commercial editions, there is another way to solve this problem.
It is called predictive monitoring, and this involves evaluating the data to derive a prediction of how they will behave in the future.
Once set up, the prediction does not remain static, but adapts itself to the changing reality over time: Today’s forecast for the day after tomorrow will not remain unchanged, because the real values from tomorrow will have been included for the day after tomorrow. Without going time traveling (exhausting!), the process can also be expressed in this way: Checkmk learns continuously. Since the threshold values for the WARN/CRIT states are always set relative to the prediction values, the threshold values also learn along with the prediction.
2. Implementing predictive monitoring
2.1. From plug-in name to prediction parameter
A whole range of Checkmk plug-ins support predictive monitoring. In the following you will find some important examples:
The settings for predictive monitoring can be found in the same place where you otherwise set thresholds for a service. There you will find the selection Predictive levels (only on CMC), if the check concerned supports this.
2.2. Creating a rule for predictive monitoring
For the CPU load service on the Linux host in our example, you can create a new rule with the CPU load (not utilization!) rule set under Service monitoring rules, which you can find most quickly by searching the Setup menu.
In the Value section you will find parameters on the service level for which you can select the Predictive levels (only on CMC) value:

2.3. Selecting past reference values
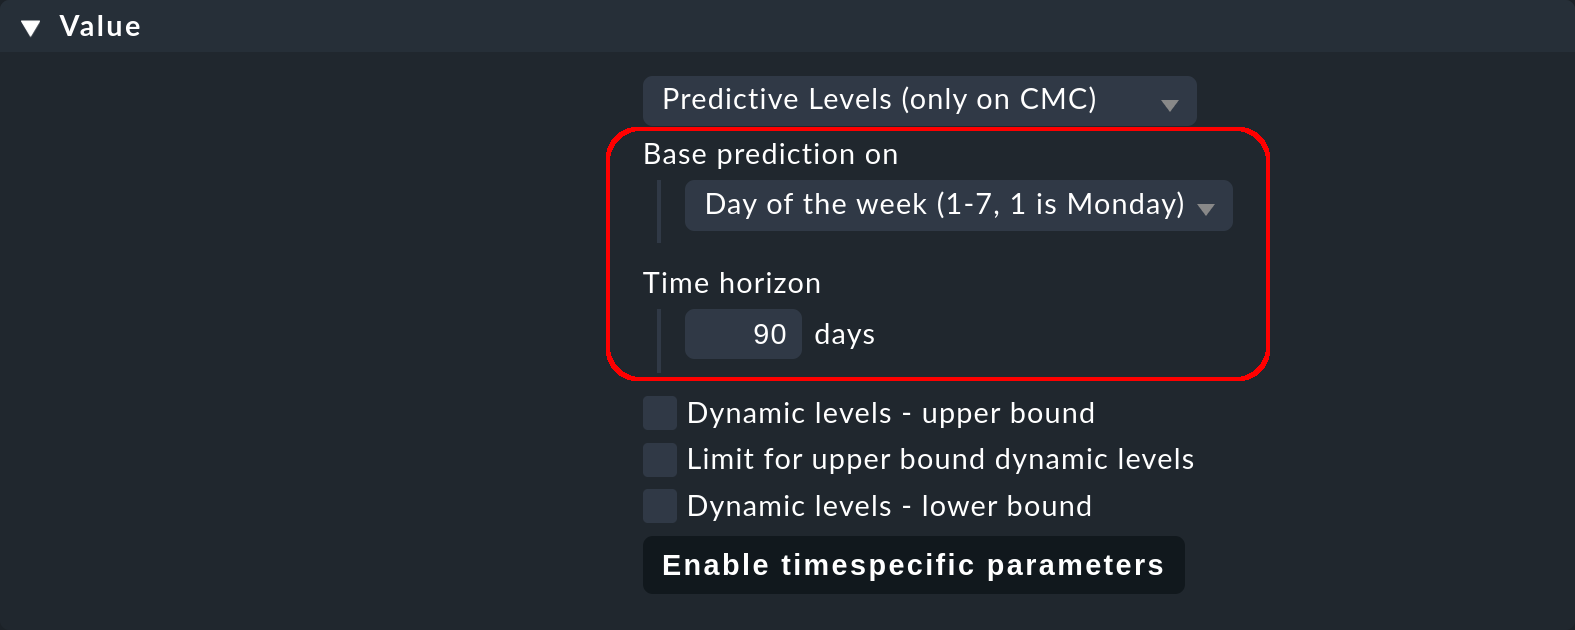
After selecting Predictive levels (only on CMC) the parameters are displayed, of which we will first introduce the first two in more detail:

With Base prediction on you define the periodicity in which the repetition of the measured data is expected (monthly, weekly, daily or hourly):
Day of the month: The measured values from each day in the month are compared with each other, i.e. the 1st, 2nd, 3rd, etc. of each month.
Day of the week: The comparison is based on the days of the week, i.e. a different prediction is made for each day of the week (Monday, Tuesday, Wednesday, etc.). This is usually the correct setting.
Hour of the day: The individual hours for each day are compared, i.e. the prediction is repeated daily.
Minute of the hour: The comparison on a per minute basis and the hourly repetition are usually only useful for testing a prediction.
In the next parameter Time horizon you enter up to how many days in the past Checkmk should evaluate the measurement data. Checkmk accesses the historical data stored in RRD files. Although the measurement data in the RRD files is stored for 4 years, it makes no sense to go back too far in the past. For one thing, the typical values of the recent past may differ from those of the more distant past.
On the other hand, the further back in time you look, the less measurement data per unit of time there is for comparison. This is because by default Checkmk compresses the measurement data available from each minute in the RRD files in three phases to save space: after 2, 10, and after 90 days. Compression means that the minimum, maximum and average are calculated from multiple measurement data and these calculated data replace the originally measured data. If the measured data from the last two days are available in the full resolution of 1 minute, the resolution is 5 minutes after 2 days, 30 minutes after 10 days and 6 hours after 90 days. If Checkmk accesses historical data for predictive monitoring, the maximum of the three stored values is always taken.
For our example server with the high workload on Monday to Friday nights it is advisable to select the weekly reference period and a reference time range of (maximum) 90 days. 90 days is an acceptable compromise, since on the one hand this range contains enough comparison days, while on the other hand the measurement data is still available with a resolution of 30 minutes — provided that the default values have not been changed.
Select as Base prediction on the entry Day of the week and enter as Time horizon 90 as shown by the image above.
By setting the weekly reference period for a 90-day range in the past Checkmk has the necessary information for calculating the reference curve. This involves evaluating each Monday in the time period (for 90 days there are 12 Mondays), comparing the measured value from each Monday with the measured values from the other Mondays at the same time, and calculating the average. After Monday, Checkmk handles the other weekdays Tuesday to Sunday in the same way. The so-calculated reference curve for the past is then updated and thus becomes the projected reference curve for the future.
The values used to calculate the average for the reference period may themselves already have been calculated (i.e. not measured) values — depending on the resolution of the historical data in the RRD files. |
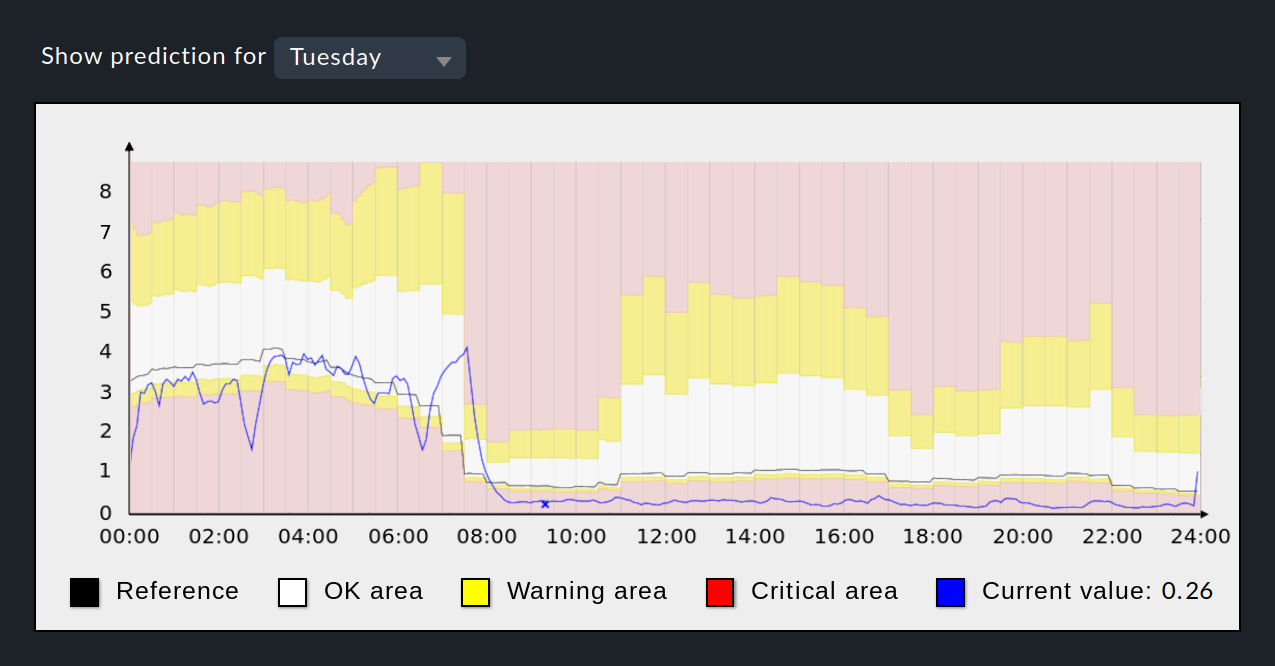
The reference curve calculated by Checkmk on the basis of the two parameters defined so far (reference period and reference time range) is drawn as a black line in the following image:

As a preview, this image shows the prediction graph, which you can display after the setup is completed. Apart from the black reference curve, the current values are displayed as a blue line — if they are available in the displayed time range.
What is missing to complete the setup are the definitions of the threshold values for the states WARN and CRIT, which are marked in the graph with yellow and red background colors. The following section deals with the definition of these thresholds.
2.4. Defining thresholds for the prediction
You define the threshold values for WARN and CRIT depending on the predicted values shown in the reference curve.

To illustrate the effect of the different parameter values used to define the thresholds, let us take a close look at a single value on the reference curve. We will assume that the predicted value of the service CPU load is 10 at 3:30 am on Fridays.
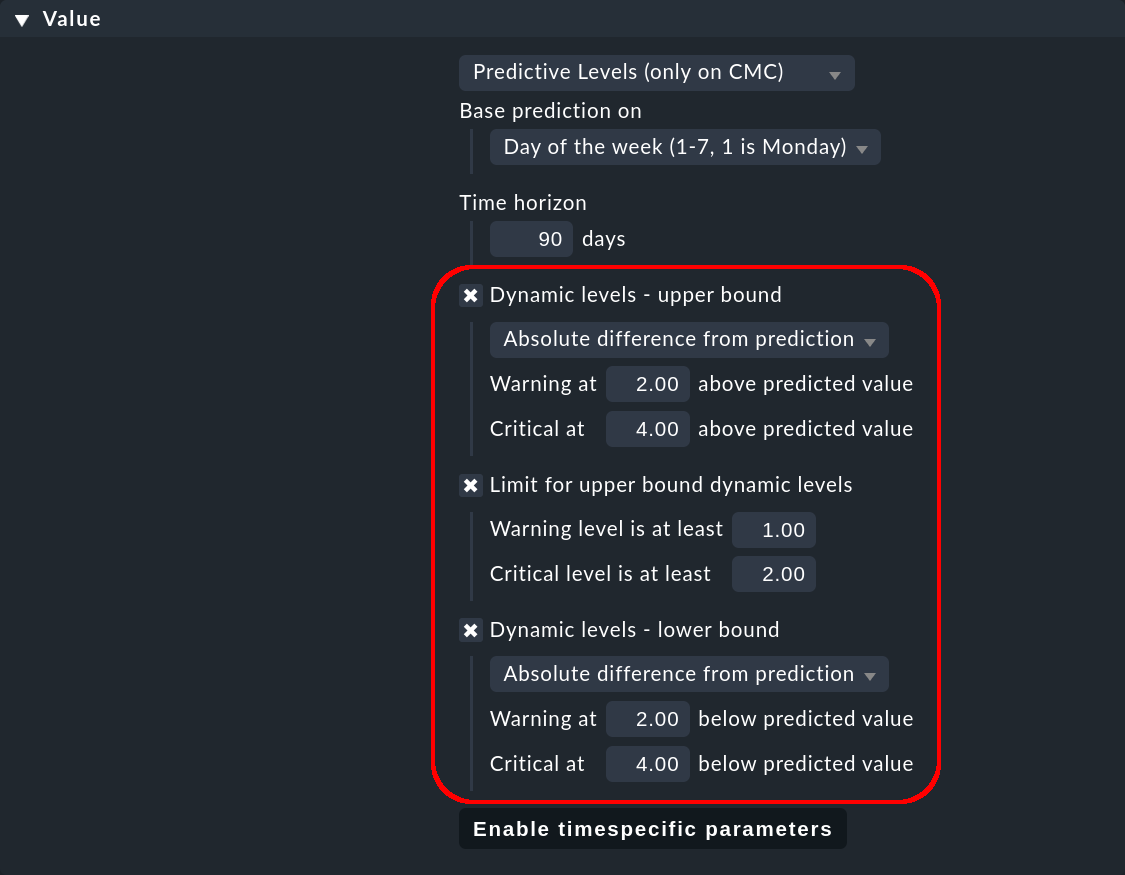
For the upper thresholds there is the parameter Dynamic levels — upper bound, and for the lower thresholds Dynamic levels — lower bound. For both parameters you have three choices, which are described in the following three sections.
Absolute difference from prediction
With this value the thresholds are calculated by increasing or decreasing the predicted value by a fixed absolute value.
Example: Warning at 2.0 will cause a warning to be displayed if the value is above 12 and below 8.
Relative difference from prediction
With this value the thresholds are calculated by increasing or decreasing the predicted value by a percentage.
Example: Warning at 10.0 % will cause a warning to be displayed if the value is above 11 and below 9.
In relation to standard deviation
With this value the thresholds are calculated by increasing or decreasing the predicted value by a multiple of the standard deviation. The standard deviation indicates how much the values differ in a reference period (e.g. on Fridays at 3:30 am).
With this option the calculation of the threshold values is not so easy to predict, because Checkmk calculates the standard deviation internally from all measured values of the reference period. To illustrate the effect, we need more information about the 12 measurements of the reference period on Fridays at 3:30 am: We assume that 10 measurements are equal to 10, one is 11 and one is 9. The 12 measurements therefore have an average value of 10 (which corresponds to the predicted value), a variance of about 0.167 and a standard deviation of about 0.41. (We will save the calculation details here, but you can refer to various statistics pages on the internet.)
Example: Warning at 1.0 as a multiple of the standard deviation will result in a warning being displayed if the value is above 10.41 and below 9.59.
To avoid unwanted WARN/CRIT states, no thresholds are applied if the standard deviation is undefined (e.g. because there is only one measured value in the reference period) or is zero (if all measured values are identical).
In general, the following rule applies: the more consistent the values of the past are, the smaller the standard deviation is and the more strict the prediction is. This option is therefore useful for defining thresholds more narrowly for a reference period with stable, uniform values.
Minimum upper threshold values
Finally, with Limit for upper bound dynamic levels you have the possibility of setting absolute minimum values for the upper threshold values. This allows you to prevent unwanted WARN/CRIT states for times when the predicted values are very low.
Example: A Warning level of 2.0 will cause a warning to be displayed only if the value is above 2, even if the upper threshold for a warning is 1.5.
Prediction graph with threshold values
The effects described as an example for one value are calculated by Checkmk for all values on the reference curve. You can see the result in the prediction graph, which will be described in more detail in the next chapter. The graph shows the curves for the upper and lower threshold values above and below the reference curve. The areas for WARN are colored in yellow and for CRIT in red.
You should check the ranges for WARN and CRIT carefully in the prediction graph, especially if you have the thresholds calculated from the standard deviation, as the values underlying the standard deviation cannot be read directly from the Checkmk user interface. By checking and, if necessary, adjusting the levels, you can prevent the service from unintentionally having the states WARN or CRIT too often.
This completes the implementation of predictive monitoring. In the next chapter you will learn how the setup can be observed in the monitoring, and how you can display the prediction graph.
3. Analyzing the prognoses
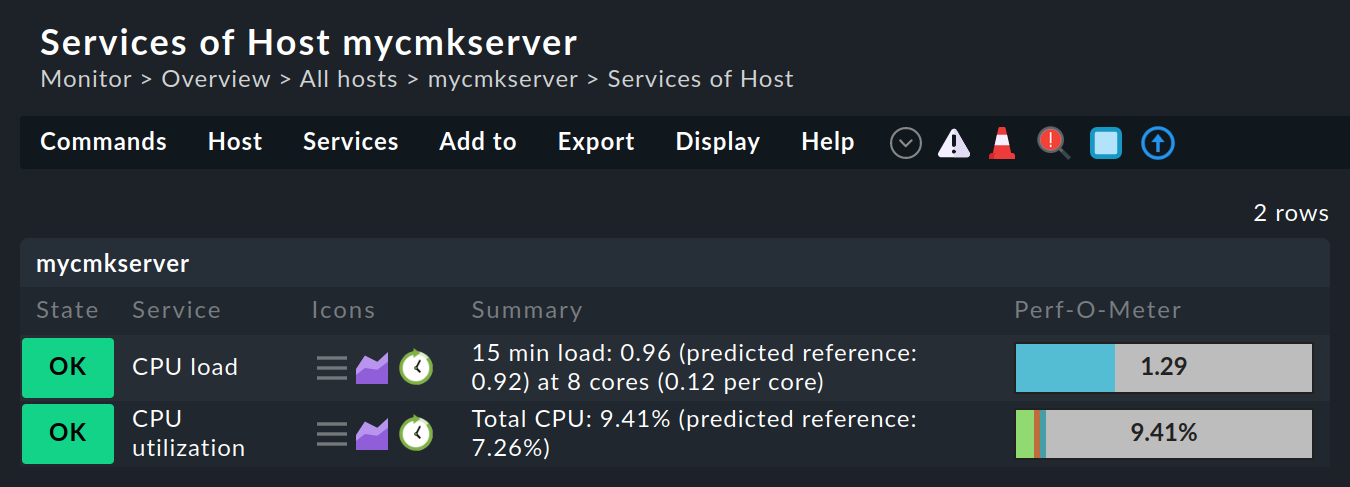
If you have set up prediction-based monitoring for a service, activate the changes, and once Checkmk has performed a check for this service, the new icon ![]() will appear in the service list:
will appear in the service list:

Especially following the initial setup for a service, this icon may be missing because not enough data is available for the configured prediction.
In this case, a message of the type |
Click ![]() in the service list and a graphic representation of the current prediction time range — prediction graph — will be displayed:
in the service list and a graphic representation of the current prediction time range — prediction graph — will be displayed:

In the prediction graph you will see the reference curve as a black line, the current values as a blue line, and the ranges for the OK states in white, for WARN in yellow, and for CRIT with a red background color.
The time range displayed is based on the selected reference period. For example, if you have a weekly period, you can view the individual days of the week and use the drop-down list above the graph to switch to another day. With the special Everyday list entry the graph will show you the average values for all days from which data are available.
In the example graph, the high capacity utilization at night and the low capacity utilization during the day can be seen. From 0:00 to 04:00 hours, the current values (blue line) are lower than the prediction reference curve (black line) — in fact so low that the lower threshold values were being intermittently undercut, triggering WARN/CRIT states. Also visible is the range between 08:30 and 23:30 hours when the blue line is constantly in the lower CRIT range. This state could be avoided in the future by higher values for the lower thresholds.
Finally, the graph shows that the upper thresholds are based on the standard deviation, because between 05:00 and 07:30 the upper thresholds tend to increase while the values in the reference curve decrease. This behavior can only be explained by the standard deviation, since the other two options (absolute and percentage value) would have led to an adjustment of the threshold values in the direction of the reference curve.
As with the initial setup, any change to the predictive monitoring will only become effective following a fresh check of the service.
You do not need to wait for the next regular check, but can trigger one manually from the service list with the |
