1. Introduction
Should you ever be confronted with problems in Checkmk that you — with the help of this User Guide — cannot solve by yourself, the official Checkmk support and the Checkmk forum are available which provide two excellent contact points. For both a precise description of the error or problem is naturally essential. In addition, certain specific information about your Checkmk environment is mandatory for a quick analysis and solution. The most essential information is of course the version and the edition of Checkmk that you are using. Depending on the situation, however, considerably more information may be required to be able to get to the bottom of your problem. In the past Checkmk support told you what information you needed to provide them with.
Instead of the support providing you with a 'wish list', and thus sending you on a scavenger hunt through the various components of Checkmk, with just a few clicks in the graphical user interface you can create a tailor-made package of information — referred to as the dump in this article. Here you decide for yourself whether you want to include configuration files that may possibly contain confidential information — or not, and if so to specify which ones.
![]() Some of the selectable data is only available in the commercial editions, for example Performance Graphs of Checkmk Server, CMC (Checkmk Microcore) and Licensing information.
Some of the selectable data is only available in the commercial editions, for example Performance Graphs of Checkmk Server, CMC (Checkmk Microcore) and Licensing information.
The information you select here may contain confidential data. Please proceed with caution! |
2. Compile support information
2.1. Select site
After clicking on Setup > Maintenance > Support diagnostics you will see the following tidy screen:
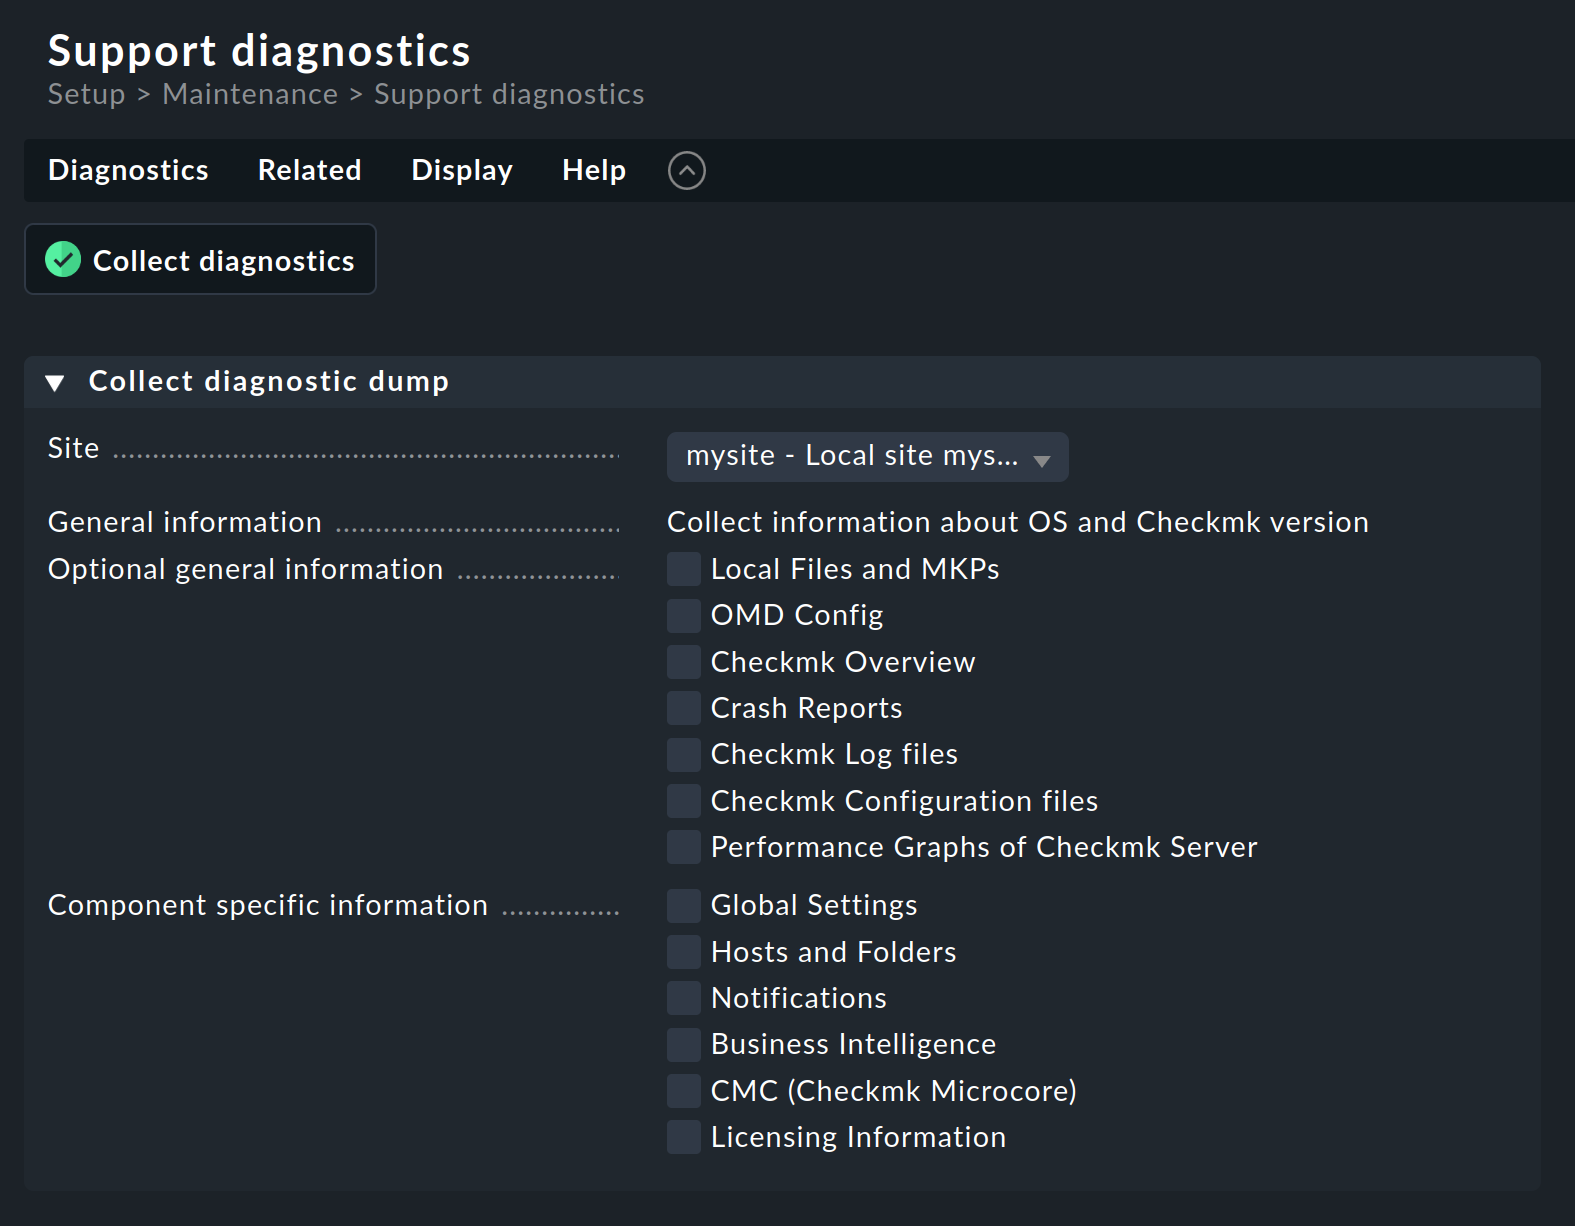
If you are using distributed monitoring, in the first field you can specify the Site from which you want to select the data to be collected.
2.2. General information
Under General information you will basically only find a notice that the information on the Checkmk version and the operating system in use will in any case be included. If you leave it at that — i.e. select none of the options — and start the collection of the data via Collect diagnostics, you will get a file that contains only the following data:
In addition to the general.json file, Checkmk generates further files in this standard setting with performance data such as the number of hosts and services, the hardware of the Checkmk server, the environment variables set in the site, the names and sizes of the files in the site and the Python modules installed there with their versions.
The Background job details page, which is opened after you have clicked Collect diagnostics, shows exactly which data is compiled.
2.3. Optional general information
Under Optional general information you will then find choices which you can compile in advance to suit your question, or which can be or which may be explicitly requested by the support personnel.
If you select Local Files and MKPs here, Checkmk will also create an overview of all files in your site’s ~/local/ directory.
This can sometimes be helpful if your local customizations are incompatible with a recent update of Checkmk.
All installed MKPs are also included here.
With the selection of OMD Config you can add the information on your configuration of OMD to the dump.
These correspond exactly to what you would get on the command line with the omd config show command.
If you check the Checkmk Overview checkbox, general information about all sites running on your Checkmk server will be included. This also creates a list of all installed Checkmk versions. And if the site selected above is the node for a cluster this fact will also be recorded here.
With the Crash Reports option, you can add the latest crash reports from the various categories — e.g. base, check, gui or rest_api — to the dump.
Further information on crash reports can be found in the article on programming agent-based check plug-ins.
In Checkmk you can find the crash reports under Monitor > System > Crash reports.
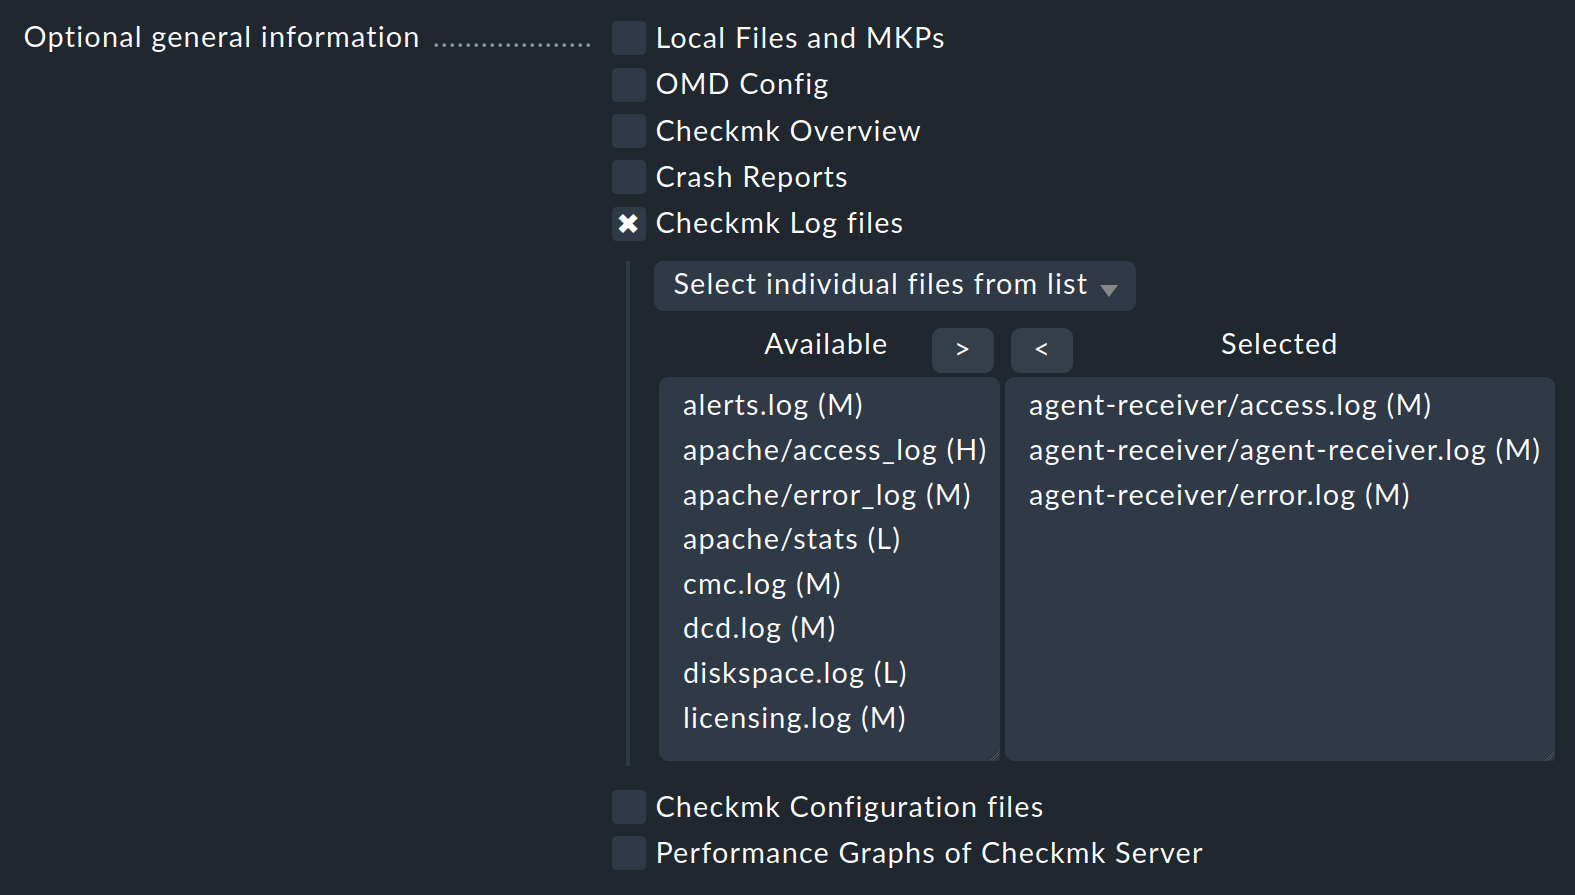
After activating Checkmk Log files or Checkmk Configuration files you have the option of removing any confidential data from this part of the package — via the Pack only Low sensitivity files selection.
All files you can select here come from the ~/var/log/ or ~/etc/checkmk/ directories and their subdirectories.
You can see a detailed list directly below the drop-down menu.
With the Select individual files from list option you even have the option to include only specified files into the dump.
With this option you can also see which files have one of the confidentiality levels High (H), e.g. files with passwords, Medium (M), if they contain addresses or usernames for example, or finally Low (L).
In order to have as much detailed information as possible on the behavior of Checkmk in the log files, it may be necessary to change the log level in Checkmk for a short time.
The corresponding settings can be found via Setup > General > Global settings.
On this page, simply type |
Next, you have the option to add Performance Graphs of Checkmk Server to the dump. Especially in cases of problems with the performance of a Checkmk site these reports are almost always requested — so it is a good idea to include with such problems. The support diagnostics will do the work for you to manually generate a number of reports as PDF files. Among others, the reports from the OMD mysite performance service for the last 25 hours and the last 35 days are generated.
2.4. Component-specific information
The Component specific information section again allows you to decide in a very granular way on which information from your global Checkmk settings, your hosts and folders, and your notification settings should be included in the dump.
Depending on the configuration, the files you select here may contain confidential information, such as passwords. In normal operation, this data is protected by the fact that only the site user and administrators have access to it. If you make this data available to third parties for analysis purposes, you should proceed with great caution. |
In the Global Settings sub-item you will find all global.mk-files of the individual components of your Checkmk site,
such as the Dynamic Configuration Daemon (DCD) or Livestatus Proxy Daemon.
The information that can be selected via the sub-item Hosts and Folders can, among other things, help to find unfavorable rule sets and errors in the host configuration.
In the Notifications section you will find, in addition to the corresponding configuration files, an option for the selection of log files. In case of difficulties with your notifications, you — or ultimately the Checkmk support — can often find the source of the problem in these logs.
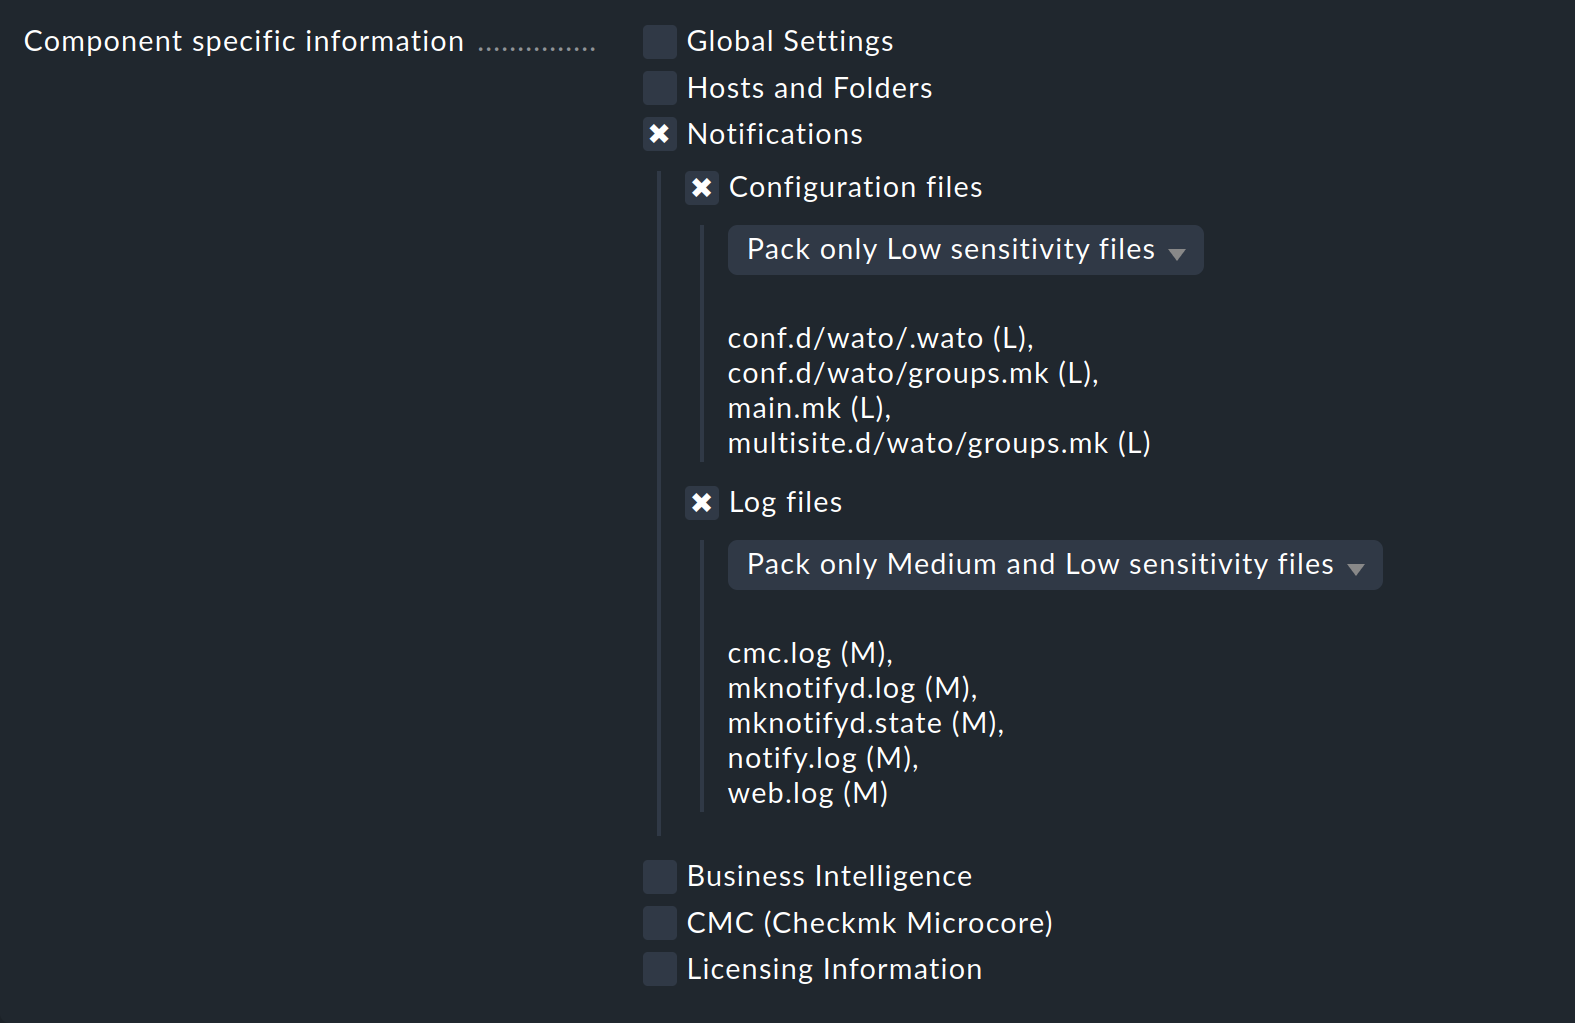
Use the Business Intelligence option to select the configuration files for Business Intelligence. After activating one of the options CMC (Checkmk Microcore) or Licensing information you again have the possibility to remove more or less confidential data from the respective part of the package — via the Pack only Medium and Low sensitivity files or Pack only Low sensitivity files selection.
3. Support diagnostics via the command line
As is often the case in Checkmk, this task can be performed simply from a terminal.
This can be done easily with the cmk command and the --create-diagnostics-dump option.
For all options described above you can append the corresponding parameter to the command.
The following options complete the output from the command:
|
List of all installed, unpackaged, and optional files below |
|
Contents of the |
|
Latest crash report from each subdirectory of |
|
Information from the HW/SW inventory node Software > Applications > Checkmk of the Checkmk server.
For the parameter |
|
Configuration files from the |
|
Log files ( |
|
Performance graphs (e.g. CPU load, CPU utilization) of the Checkmk server — only available in the commercial editions.
For the parameter |
The above, and all other options for the cmk command can as usual be found in the output from cmk --help.
4. Missing information in the dump
4.1. Current agent needed
To be able to output complete information in the support diagnostics, you must ensure that the agent installed on the Checkmk servers has the same version number as the Checkmk server. In particular, information originating from the HW/SW inventory of the Checkmk server may not yet be provided by older versions of the agent.
4.2. Label cmk/check_mk_server:yes
The support diagnostics depend on the Checkmk servers in your environment being labeled accordingly.
If you are missing some data in a dump, check if your Checkmk servers are labeled with the cmk/check_mk_server:yes label.