1. Introduction
1.1. Background and motivation
You may be wondering why you should even integrate Prometheus into Checkmk at all — therefore we would like to make an important note at this point: Our integration of Prometheus is aimed at all of our users who already use Prometheus. By integrating Prometheus into Checkmk, we can close the gap that has opened up here so that you do not have to continuously check two monitoring systems.
This enables you to correlate the data from the two systems, accelerate any error analysis and, at the same time and facilitate communication between Checkmk and Prometheus users. So Checkmk remains as your "single pane of glass".
Finally, context again
As a most pleasant side benefit of this integration, it is likely that your metrics from Prometheus automatically receive a meaningful context thanks to Checkmk. For example, while Prometheus correctly shows you the amount of main memory used, you do not have to take any extra manual steps in Checkmk to find out how much of the total available memory this is. As banal as this example may be, it shows at which points Checkmk makes monitoring easier — even in some of the smallest details.
1.2. Exporter or PromQL
The integration of the most important exporters for Prometheus is provided via a special agent. The following exporters for Prometheus are available:
If we do not support the exporter you need, experienced Prometheus users also have the option of sending self-defined queries to Prometheus directly via Checkmk. This is performed using Prometheus' own query language, PromQL.
2. Setting up the integration
2.1. Creating a host
Since the concept of hosts in Prometheus simply doesn’t exist, first create a place that gathers the desired metrics. This host forms the central point of contact for the special agent, and this then later distributes the delivered data to the correct hosts in Checkmk. To do this, create a new host using Setup > Hosts > Hosts > Add host.

If the specified host name cannot be resolved by the Checkmk server, enter the IP address under which the Prometheus server can be reached.
Make all other settings for your environment and confirm your selection with Save & view folder.
2.2. Creating a rule for Prometheus
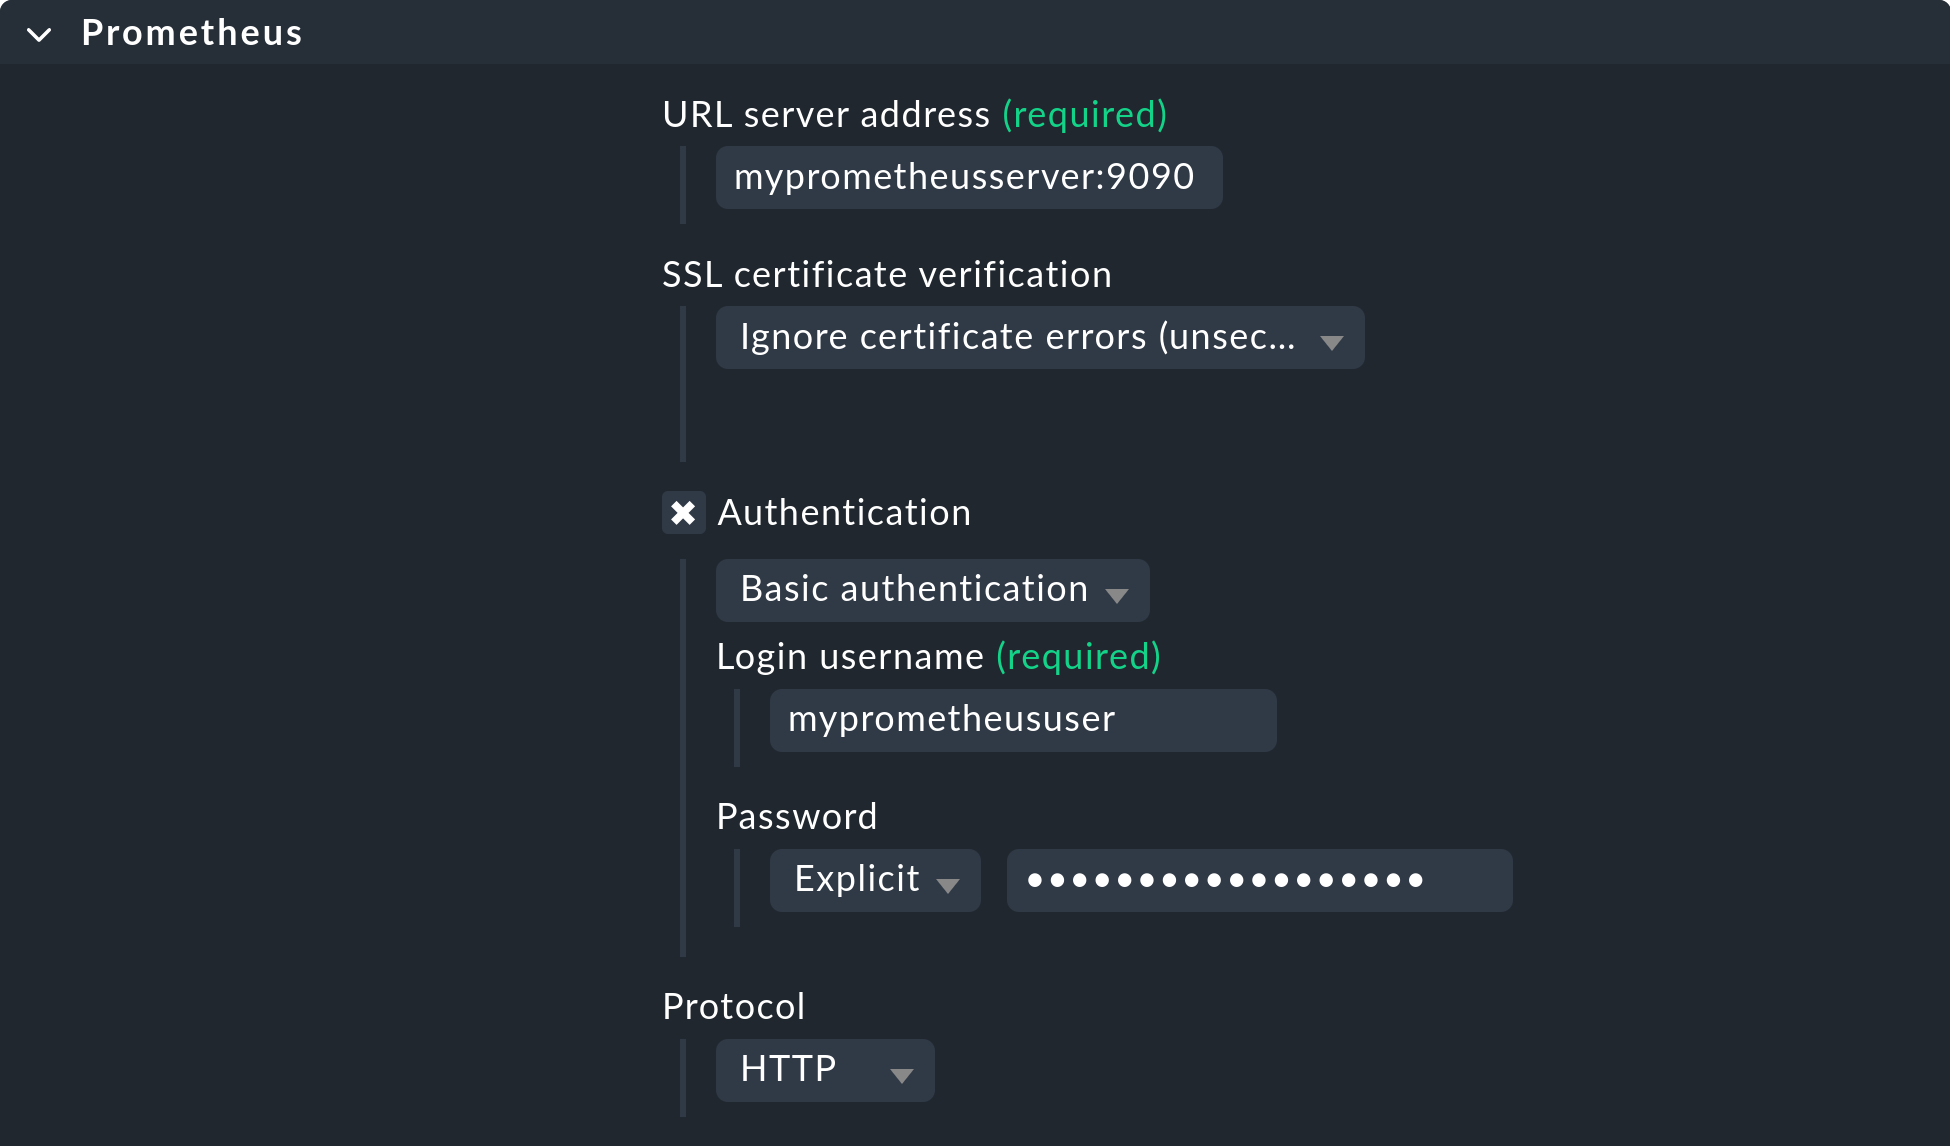
Before Checkmk can find metrics from Prometheus, you must first set up the special agent using the Prometheus rule set. You can find this via Setup > Agents > VM, cloud, container. There are several options for customizing the connection of your Prometheus server’s web frontend, regardless of which exporter you want to use.
URL server address: Specify the URL of your Prometheus server here, including all necessary ports. Do not include the protocol here, as it selectable below.
Authentication: If a login is required, enter the access data here.
Protocol: After installation the web frontend is provided via HTTP. If you have secured the access with HTTPS, change the protocol here accordingly.
You can see the default values in the following screenshot:
Integration using Node Exporter
If, for example, you now want to integrate the hardware components of a so-called Scrape Targets from Prometheus, use the Node Exporter. Select Add new Scrape Target, and from the drop-down menu that opens, select Node Exporter:
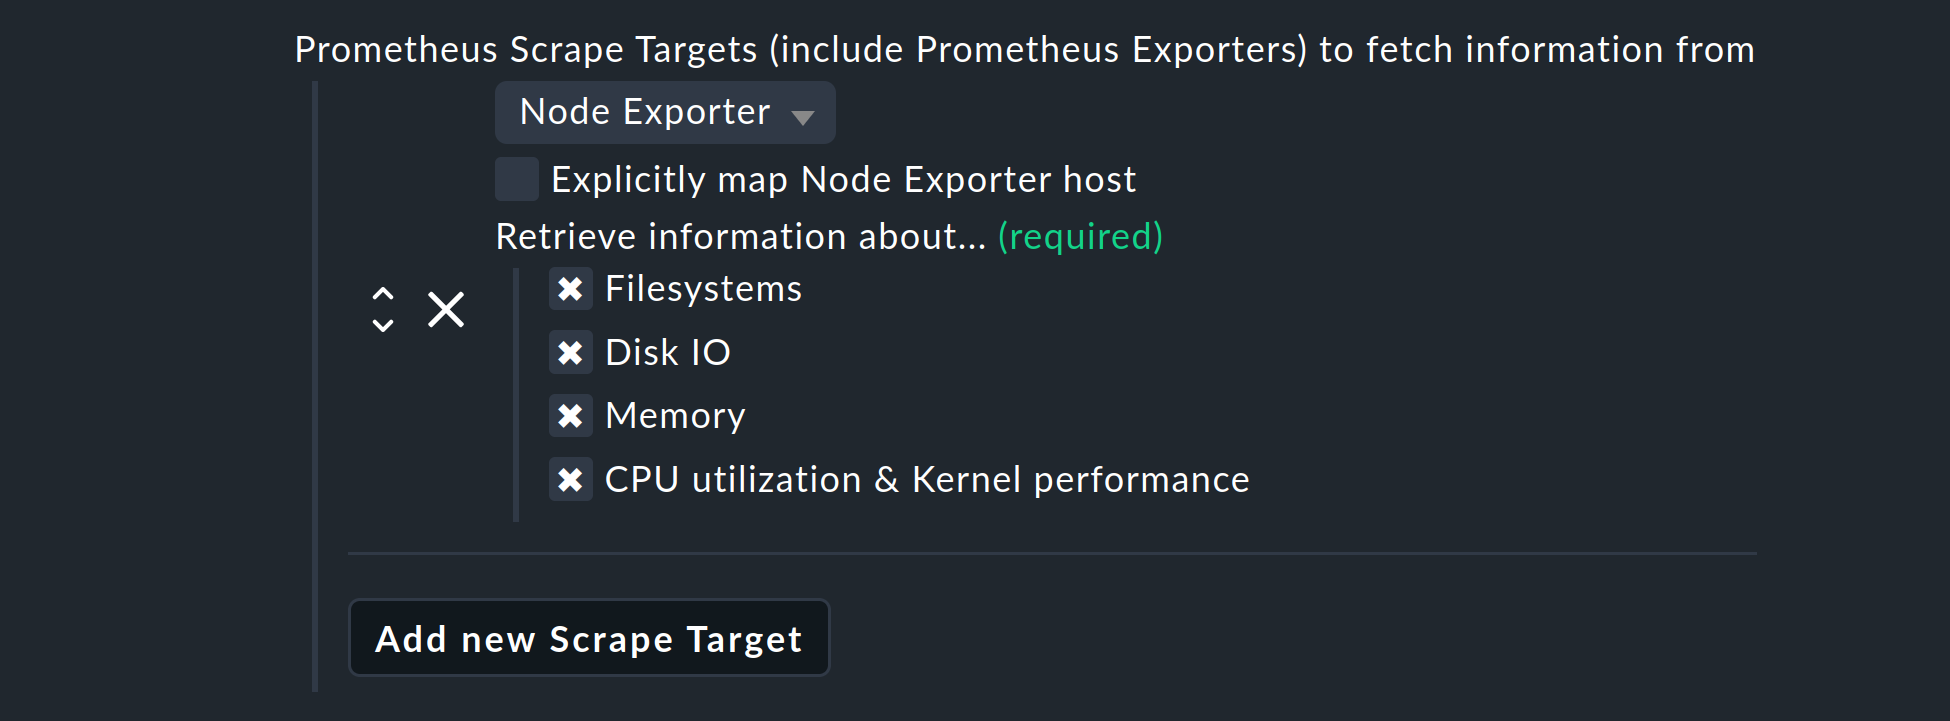
Here you can select which hardware or which operating system instances are to be queried by the Node Exporter. You always have the option to deselect information if you do not want to retrieve it. The services created in this way use the same check plug-ins as are used for other Linux hosts. This means that their behavior is identical to those already familiar, so without needing to adapt to something new you can quickly configure thresholds, or work with graphs.
Normally the agent will try to automatically assign the data to the hosts in Checkmk, and likewise also for the host in Checkmk that fetches the data. However, if in the data from the Prometheus server neither the IP address, the FQDN, nor localhost are present, use the Explicitly map Node Exporter host option to specify which host from the Prometheus server data is to be assigned to the Prometheus host in Checkmk.
Integration using cAdvisor
The cAdvisor exporter enables the monitoring of Docker environments, and returns metrics.
Via the menu Entity level used to create Checkmk piggyback hosts you can determine whether and how the data from Prometheus should be collected in an ready-aggregated form. You can choose from the following three options:
Container - Display the information on container level
Pod - Display the information for pod level
Both - Display the information for both, pod and container, levels
Select either Both or Container, and also define the name under which hosts are created for your containers. The following three options are available for the naming. The option Short is the default:
Short - Use the first 12 characters of the docker container ID
Long - Use the full docker container ID
Name - Use the name of the container
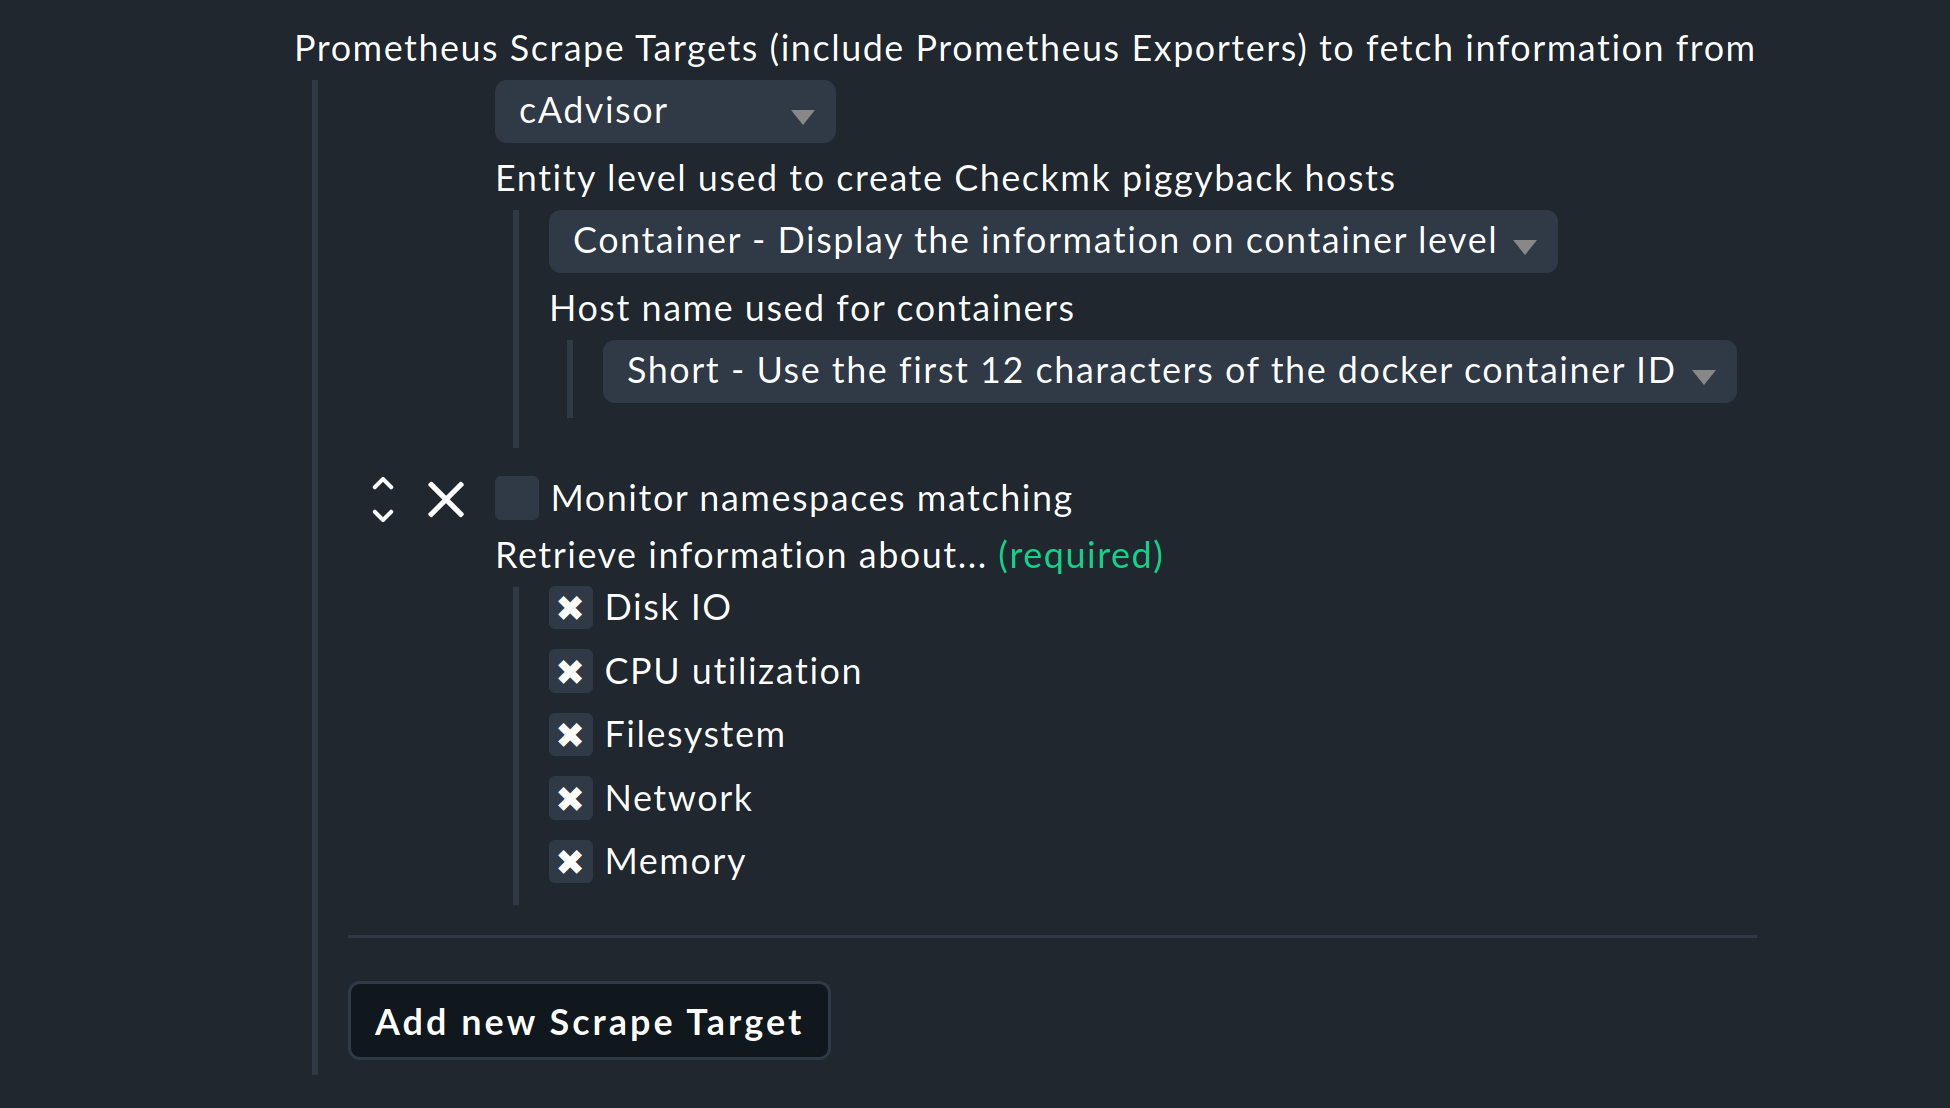
Note that your selection here affects the automatic creation and deletion of hosts according to your dynamic host management.
With Monitor namespaces matching you have the possibility to limit the number of monitored objects. All namespaces that are not covered by the regular expressions will then be ignored.
Integration via PromQL
As already mentioned, with the help of the special agent it is also possible to send requests to your Prometheus servers via PromQL. Select Service creation using PromQL queries > Add new Service. Use the Service name field to determine what the new service should be called in Checkmk.
Next, select Add new PromQL query and use the Metric label field to specify the name of the metric to be imported into Checkmk. Now enter your query in the field PromQL query. It is important that this query may only return a single value.
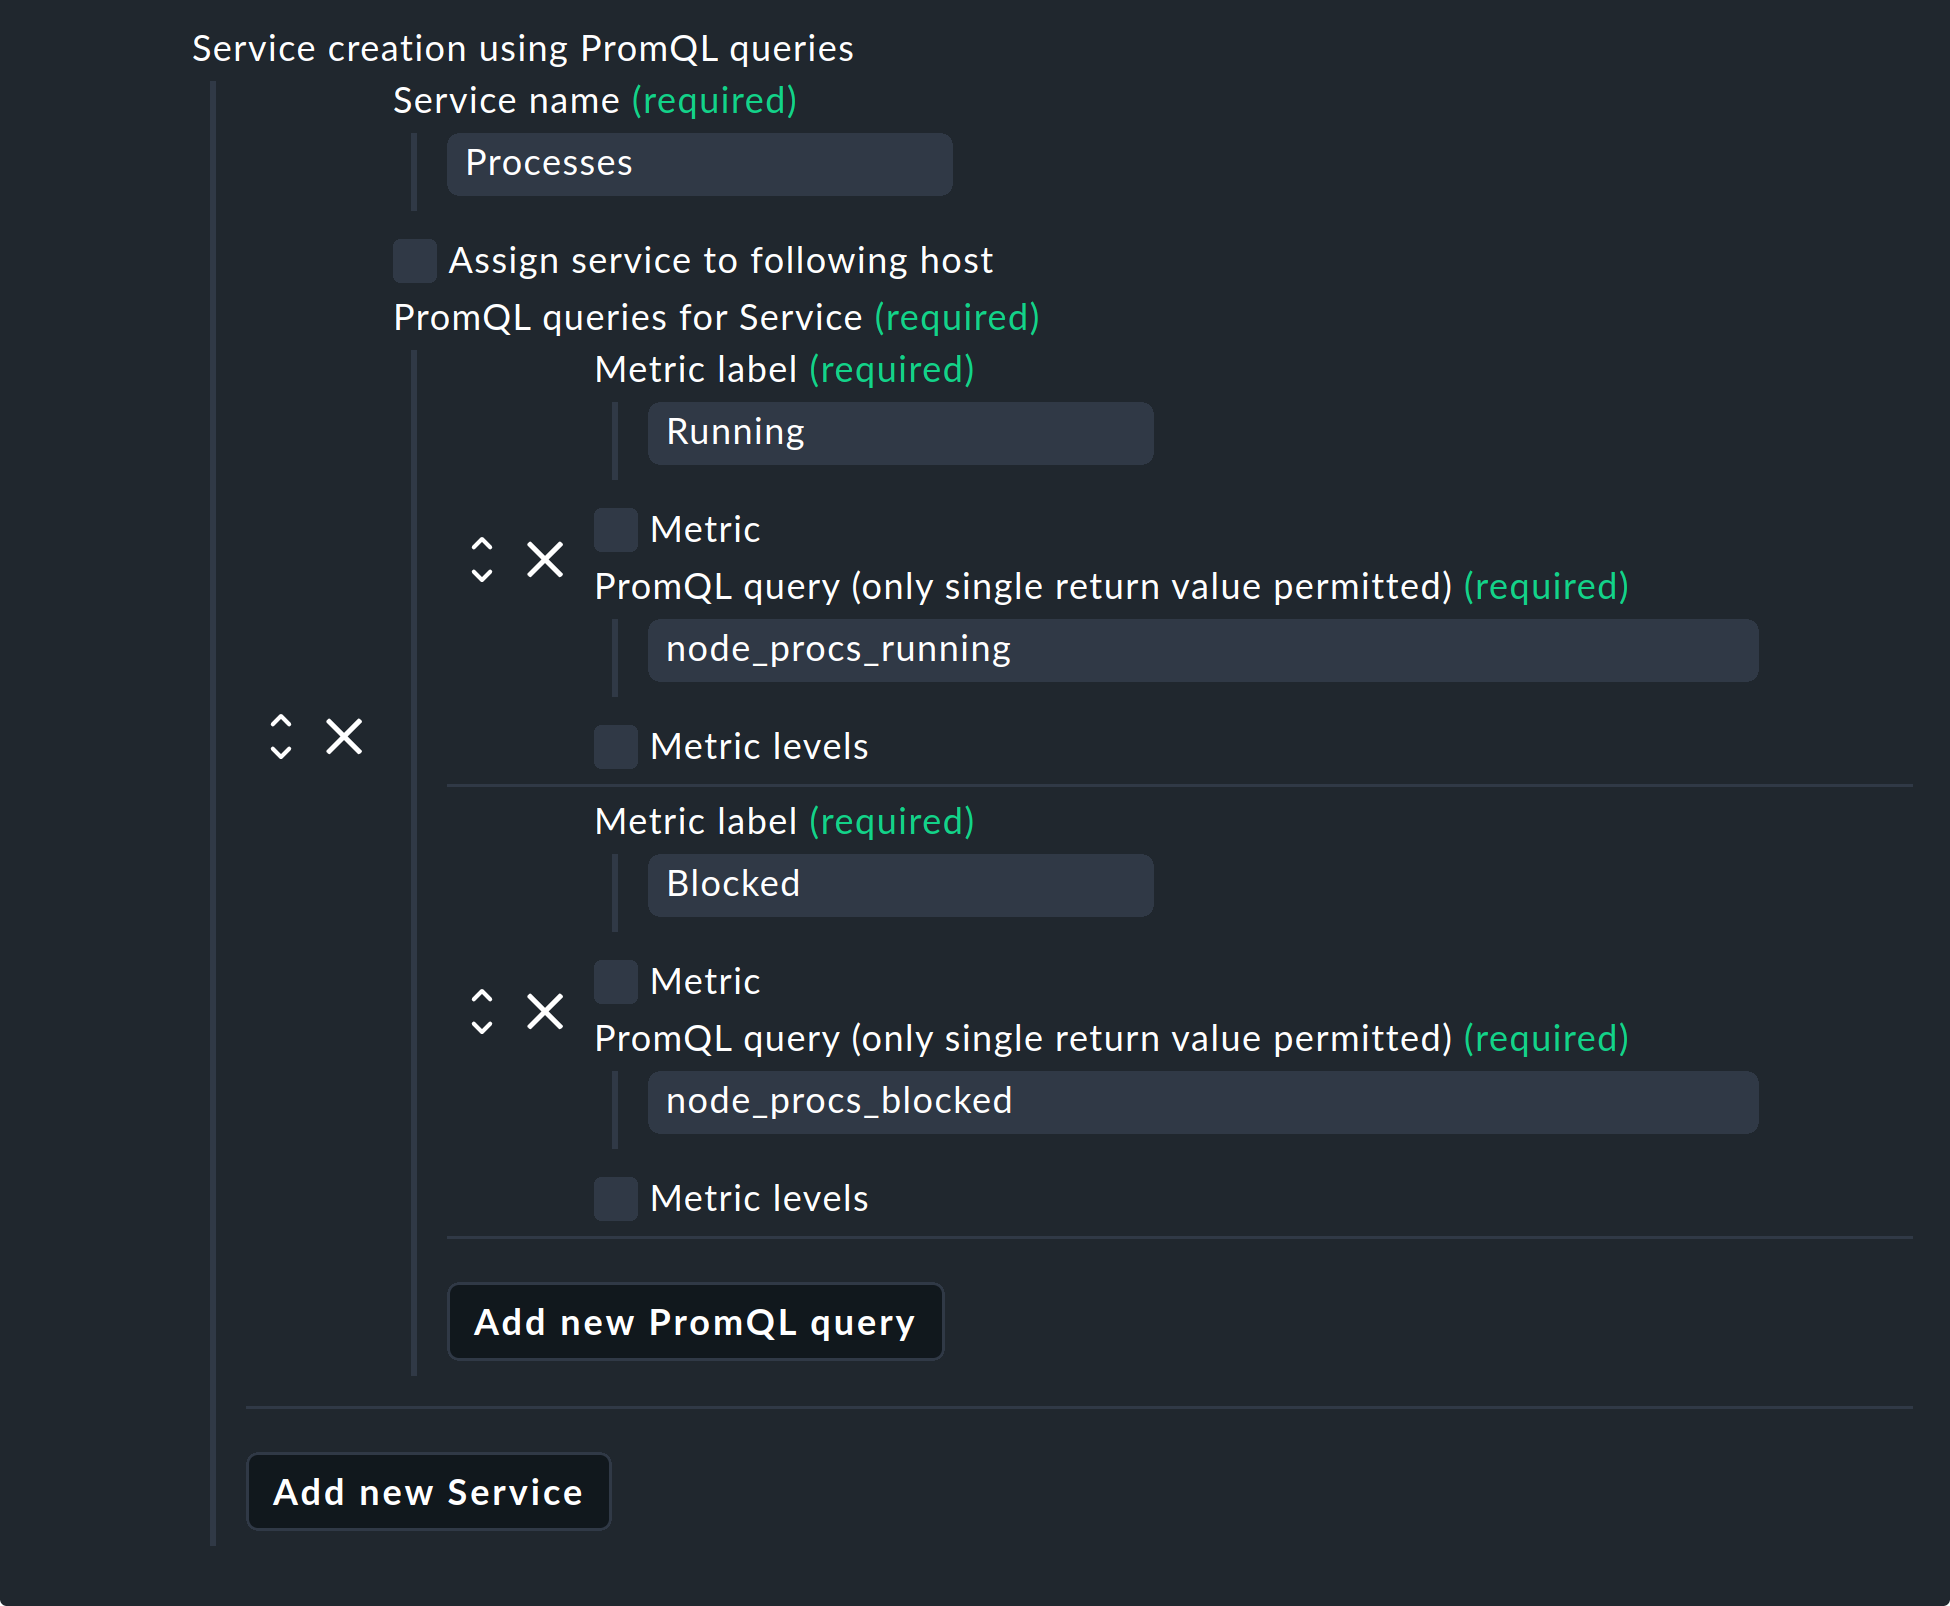
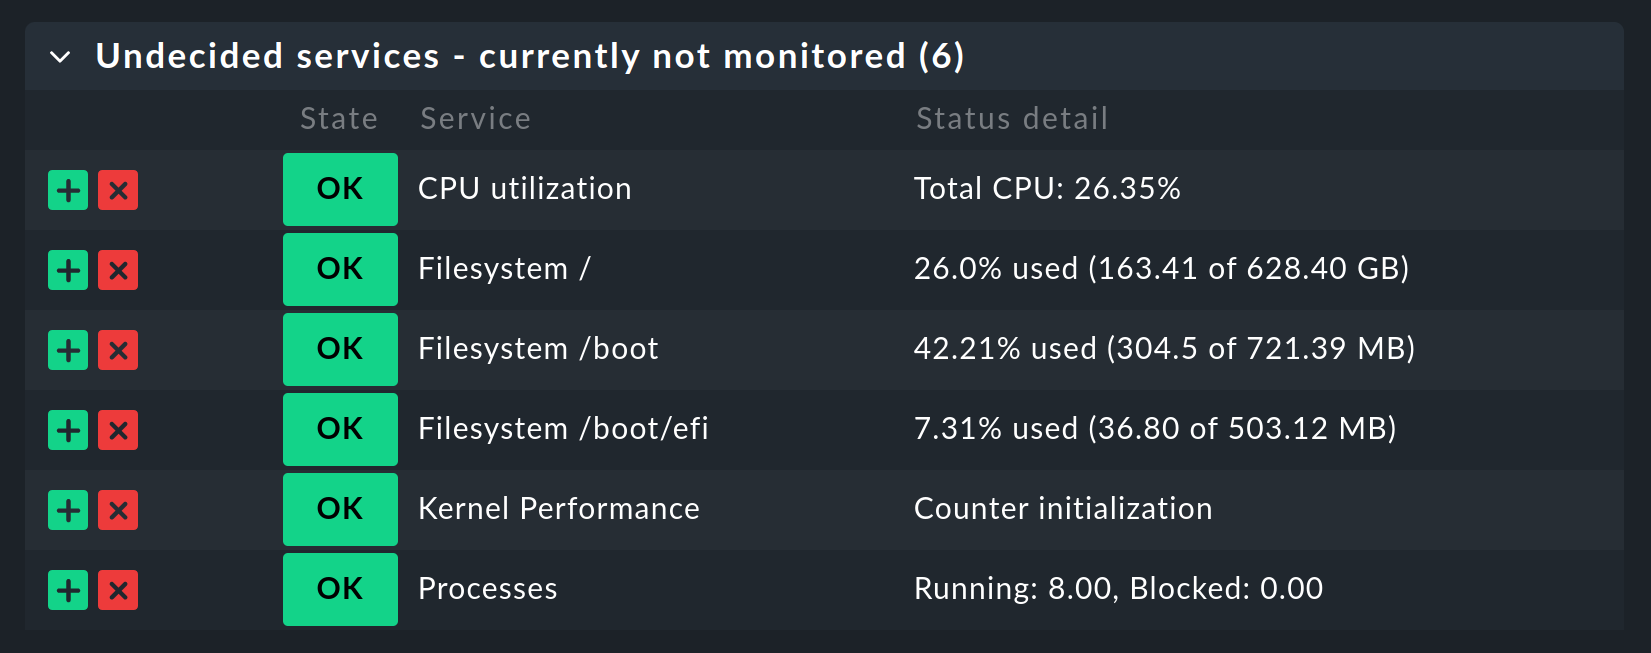
In this example, Prometheus is queried about the number of running and blocked processes. In Checkmk these processes and the two metrics — Running and Blocked — are then combined in a service called Processes.
You can also assign thresholds to these metrics. To do this, activate Metric levels and then choose between Lower levels or Upper levels. Note that these always specify floating point numbers, but of course they also refer to metrics that return integers only.
Assigning a rule to the Prometheus host
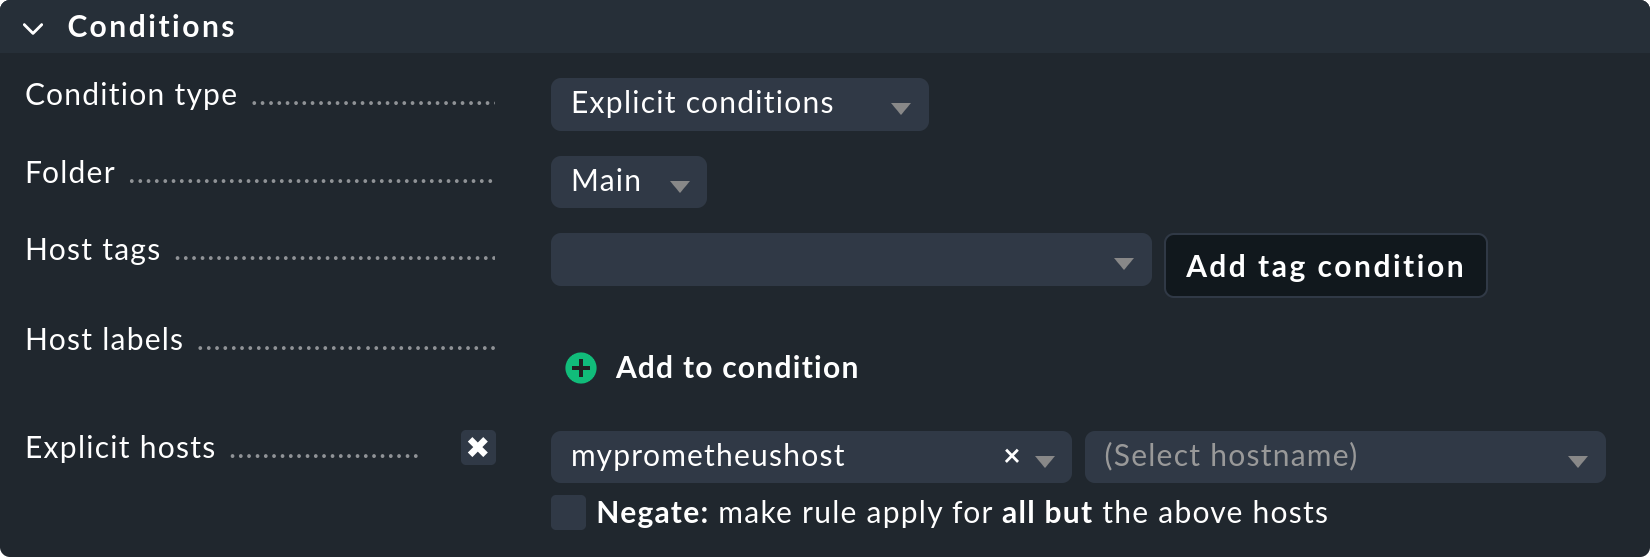
Finally, explicitly assign this rule to the host you just created and confirm with Save.
2.3. Service discovery
Now that you have configured the special agent, it is time to run a service discovery on the Prometheus host.
3. Dynamic host management
3.1. General configuration
Monitoring Kubernetes clusters is probably one of the most common tasks that Prometheus performs.
To ensure an integration of the sometimes very short-lived containers, which are orchestrated via Kubernetes and monitored with Prometheus — also in Checkmk without great effort — a dynamic host management can be set up in the commercial editions.
The data from the individual containers is forwarded as piggyback data to Checkmk.
Now create a new connection using Setup > Hosts > Hosts > Dynamic host management > Add connection, select Piggyback data as the connection type, and use Add new element to define the conditions under which new hosts should be created dynamically.
Consider whether it is necessary for your environment to dynamically delete hosts again when no more data arrives at Checkmk via the piggyback mechanism. Set the option Delete vanished hosts accordingly.
3.2. Special feature in interactions with cAdvisor
Containers usually receive a new ID when they are restarted. In Checkmk the metrics from the host with the old ID are not automatically transferred to the new ID. In most cases, that would not make any sense. In the case of containers, however, this can be very useful, as seen in the example above.
If containers are only restarted, you probably do not want to lose their history. To achieve this, do not create the containers under their IDs, but instead under their names with the Name - Use the name of the container option in the Prometheus rule.
In this way, with the Delete vanished hosts option in the dynamic host management you can still delete containers that no longer exist, without having to fear that their history will also be lost. Instead, this will be continued — by the use of the identical container name — even if it is actually a different container which uses the same name.
