1. Introduction
Checkmk includes an effective monitoring of Google Cloud Platform (GCP), consisting of a connector to GCP and an impressive collection of check plug-ins that retrieve and evaluate various metrics and statuses for you.
In addition to general information about the costs that are incurred by your Google Cloud and the current status of Google services in your region, you can monitor the following Google Cloud products with Checkmk:
With ![]() Checkmk Ultimate you can also include the following products in your monitoring system:
Checkmk Ultimate you can also include the following products in your monitoring system:
A complete listing of all available check plug-ins for monitoring GCP can be found in our Catalog of check plug-ins and we describe how to include your GKE (Google Kubernetes Engine) clusters in Checkmk in the article Monitoring Kubernetes.
2. Setting up monitoring via Quick Setup (optional)
The quickest way to set up the monitoring of individual GCP projects is with our Quick Setup. To do this, open Setup > Quick Setup > Google Cloud Platform (GCP) and click on Add configuration. The Quick Setup will then guide you step by step to your goal.
Detailed instructions on how to obtain the necessary information about your project in GCP can be found in the chapter Preparing GCP for Checkmk.
The biggest advantage of Quick Setup is that any errors will be displayed immediately during the configuration process. If the worst comes to the worst, you will then receive a clear and dedicated indication of what you need to correct before you can move on to the next step.
If you want or need to make changes to the configuration created by the Quick Setup at a later time, you can go back to Setup > Quick Setup.
There, click on the ![]() icon and then select the component you want to edit.
icon and then select the component you want to edit.
The other chapters of this article are only intended as a reference for users of Quick Setup. However, if your GCP environment is rather complex, it is recommended that you continue to carry out the setup according to the following steps. |
3. Concrete implementation of GCP monitoring
3.1. Hosts and services
In Checkmk, all objects to be monitored are arranged in a hierarchical structure of hosts and services. However the concept of hosts does not exist in this form in cloud-based services. To preserve the simplicity and consistency of Checkmk, we map GCP objects to our host/service schema. Each of your projects in the Google Cloud is assigned to its own host in Checkmk. All of the cloud products that you want to monitor in this project will then be split across multiple services on this dedicated host.
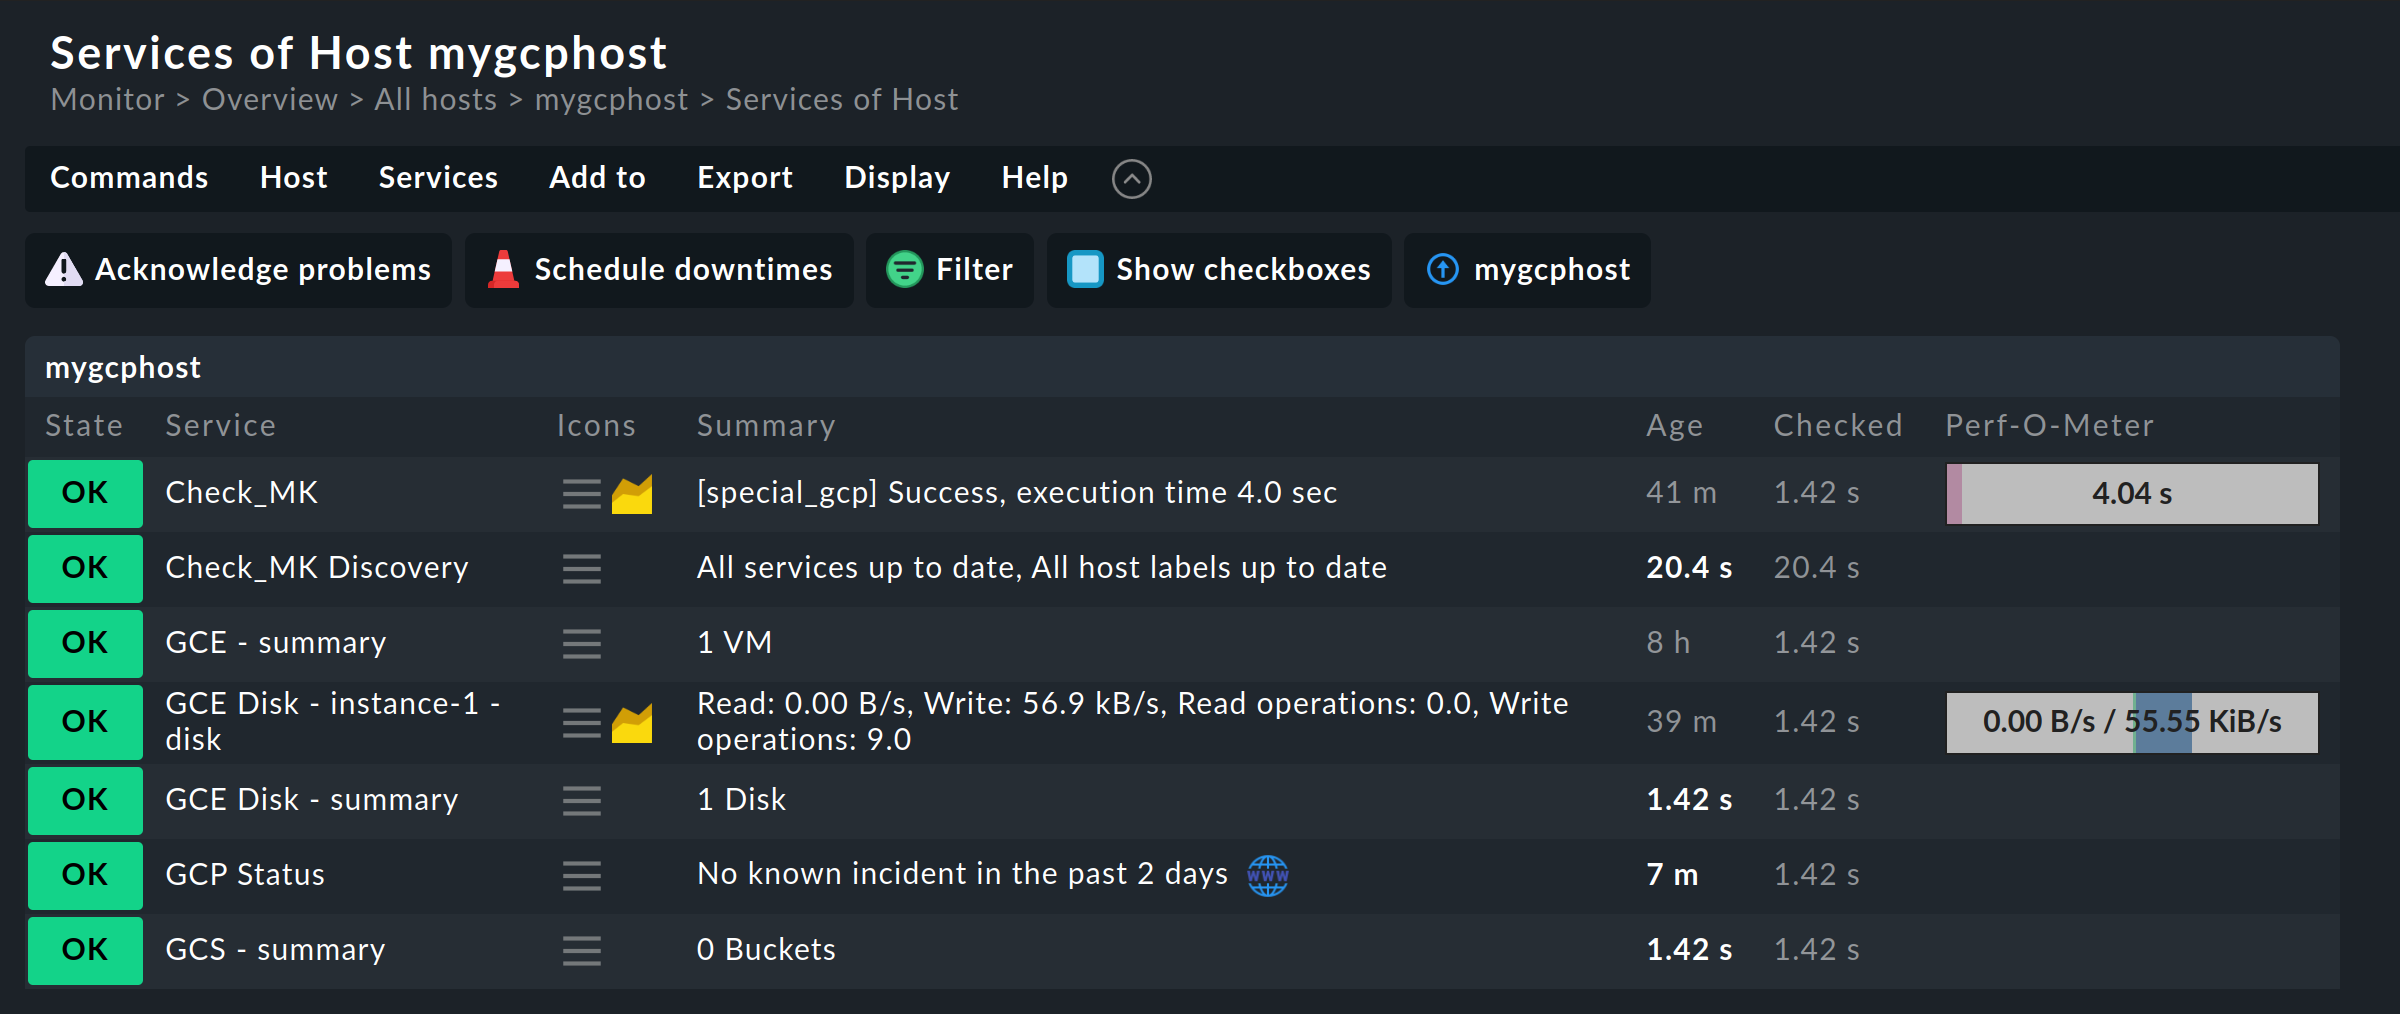
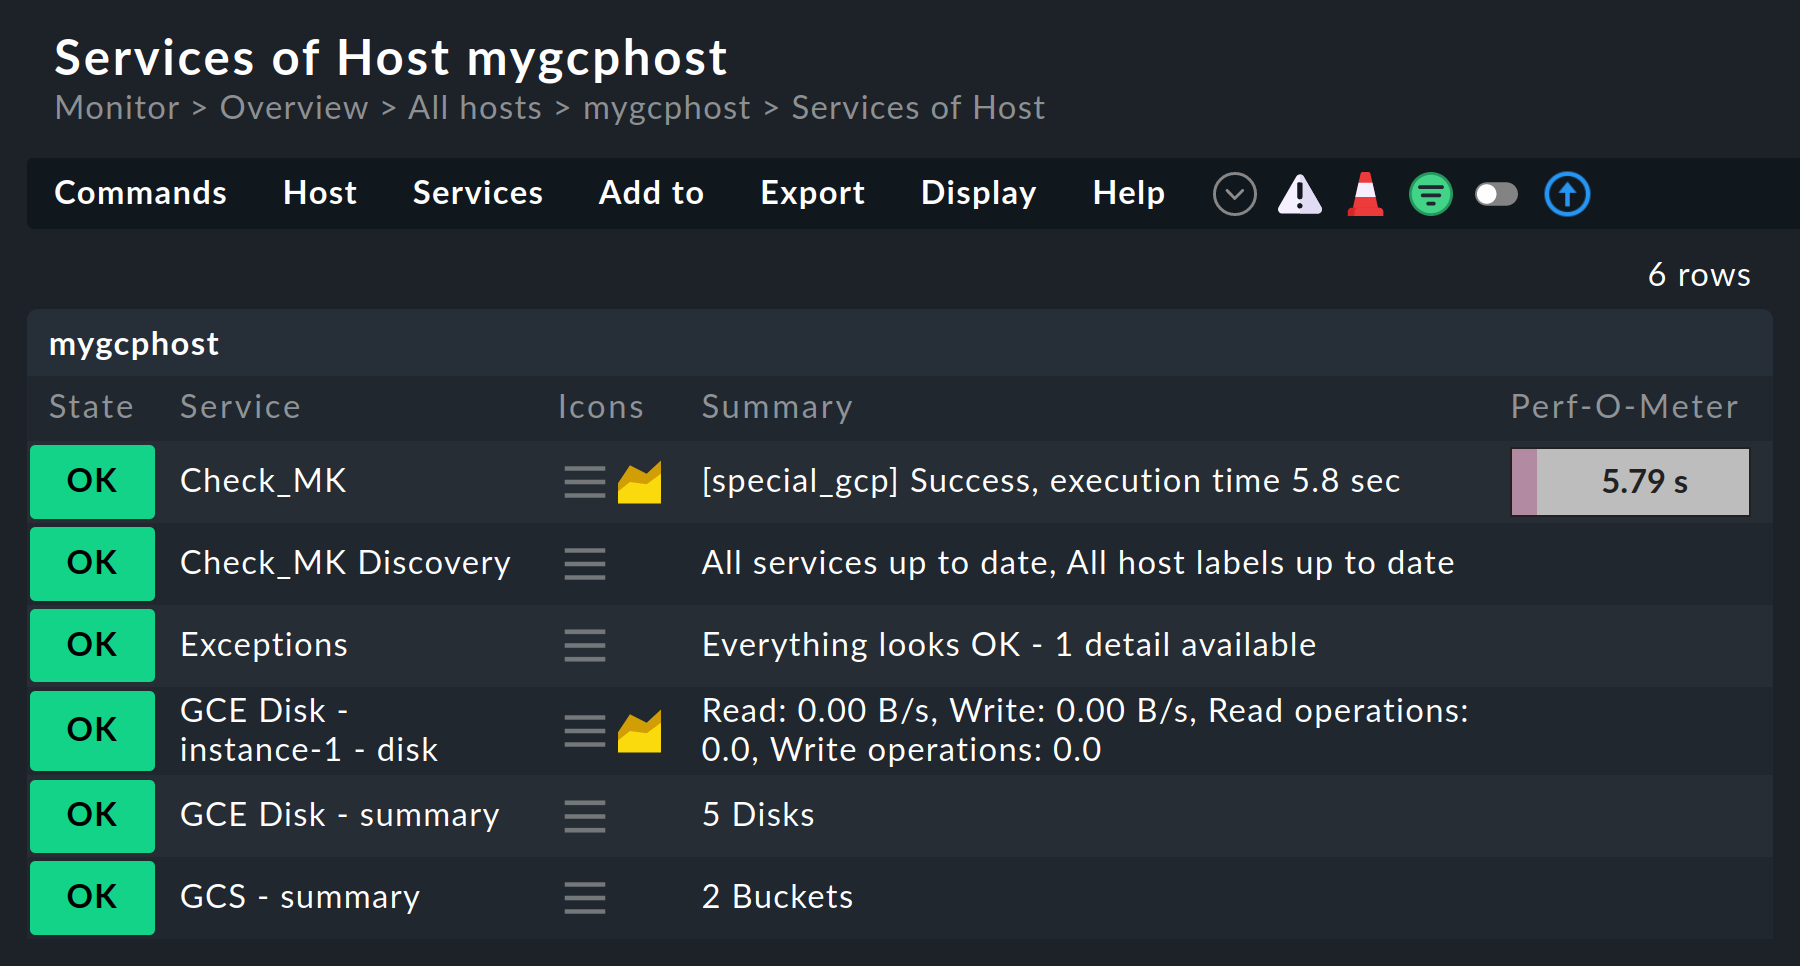
A small project in which only one Compute Engine VM is running can then look like this in the Checkmk monitoring:
3.2. Access to GCP
GCP provides an HTTP-based API through which monitoring data can also be retrieved.
Checkmk accesses this API via the agent_gcp special agent.
This takes the place of the Checkmk agent, but — unlike the latter — is executed locally on the Checkmk server.
4. Preparing GCP for Checkmk
4.1. Acquiring a project ID
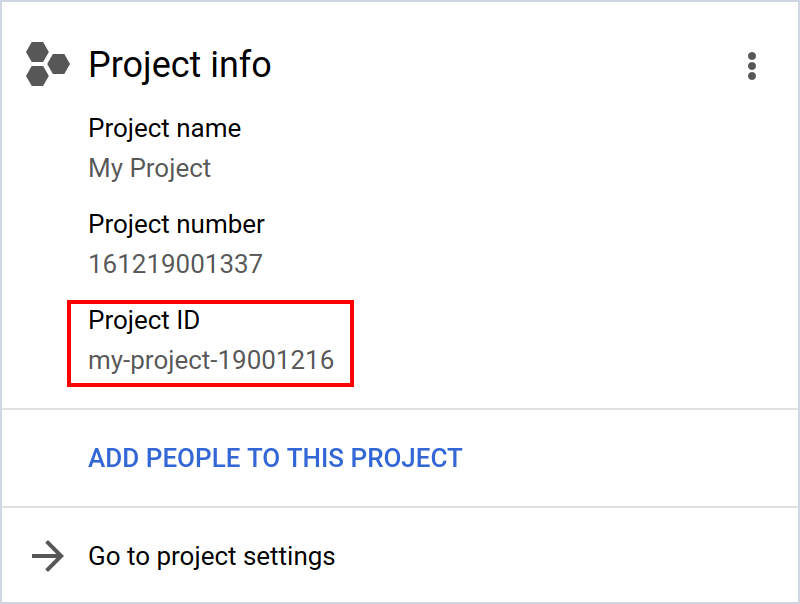
Log in to the Google Cloud Console. Make sure that the correct project is selected in the title bar or select the project to be monitored here.
Then open the project’s dashboard. Here you should find — if the dashboard still corresponds to the standard — a card with the Project ID. Copy or write this information down.
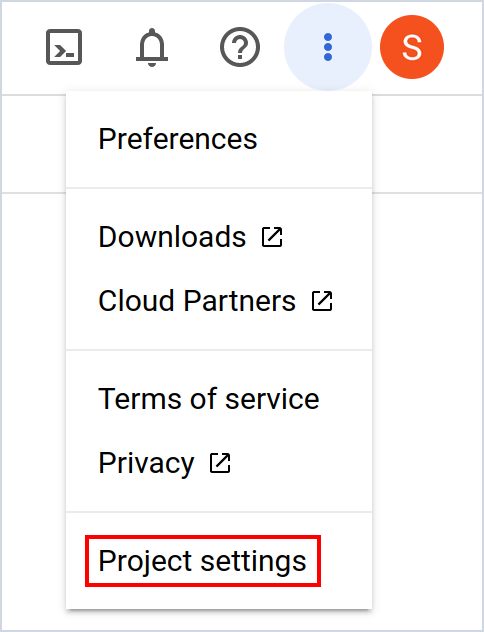
If the card with the project information no longer appears in your dashboard, you can also find the necessary ID via the Project settings:
4.2. Creating a user
Next, open the user administration under IAM & Admin.
In the overview on the left-hand side, you must now select Service Accounts and then at the top click on Create Service Account.
Here choose a name for the service account.
We recommend giving this account a name that makes it immediately clear what it is for, e.g. checkmk-monitoring.
In addition to a descriptive name, you can optionally enter a description — a
service account description.
After clicking on Create and continue you will need to assign the two roles, Monitoring Viewer and Cloud Asset Viewer to this service account.
To do this, click in the Select a role field and enter the role’s name.
Note: If you enter Monitoring Viewer in the field, you will be shown a whole series of roles with similar names. Be careful to actually select Monitoring Viewer.
Once you have selected the roles, you can skip the next optional step and click directly on Done.
4.3. Creating a key
So that you can actually access the monitoring and asset data in your Google Cloud via this new service account, you will still need to create a key. You will store this key later in the corresponding rule in Checkmk or in the Password store.
In the Service accounts for project My Project overview, you can click on the three dots in the row by your new service account and select Manage keys.
Next, click on Add key and then on Create new key.
Be sure to select JSON as the format and click Create.
This click on Create — easily overlooked — downloads a file in JSON format.
Keep this file in a safe place for the time being, as you will not be able to download it again.
We do recommend, however, that you also delete this file after storing its contents in Checkmk (see Creating a rule for GCP agents).
If necessary, a new key should be created and the old one discarded altogether.
4.4. Activating APIs in the GCP project
On your GCP project’s overview page you will also find the APIs & Services menu item.
In this overview, check whether the Cloud Asset API appears in the list of Enabled APIs & services.
If this is not the case, activate this API via the Enable APIs and services button.
Following an activation, it will take a few minutes until the API is actually accessible.
4.5. Monitoring billing information
In the Google Cloud Platform, billing information is stored separately from the resources. As a rule, separate projects are created for cost analysis in GCP, in which the billing information for other projects is also collected. In order to be able to monitor this information with Checkmk, it is essential that this data is exported to BigQuery within GCP. Only data that is available in BigQuery tables can be accessed remotely — and thus by Checkmk. How to set up such an export within GCP is explained in detail in the document Export Cloud Billing data to BigQuery in the GCP help pages.
If you have set up BigQuery or are already using it, you will find a list of its included tables in the accounting project’s SQL workspace. Open the accounting project’s table and click on the Details tab. Under Table ID, you will find the information you will need to enter when creating the rule in Checkmk at Costs > BigQuery table ID.
The service for monitoring project costs is designed as an overview. Only the monthly costs of the individual projects are displayed and monitored. You can define threshold values for these monthly costs with the GCP Cost rule.
5. Setting up monitoring in Checkmk
5.1. Creating a host for GCP
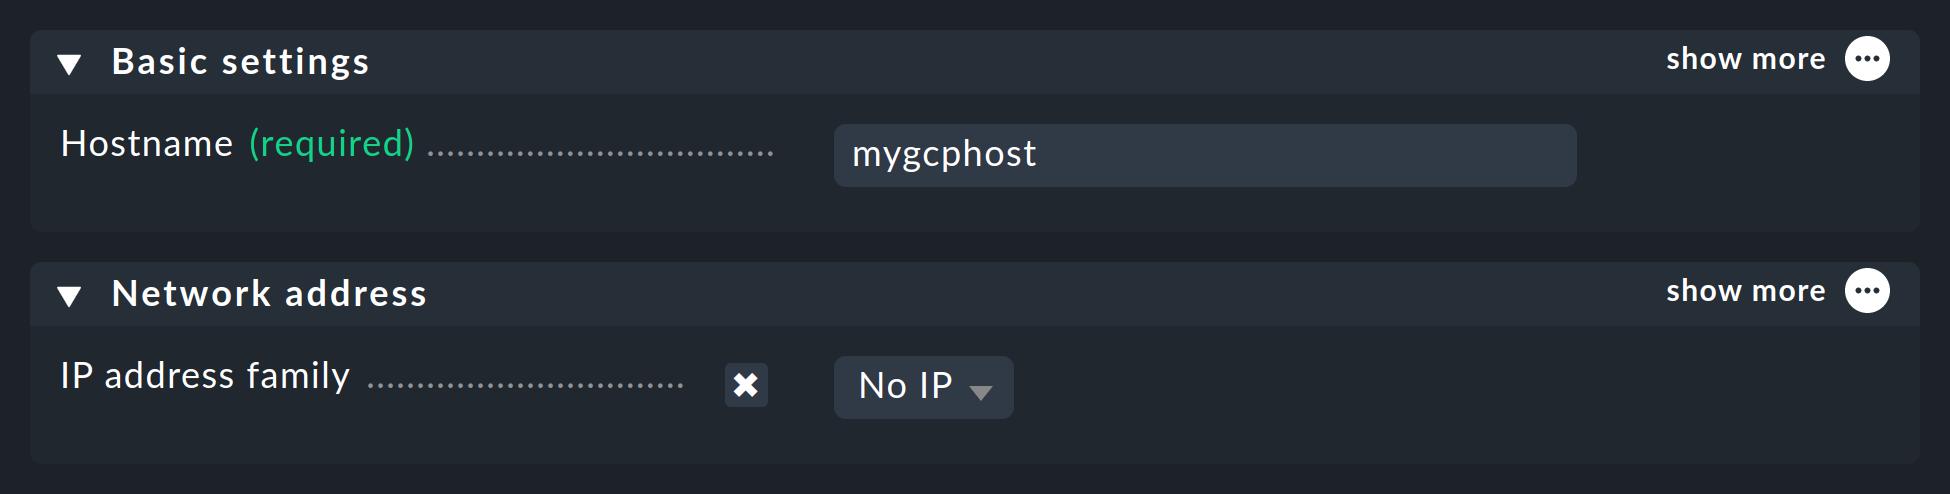
Now create a host for monitoring GCP in Checkmk. You can assign the host name as you wish. If you want to monitor more than one project in GCP, you must create a separate host in Checkmk for each project.
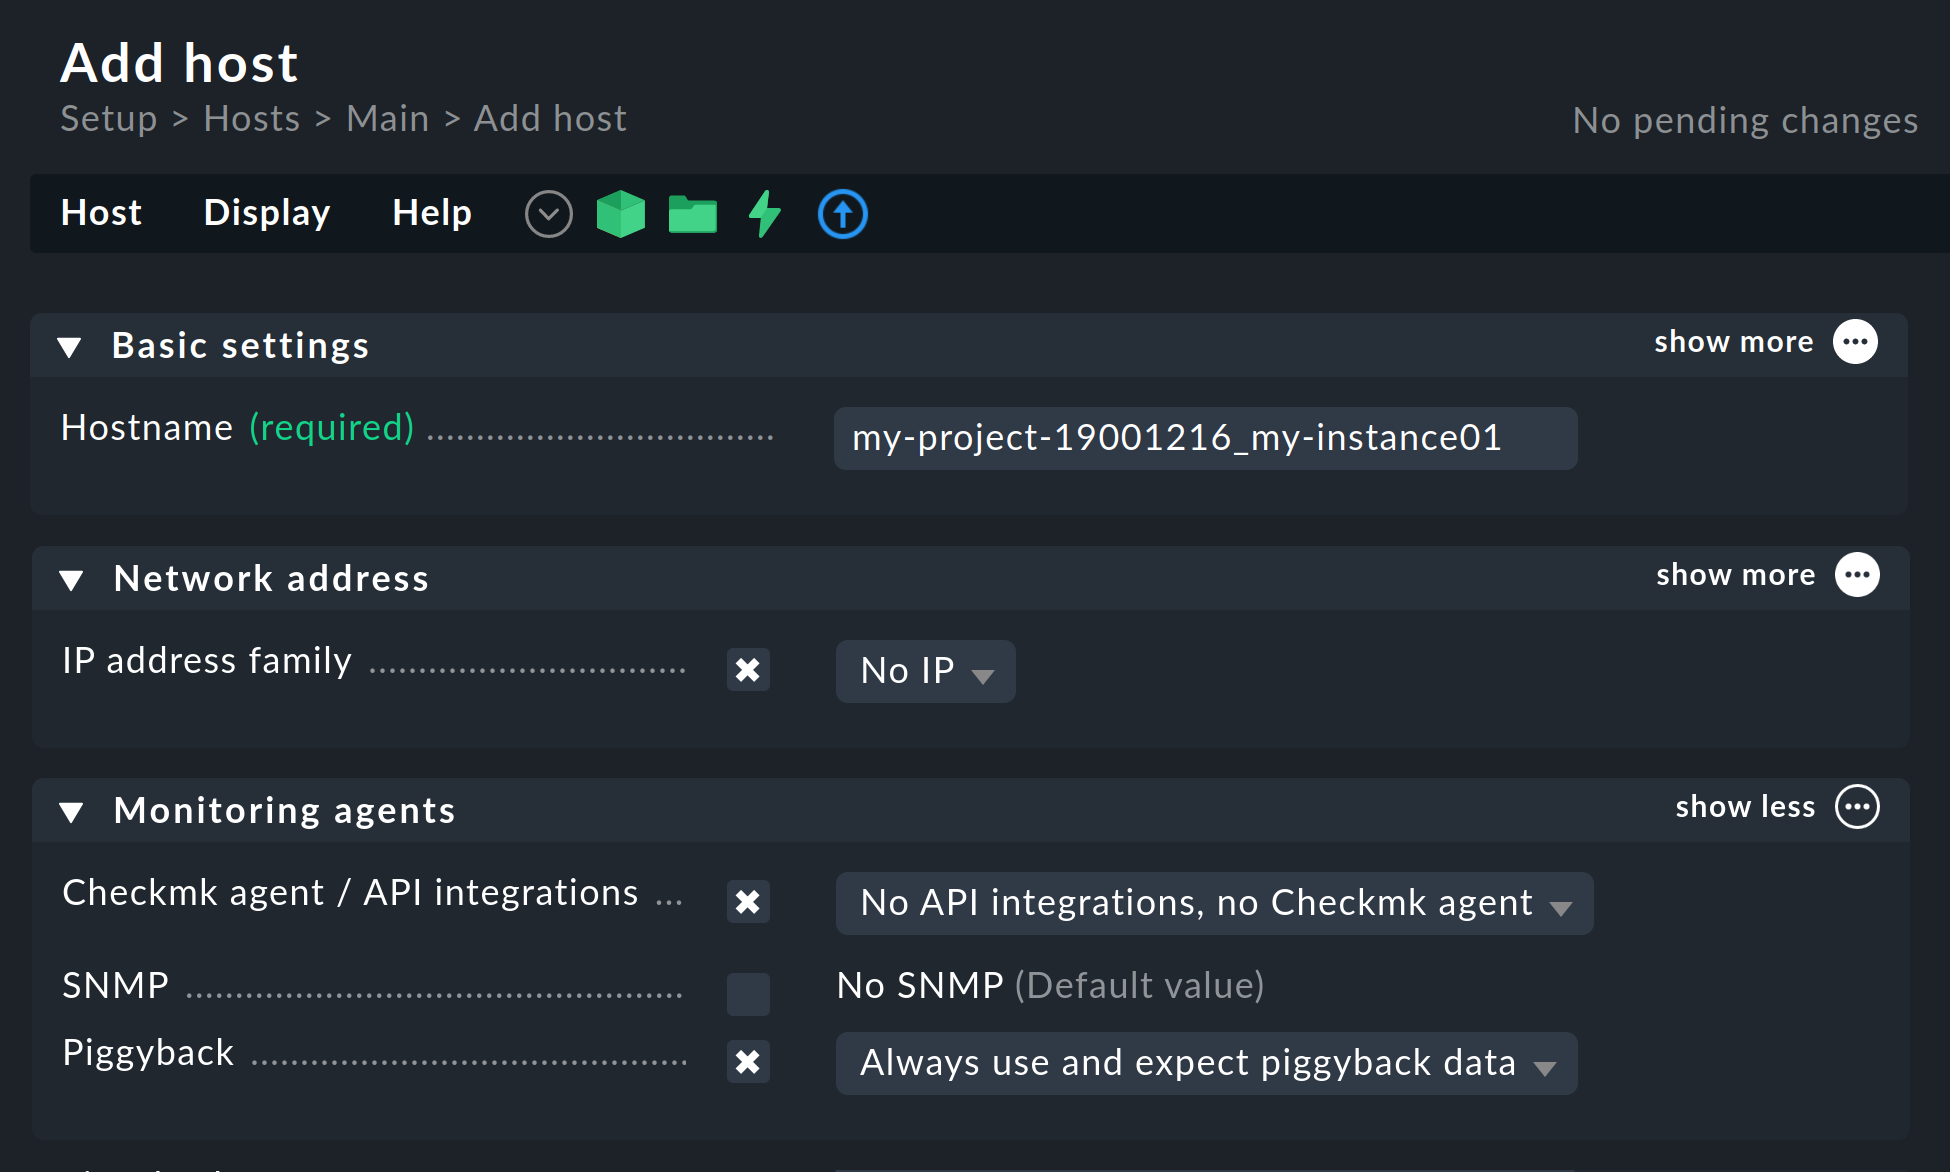
Important: Since GCP as a service has neither an IP address nor a DNS name (the special agent does the access by itself), you must set the IP address family to No IP.
5.2. Configuring the GCP agent
As mentioned at the beginning of this article, projects on the Google Cloud Platform are monitored by a special agent. This agent is configured with a rule, which you can find via Setup > Agents > VM, cloud, container > Google Cloud Platform (GCP).
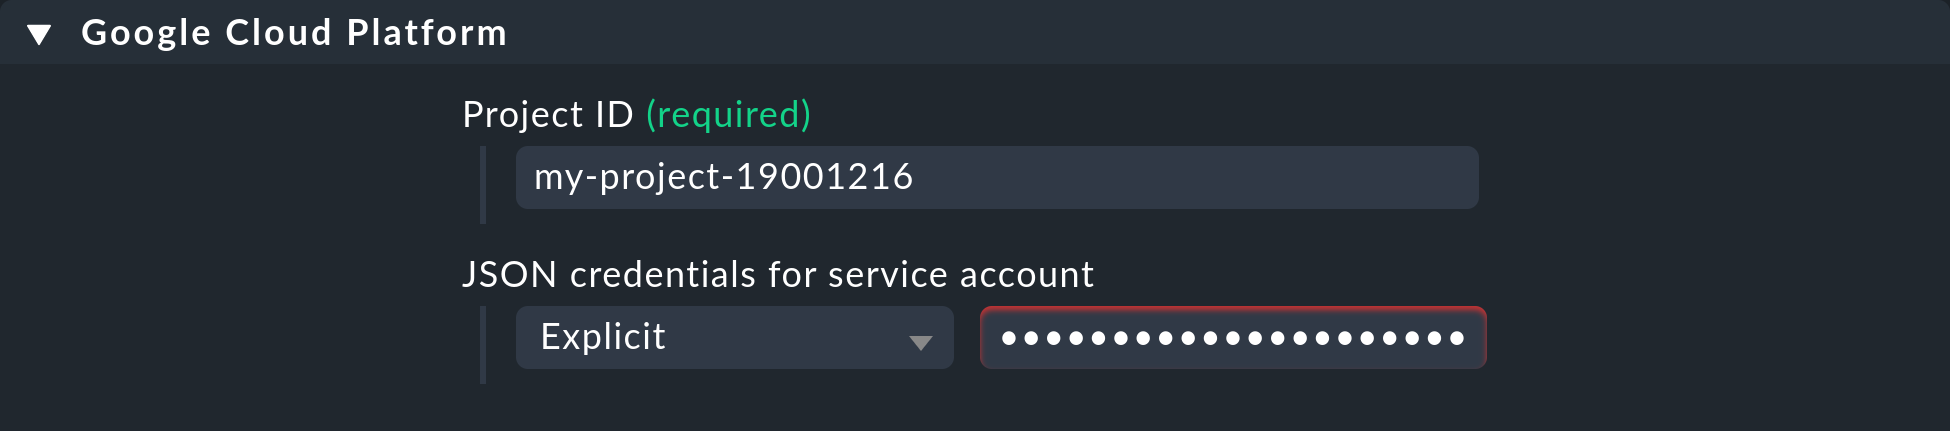
In the corresponding field, enter the Project ID that you previously looked up in your project.
Under JSON credentials for service account, the key that you earlier created for your service account must be entered next. You will need to copy the entire JSON object (including the curly brackets) into this.
Under GCP services to monitor you can now select which GCP products are to be monitored by the special agent. To make the API queries as economical as possible, we recommend that you only select the products that are actually being used in your project.
5.3. Services on the GCP host itself
Now start a service discovery of the newly created GCP host in which Checkmk should now find quite a few services. When you have added the services, it will look something like this after activating the changes in the monitoring:
5.4. Creating hosts for the Compute Engine VM instances
Services that are assigned to Compute Engine VM instances are not assigned to the GCP host, but to so-called piggybacked hosts.
This works in such a way that data retrieved from the GCP host is distributed to these piggybacked hosts, which operate without their own monitoring agents.
A piggybacked host is assigned to each VM instance.
The names of these piggybacked hosts are composed from the ID of your project, an underscore and the full name of the instance.
For example, if your project has the project ID my-project-19001216 and you then monitor a VM with the name my-instance01, the piggybacked host will be named my-project-19001216_my-instance01.
Either create these hosts manually or — if possible — leave this task to the dynamic host management.
Setting up dynamic host management
![]() As a user of one of our commercial editions,
you can simply leave the creation and deletion of hosts for your VM instances to the dynamic host management.
The Setup > Hosts > Dynamic host management menu item takes you to the overview page for all connections that have already been configured.
Click on
As a user of one of our commercial editions,
you can simply leave the creation and deletion of hosts for your VM instances to the dynamic host management.
The Setup > Hosts > Dynamic host management menu item takes you to the overview page for all connections that have already been configured.
Click on ![]() Add connection and then give the connection an ID and a Title.
Add connection and then give the connection an ID and a Title.
Not all options available in the Connection properties are covered below. Consult the inline help and the main article linked above if you have any questions.
First, make sure that the Connection properties box has the Show more mode enabled so that all available options are displayed.
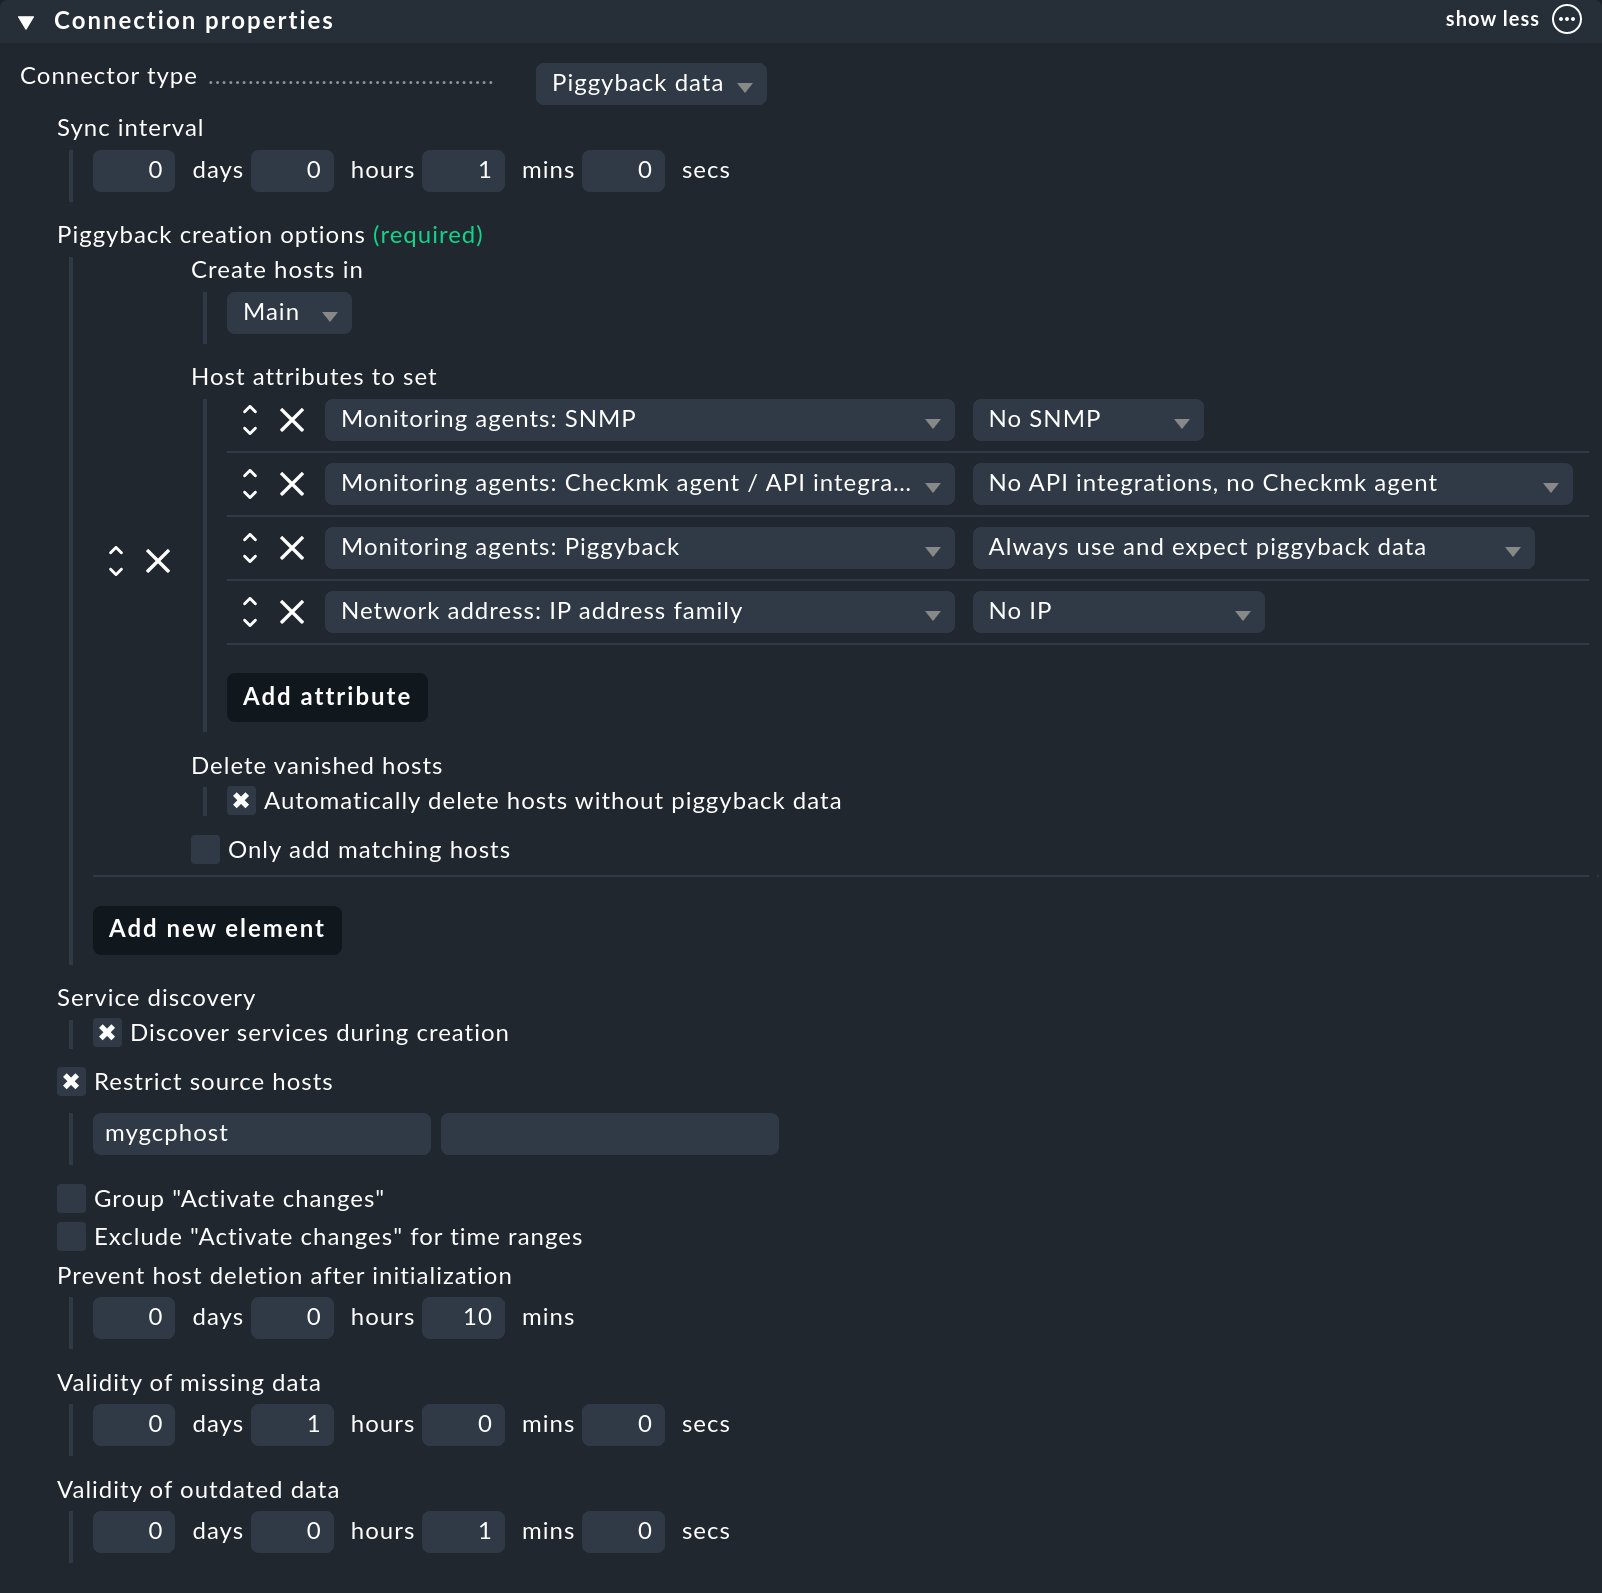
Next, under Piggyback creation options click Add new element. Customize the folder in which the hosts of your VM instances are to be created. The preselected Host attributes are basically correct for piggybacked hosts and do not really need to be altered.
By activating the Delete vanished hosts option, you can ensure that piggybacked hosts from which no more fresh data is received over a specified period of time will be automatically deleted.
As a part of monitoring your GCP projects, the option Restrict source hosts should be activated. Enter your GCP host from the section Creating a host for GCP in Checkmk here.
As an example, a configuration of such a connection could then look like this:
Manually creating hosts for VM instances
Alternatively, you can create hosts for the piggyback data manually. In doing so, it is important that the names of the hosts correspond exactly to the scheme described above.
With the command |
Configure the hosts for these Compute Engine VMs without an IP address (analogous to the GCP host) and select No API integrations, no Checkmk agent as monitoring agent. If you also select the Always use and expect piggyback data option under Piggyback, you will be warned accordingly if the data fails to arrive.
6. Diagnostic options
6.1. The Exceptions service
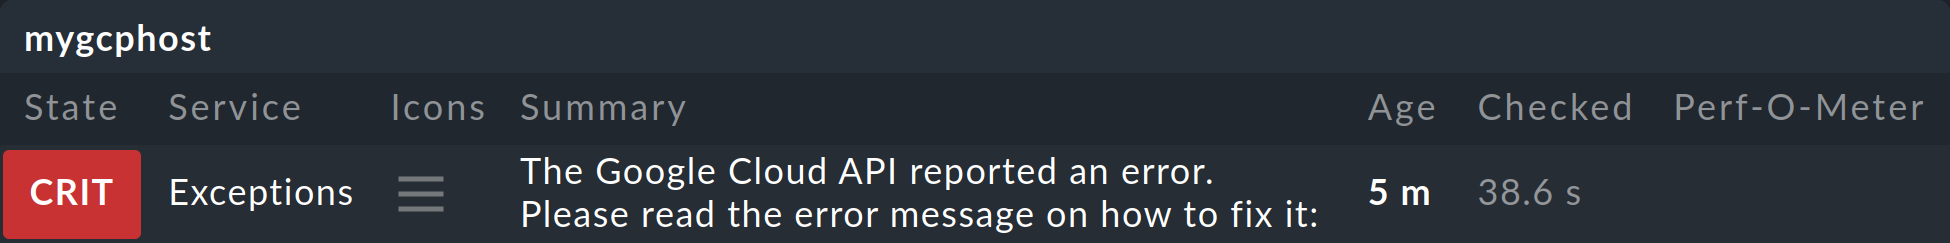
The Exceptions service supports you in setting up a GCP monitoring, and also assists with any future problems encountered when communicating with the Google Cloud API. All error messages that the Google Cloud API returns to the special agent are collected and processed here. In the event of an error, this service becomes CRIT by default and in its Summary will provide an indication of where the problem lies.
Clicking on the name of the service will then give you a very detailed message, often with a link to the exact place in your GCP project where it needs a different setting, for instance. In the following example, the Cloud Asset API is disabled in the monitored project.
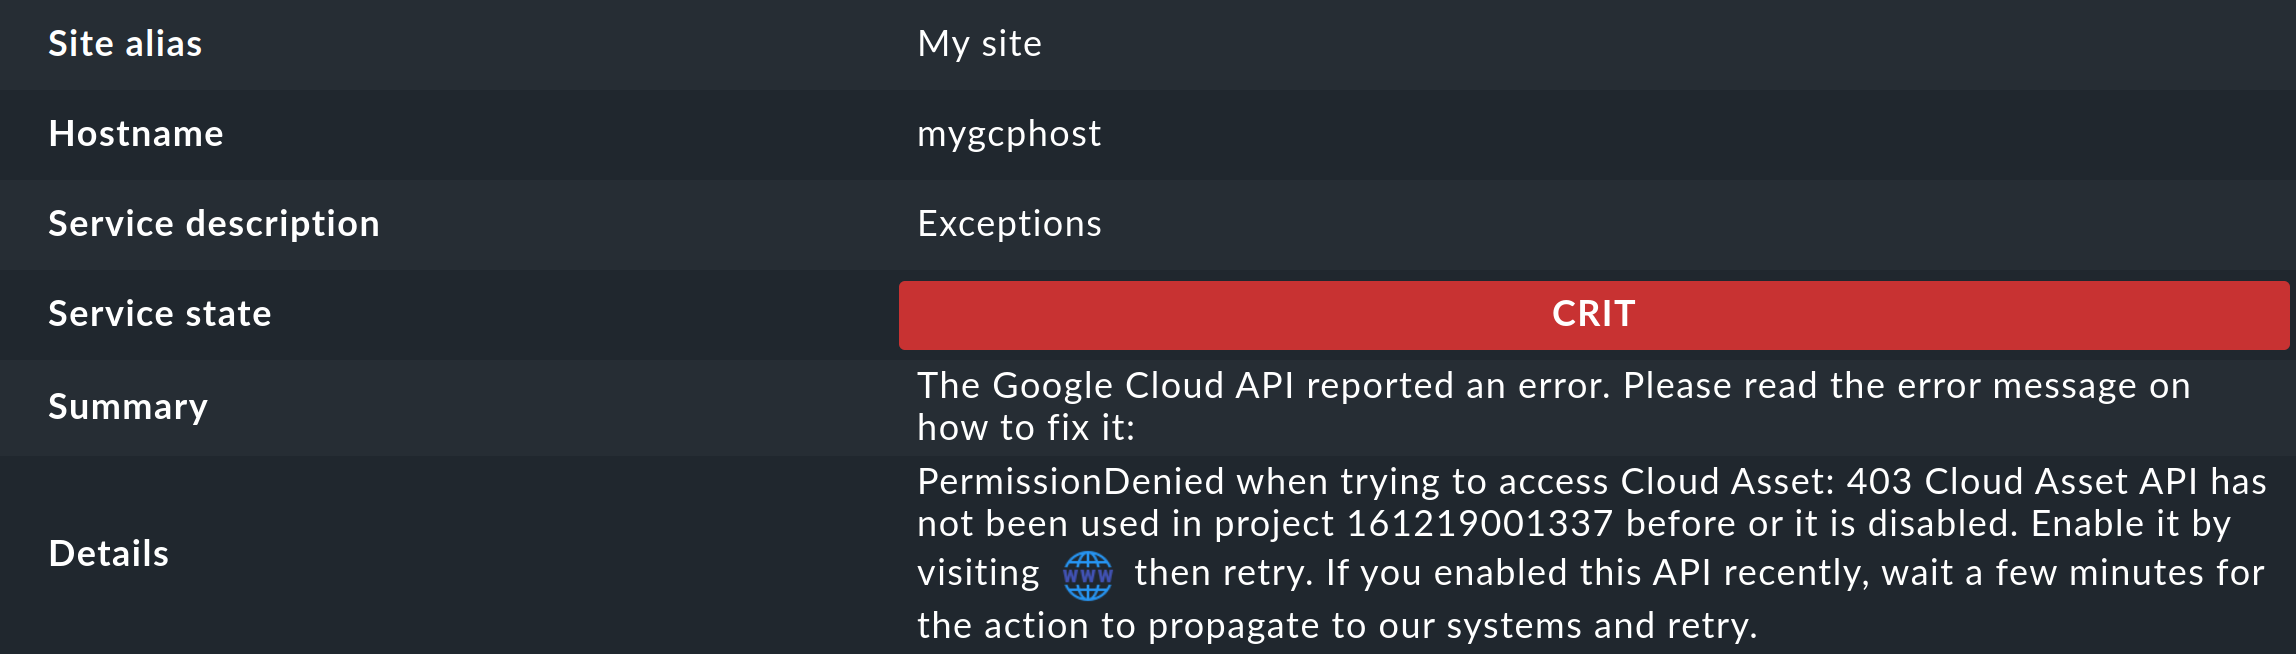
A click on the WWW globe ![]() will then take you to the exact page in your project where this API can be enabled.
will then take you to the exact page in your project where this API can be enabled.
7. Dashboards
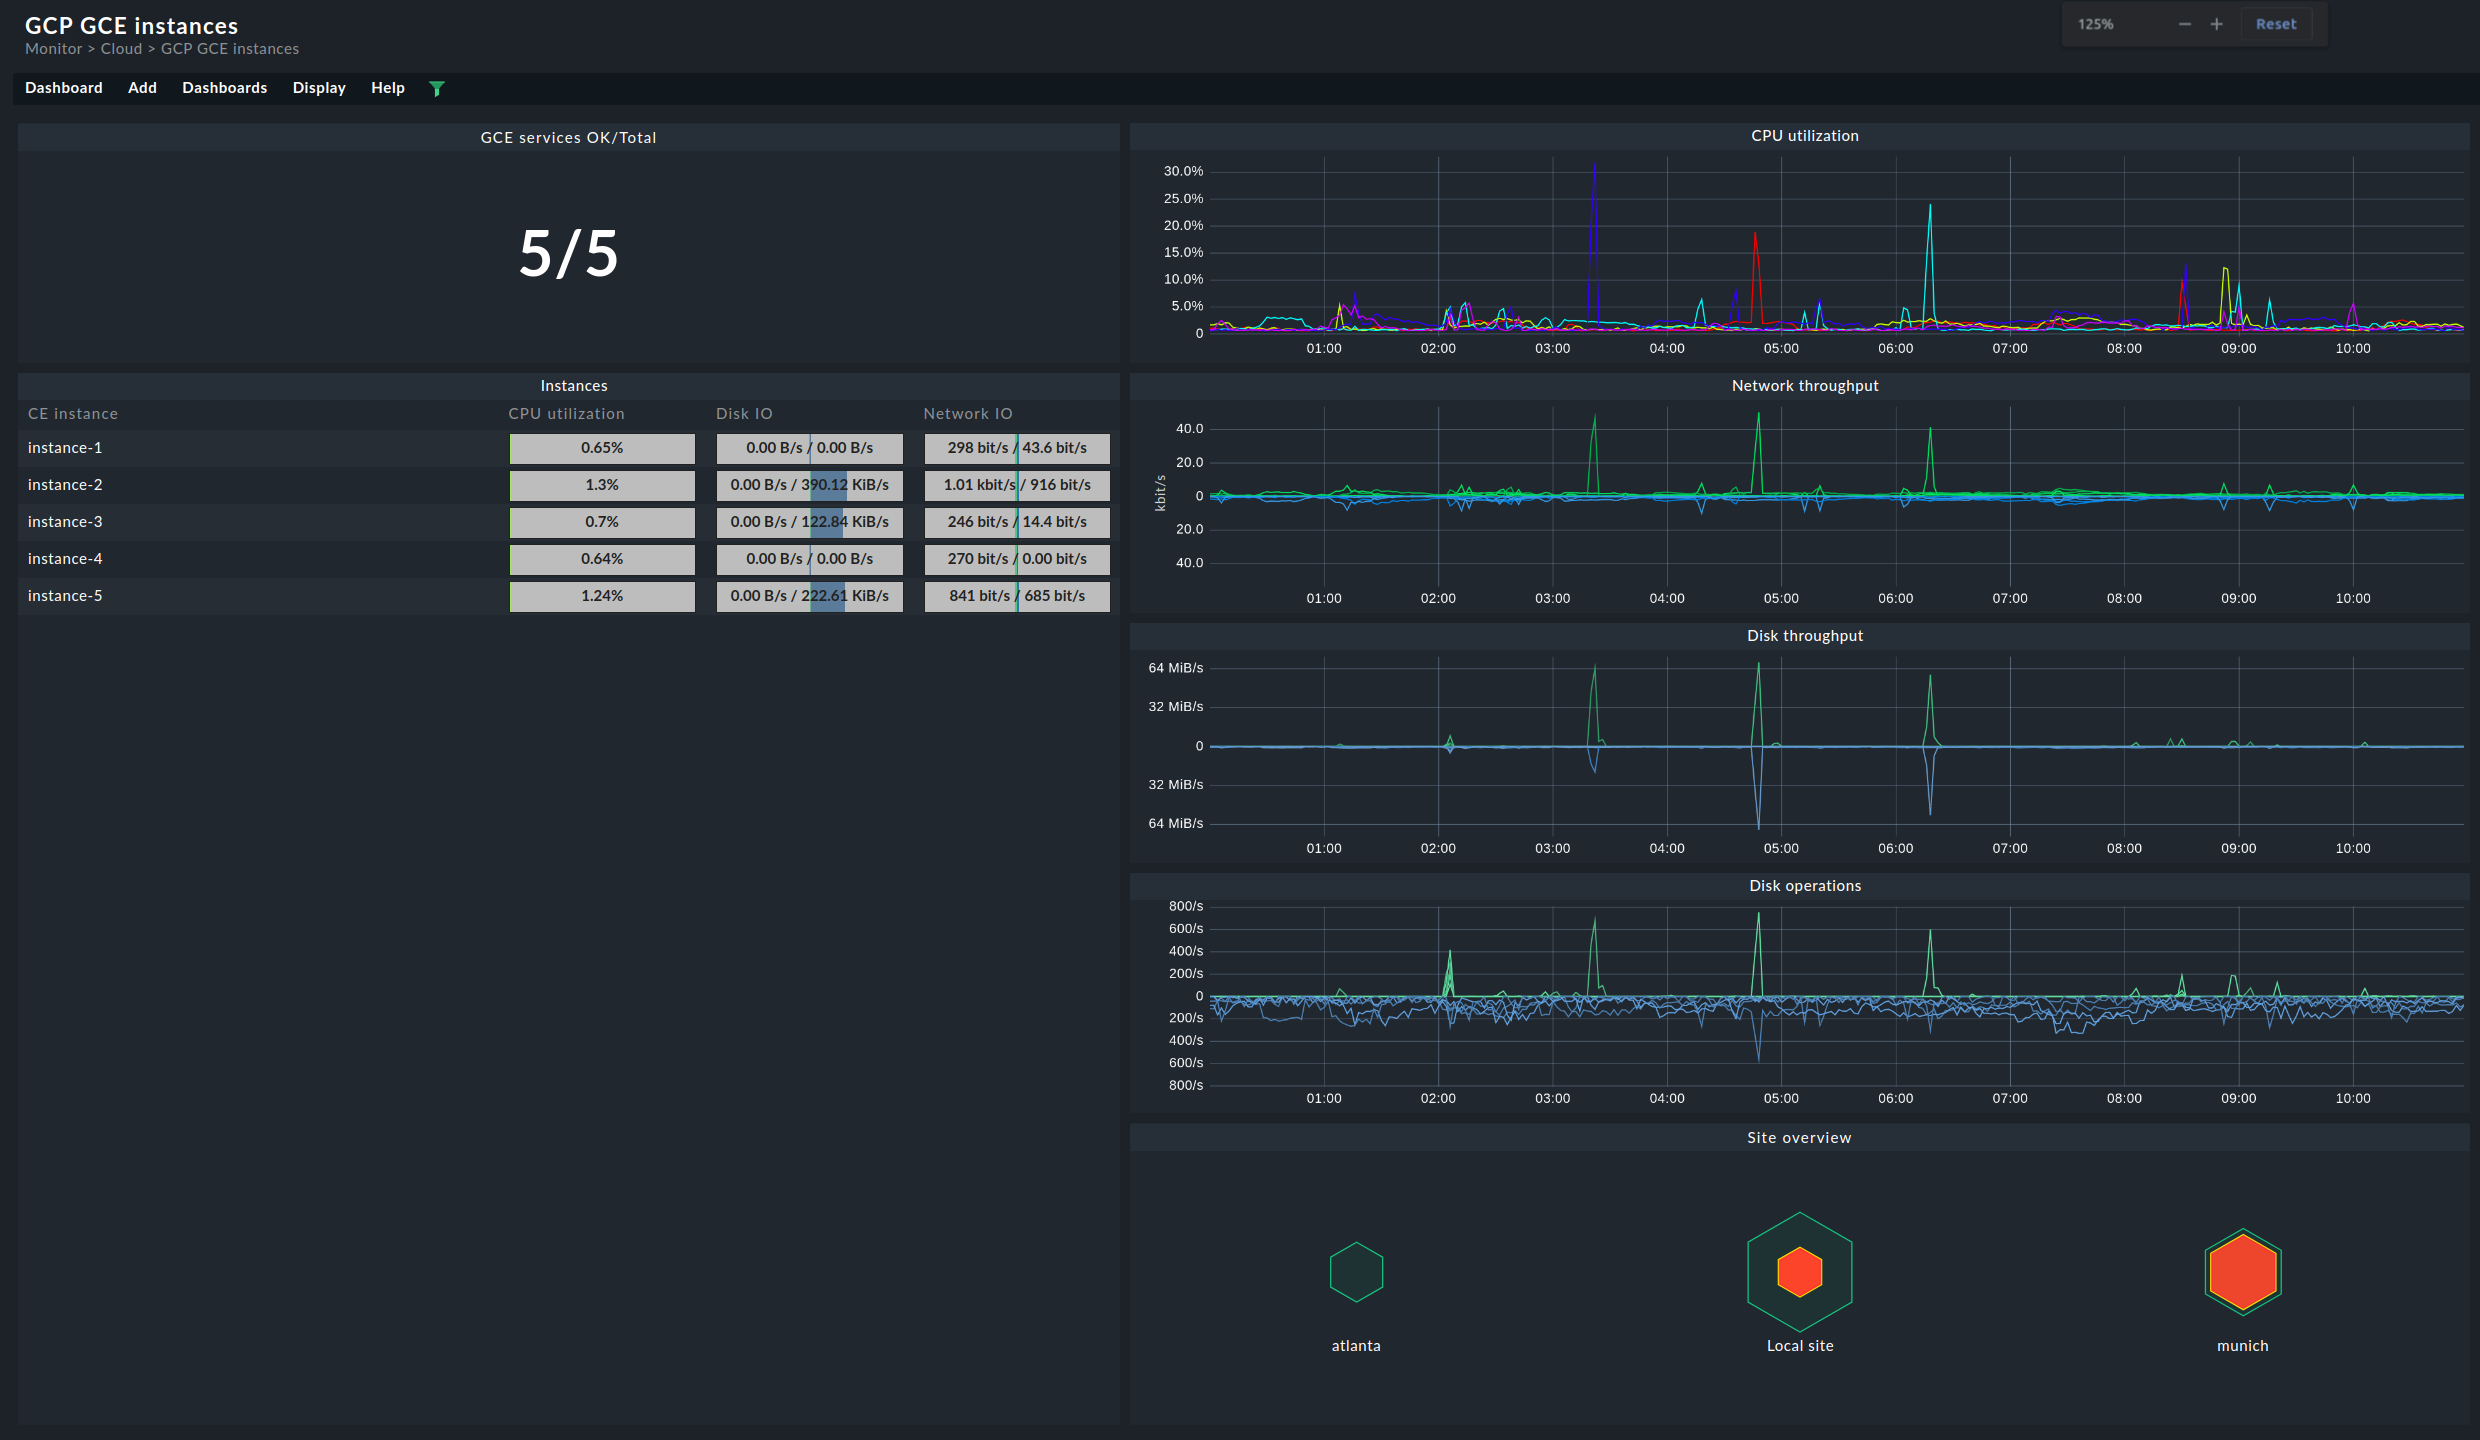
![]() For a convenient start into monitoring GCP, Checkmk ships in Checkmk Ultimate
the two built-in dashboards, GCP GCE instances and GCP storage buckets.
Both of these can be found as menu items in the monitoring under Monitor > Cloud.
For a convenient start into monitoring GCP, Checkmk ships in Checkmk Ultimate
the two built-in dashboards, GCP GCE instances and GCP storage buckets.
Both of these can be found as menu items in the monitoring under Monitor > Cloud.
To provide a clearer impression, following are two examples of how these dashboards are structured. First, the Compute Engine instances dashboard, where you can compare the current state on the left and the chronological history for the most important metrics on the right:
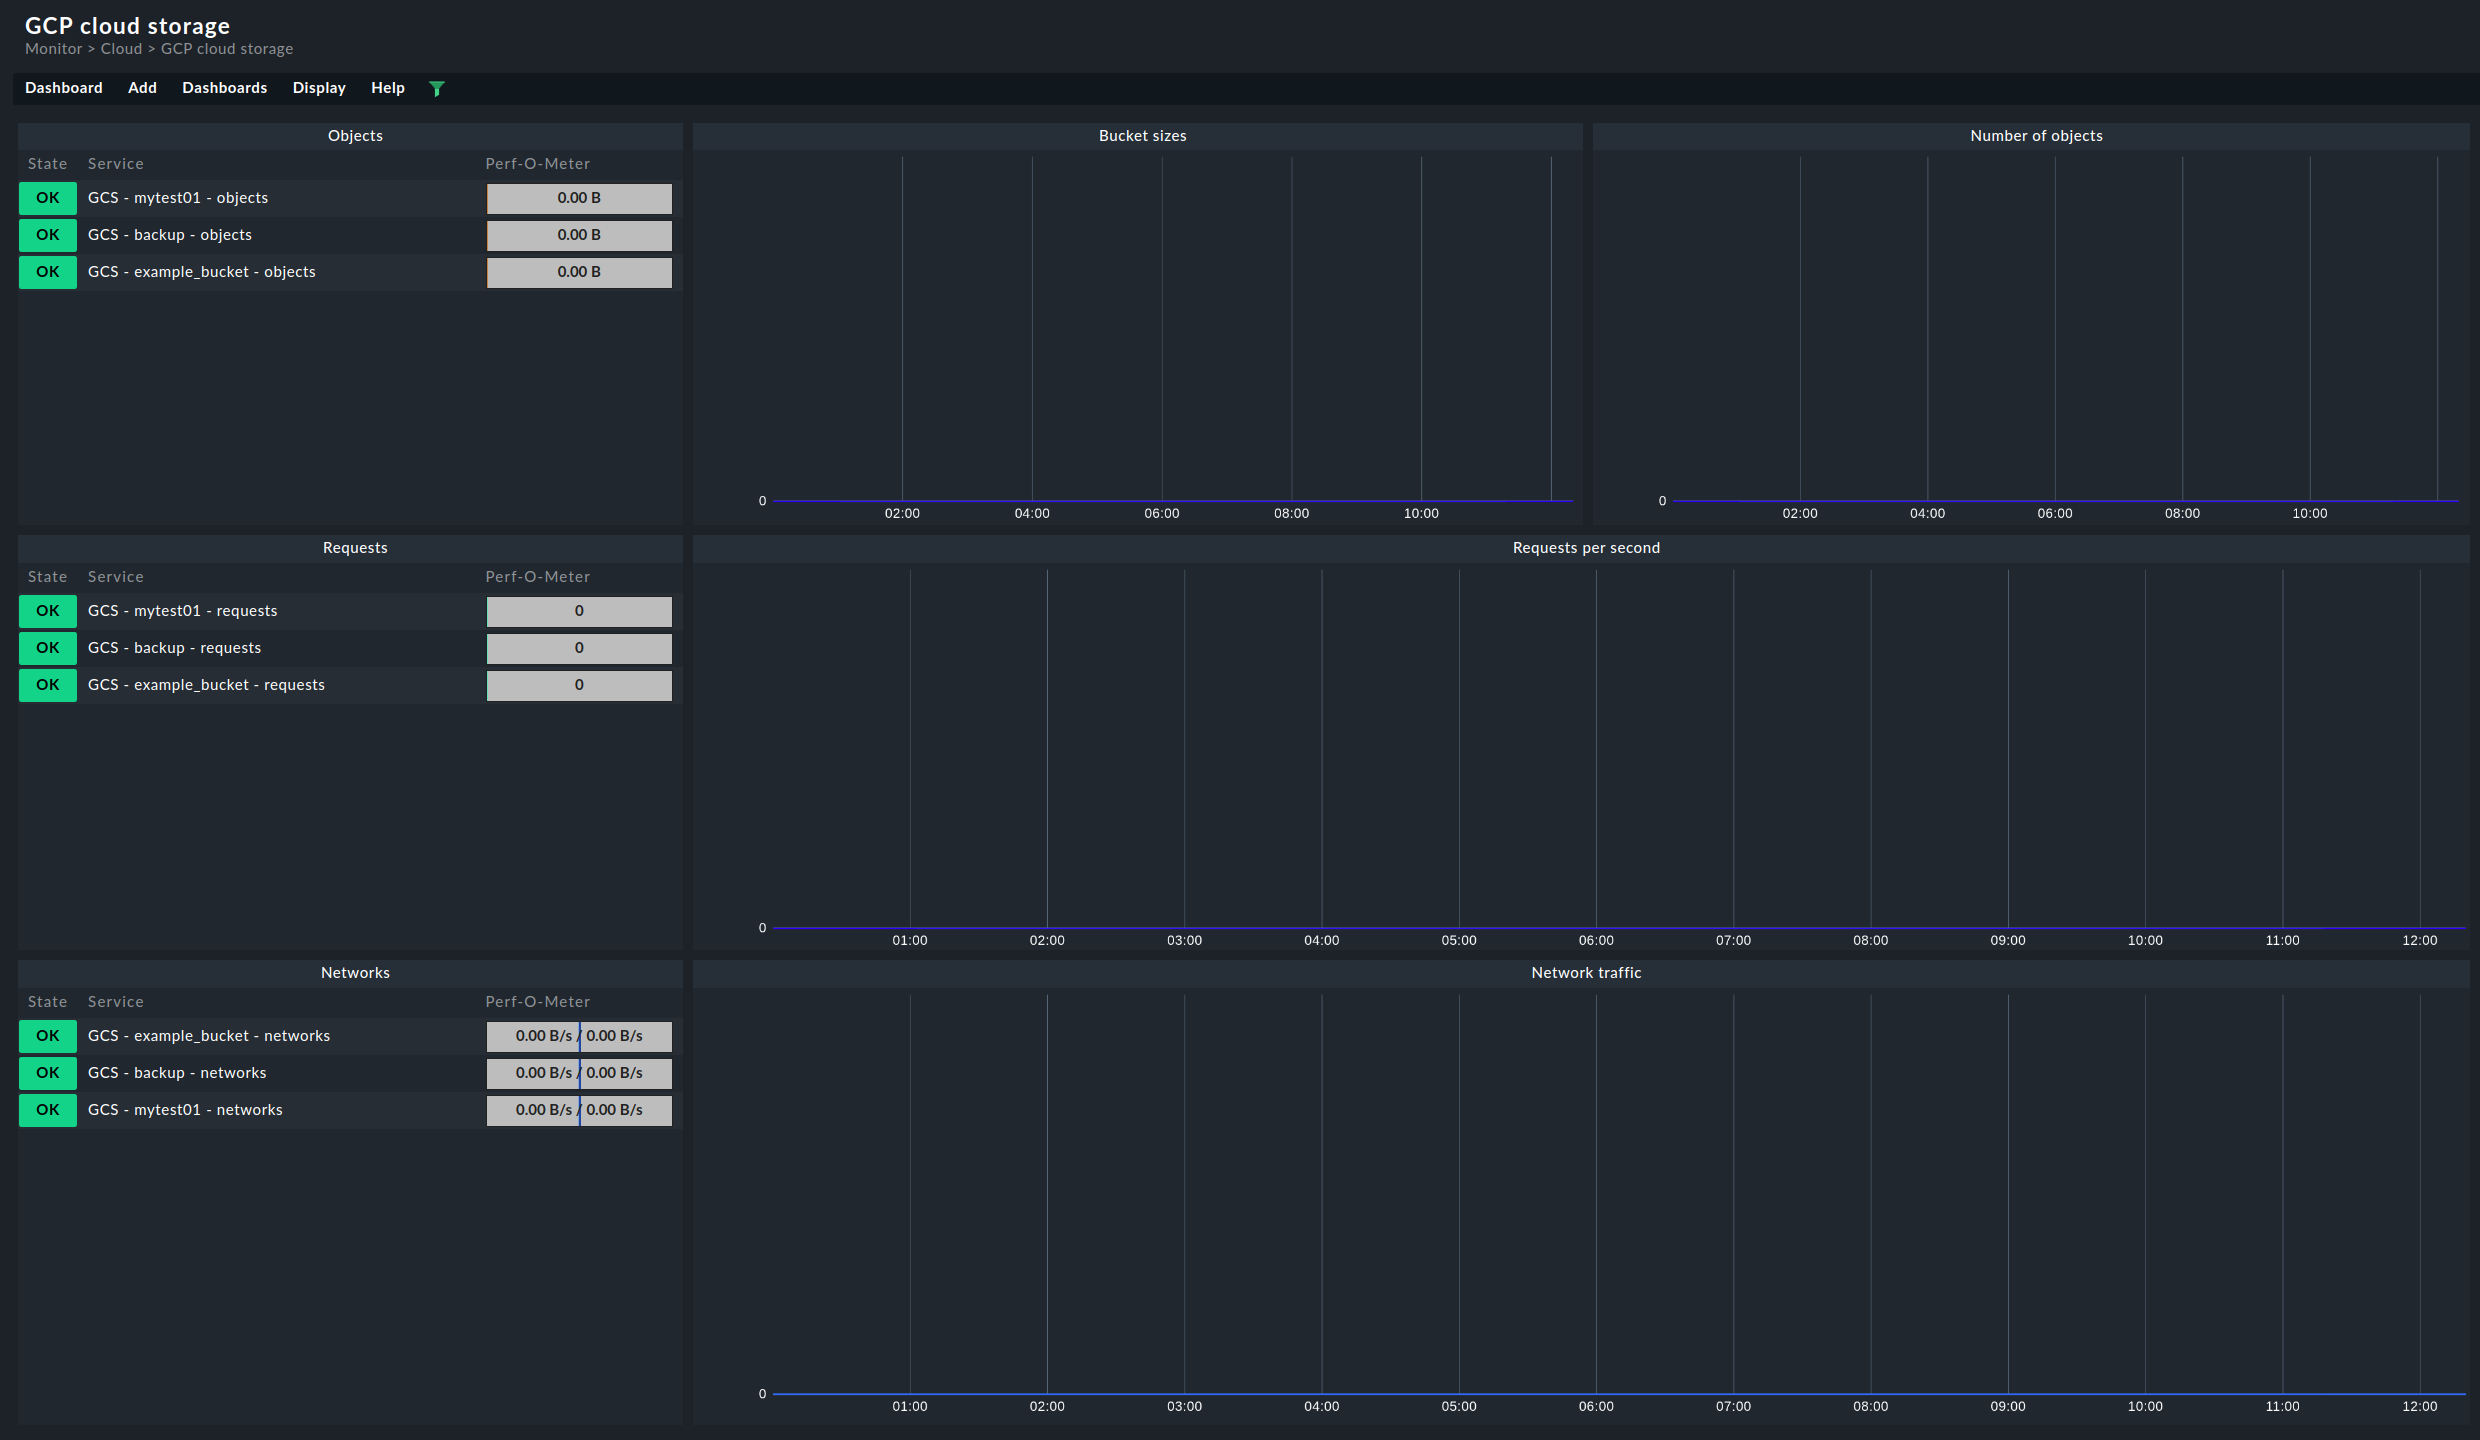
The dashboard for the storage buckets is structured in a very similar way. On the left-hand side, you will find the current data for the respective buckets. On the right, the most important metrics are again displayed chronologically: