1. Introduction
Kubernetes has been the most widely used tool for container orchestration for quite some time. Checkmk supports you in monitoring your Kubernetes environments. At the node level and from the cluster level down to individual pods, you can monitor all important objects of your workloads. For a complete listing of all of the check plug-ins available for monitoring Kubernetes, please see our Catalog of check plug-ins.
1.1. Supported distributions and versions
Starting with version 2.2.0, Checkmk supports the following distributions and Kubernetes services:
Vanilla Kubernetes
Amazon Elastic Kubernetes Service (Amazon EKS)
Azure Kubernetes Service (AKS)
Google Kubernetes Engine (GKE) incl. Autopilot mode
Tanzu Kubernetes
We support four released (minor) versions of Kubernetes simultaneously at any given time. This may also include versions of Kubernetes that are no longer part of the (vanilla) Kubernetes lifecycle. Above all, this ensures seamless integration with cloud providers that also offer extended support periods for their Kubernetes services. Immediately after the release of a new version of Kubernetes, it may take some time — depending on the scope of the changes and the timing — before it is fully supported in Checkmk. As soon as Checkmk can work seamlessly with this new version, we will announce this in a Werk.
1.2. Getting started with Kubernetes monitoring
For an introduction to the new monitoring of Kubernetes, we recommend our two videos Kubernetes Monitoring with Checkmk and Detecting issues and configuring alerts for Kubernetes clusters.
1.3. Structure of the monitoring environment
Since Kubernetes clusters can quickly undergo major changes in terms of the number and location of individual components, we recommend creating a separate site for monitoring your Kubernetes environment. You can then connect this site to your central site as usual via distributed monitoring.
1.4. The process of monitoring Kubernetes in Checkmk
Checkmk monitors your Kubernetes clusters in two ways:
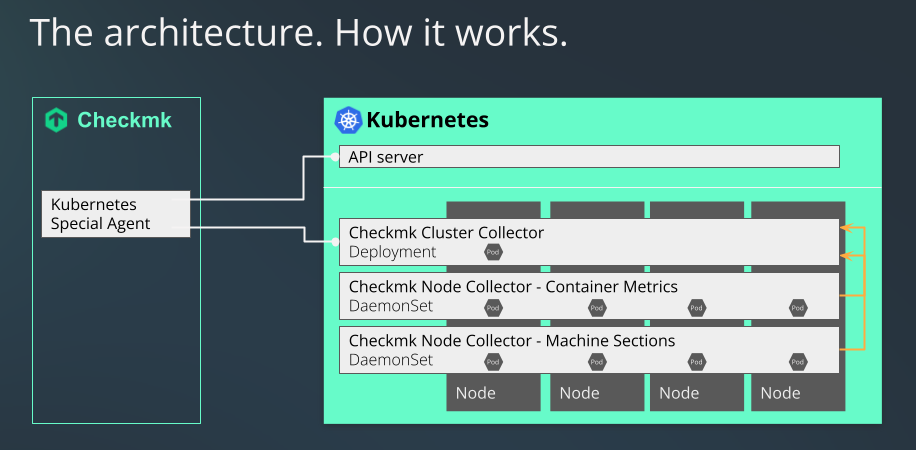
The Kubernetes special agent simply retrieves basic information via your cluster’s API server. This can already be used to retrieve the states of nodes and containers. Most of the metadata of your pods and deployments are also obtained in this way.
For a comprehensive monitoring, however, something is still missing up to this point. Questions such as how much load a particular deployment generates on the CPU, or how much memory a DaemonSet is currently using cannot be answered in this way.
This is where our Checkmk Node Collector and our Checkmk Cluster Collector come into play. These are an indispensable part of Kubernetes monitoring within Checkmk. A not insignificant part of what follows in this article is thus also about installing and setting these up. In addition, the use of the Kubernetes dashboards in the commercial editions only makes sense if the Node and Cluster Collectors can provide data on the loads for this.
1.5. Differences compared to other monitoring in Checkmk
When monitoring pods and replicas in your Kubernetes clusters, status changes or delays sometimes occur much more frequently. To account for this, the checks for certain states of these objects only change their status in Checkmk after 10 minutes.
2. Creating prerequisites in the cluster
To be able to monitor your Kubernetes cluster in Checkmk, first create the prerequisites in your cluster. First and foremost, tell the cluster which pods/containers to deploy and how to configure them.
2.1. Setting up the Helm repository
The installation of Kubernetes monitoring is done with the help of the helm tool.
Helm is also suitable for less experienced users and standardizes the management of configurations.
Helm is a kind of package manager for Kubernetes.
If you are not yet using Helm, you can usually get it from your Linux distribution’s package manager or from the Helm project website.
You can use Helm to include repositories as sources and easily add the Helm charts that these contain to your cluster in the same way as packages.
First of all, identify the repository.
In the following example, we use the name checkmk-chart to make it easier to access the repository later.
You can, of course, also use any other name of your choice:
We update our Helm charts whenever new developments in Kubernetes require it.
It is therefore worth checking from time to time whether new versions are available in the repository.
If you have named your local copy of our repository checkmk-chart, as in the previous command, you can use the following command to display all versions of the charts available in the repository:
If a newer version is available you can update with helm repo update.
2.2. Customizing the configuration to your environment
Since we cannot know in advance how your Kubernetes cluster is structured, we have chosen the safest variant for how the Cluster Collectors are started: By default, you do not provide any ports that can be accessed remotely. In order to be able to access the collectors later, you will need to adapt these settings to your particular cluster.
We support two communication paths by default: the query via Ingress and the query via NodePort. The configuration of these will vary depending on which variant you support in your cluster.
In order to be able to determine certain parameters yourself across all configurations, you include a control file, the so-called values.yaml.
There are two ways to create such a values.yaml.
You can either extract the file supplied by us in the Helm charts and edit it, or you can simply create a minimal version yourself.
Whenever you want to deploy changes to this file in your cluster, you can again use the Helm chart installation command that we will cover later in this article.
Creating your own basic values.yaml
You can create a values.yaml in which you only enter the values that you want to modify.
In our Helm chart, for example, the Cluster Collector’s service type is set to ClusterIP by default.
If you now only want to change this service type to NodePort and the port to 30035, it is sufficient to simply create a values.yaml as follows:
An activation of Ingress could look like this:
Extracting values.yaml from Helm charts
Checkmk provides a complete values.yaml file which can be extracted from the Helm chart using the following command:
You can now adapt the file created in this way to suit your needs and pass it to helm with the -f values.yaml parameter during the installation, or during a later upgrade.
Providing communication via Ingress
If you use Ingress to control access to your services, edit the already prepared parts in values.yaml accordingly.
For a better overview, only the relevant part is shown in the following abbreviated example.
Set the parameter enabled to true.
Adapt the remaining parameters according to your environment:
Providing communication via NodePort
You can also provide access to the services directly via a port.
This is necessary if you do not use Ingress.
In the following example, only the relevant section is shown.
You set the value type to NodePort and remove the comment for the value nodePort:
Configuring the Cluster Collector for HTTPS
If you want to switch the communication with and between the Cluster Collectors to HTTPS, you must also make changes in the values.yaml file.
Below is the section in our supplied values.yaml that you need to edit to enable HTTPS:
In the lines beginning with enabled or verifySsl, you must replace false with true.
Next, remove the hash marks before the three sections clusterCollectorKey, clusterCollectorCert and checkmkCaCert and insert the corresponding data following these.
Your organization should determine whether to use self-signed certificates or to obtain certificates from a Certificate Authority (CA).
Please note that the certificates must fulfill the following requirements:
The CA certificate must contain the host name or the name of the Ingress as FQDN.
For the server certificate, the FQDN must correspond to the following pattern:
<service_name>.<namespace>.cluster.local.In the
[ v3_ext ]section of the configuration file for generating your Certificate Signing Request, thesubjectAltNamemust match the following pattern:subjectAltName = DNS:<service_name>.<namespace>.cluster.local, DNS:<service_name>.<namespace>, IP:<service ip>
Using your own service account
Using our Helm charts, a service account would be created in your cluster by default.
If you already have a suitable service account, it is sufficient to add it into the values.yaml and suppress the creation of a new account.
Prerequisites for monitoring GKE Autopilot
If you operate your GKE (Google Kubernetes Engine) cluster in Autopilot mode, monitoring it with Checkmk is also possible, as Checkmk is a so-called Autopilot partner.
There are two more things that need to do be done before an Autopilot cluster can be monitored using Checkmk.
In the values.yaml file, you will find a gkeAutopilot section.
Set enabled to true here:
Below that, you will find the matchingAllowlist setting.
You don not have to change anything in this entry in values.yaml.
However, this allowlist still needs to be set up in your Autopilot cluster.
The easiest way to do this is with a so-called AllowlistSynchronizer, which you can set up in your cluster using the following command:
For details on these allowlists for privileged workloads and exactly what they entail, see the article at Control admission of privileged workloads in Autopilot mode in the GKE documentation.
Kubernetes in Rancher installations
If you want to monitor clusters that you manage with Rancher, you can also install the necessary workloads directly into your cluster using our Helm chart.
In values.yaml, you may need to explicitly specify the CRI socket for containerd.
For K3s and RKE2, this is often located at /run/k3s/containerd/containerd.sock.
Comment out the line starting with containerdOverride and customize the file path for your environment.
Configure the Pod Security admission controller
If you use Pod Security Standards in your cluster, you must set up the Checkmk Cluster Collector so that it has unrestricted access in the corresponding namespace. Ideally, create a namespace with the following spec:
You can create the namespace by running, e.g. kubectl apply -f namespace.yaml.
Keep in mind that you then do not need to use the option --create-namespace when you execute the helm upgrade command later.
If the Cluster Collector is already running or the namespace already exists, you can also set the above labels with the following command:
Pod Security Policies and network policies
The PodSecurityPolicy (PSP for short) and NetworkPolicy policies are included in our Helm chart primarily for compatibility reasons.
Since PSP have now been removed entirely from Kubernetes as of v1.25, we have disabled them by default as of version 1.3.0 of our Helm chart.
The corresponding section now looks like this:
If you still use the PSP in your cluster, it is necessary to set this option to true in the values.yaml:
If – at a later time – we find that this entry is not processed correctly even when disabled, we will remove it entirely.
The same applies to the NetworkPolicy.
If you use this in your cluster, you will need to change the location in values.yaml from enabled: false to enabled: true.
In this situation, please refer to the following documentation within values.yaml to configure the NetworkPolicy correctly.
2.3. Installing Helm charts
After customizing values.yaml or creating your own, use the following command to install all of the necessary components into your cluster to be able to monitor it in Checkmk:
Since this command is not self-explanatory, we provide an explanation of the individual options below:
| Command element | Description |
|---|---|
|
This part is the basic command to send the configuration to the Kubernetes cluster. |
|
In Kubernetes, you always specify to which namespace the configuration should be added. You need this option if the namespace does not yet exist. Helm will create it in this case. |
|
This option specifies the namespace to which the configuration should be added. |
|
Here, |
|
The first part of this option describes the repository you previously created. The second part – after the slash – is the package that contains the information necessary to create the configuration for your Kubernetes monitoring. |
|
Finally, enter the configuration file that you created or adapted earlier. It contains all of the customizations to be included in the configuration files created with |
Once you have executed the command, your Kubernetes cluster is prepared for monitoring with Checkmk. The cluster will now take care of itself to ensure that the necessary pods and the containers they contain are running and accessible.
Helm chart output
So the next thing to do is to set it up in Checkmk.
To make this setup as easy as possible, we have equipped the output from our Helm charts with a whole series of commands.
This output also automatically conforms to the values you specified in the values.yaml file.
If you use the NodePort, you will get the commands to display the NodePort’s IP and port, among other things.
If instead you use Ingress, the output will be adapted accordingly.
In the following we show the – slightly abbreviated – output following a successful installation when using the NodePort:
From this output, simply copy the colored lines and execute the commands.
The first block shows you information about the NodePort:
This is exactly the address you need to enter in Checkmk later in the Kubernetes rule in the Collector NodePort / Ingress endpoint field.
With the commands from the next block you get both the token and the certificate for the service account.
The data is thus stored in the TOKEN and CA_CRT environment variables.
When outputting the CA_CRT variable, be sure to enclose it in inverted commas, otherwise the important line breaks in the certificate will be lost.
When setting up in Checkmk, you must store both the token and the the certificate. Leave the shell open with this information or copy the token and certificate to a location you can access during the following setup in Checkmk.
If you have executed the previous two export commands, you can use the last command to verify that the setup was successful:
At the beginning of the highly abbreviated output, for example, you can see the Cluster Collector’s version. Further down, metadata for all of the nodes in this cluster would follow.
3. Setting up the monitoring in Checkmk
Next, in Checkmk’s GUI, we move on to setting up the special agent and a rule for automatically creating hosts for your Kubernetes objects. To set up the special agent, however, a few prerequisites must first be met:
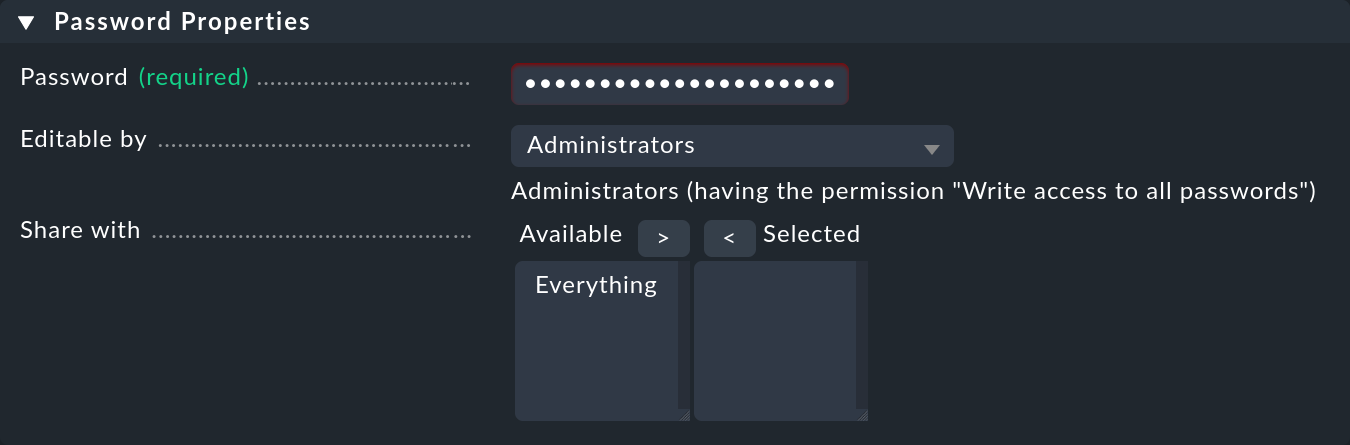
3.1. Storing the password (token) in Checkmk
It is best to store the password (token) for the service account in the Checkmk password store.
This is the safest option, as you can separate the storage and use of the password organizationally.
Alternatively, enter the password directly in plain text when creating the rule (see below).
For information on how to display the required password, see the Helm chart output.
Add the password to the Checkmk password store with Setup > General > Passwords > Add password e.g. under the ID and the title My Kubernetes Token:
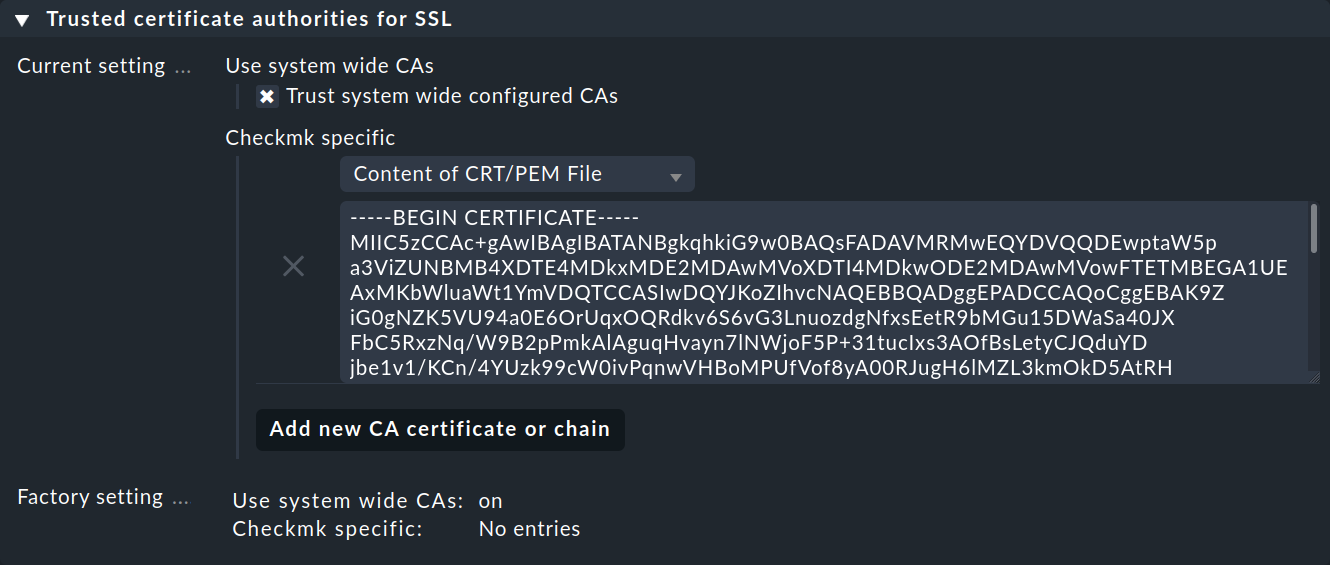
3.2. Importing a service account’s CA certificate into Checkmk.
In order for Checkmk to trust the service account’s Certificate Authority (CA), you must store the CA certificate in Checkmk.
How to display the required certificate is also in the Helm chart output.
Copy everything here including the lines BEGIN CERTIFICATE and END CERTIFICATE and add the certificate in the Setup menu under Setup > General > Global settings > Site management > Trusted certificate authorities for SSL:
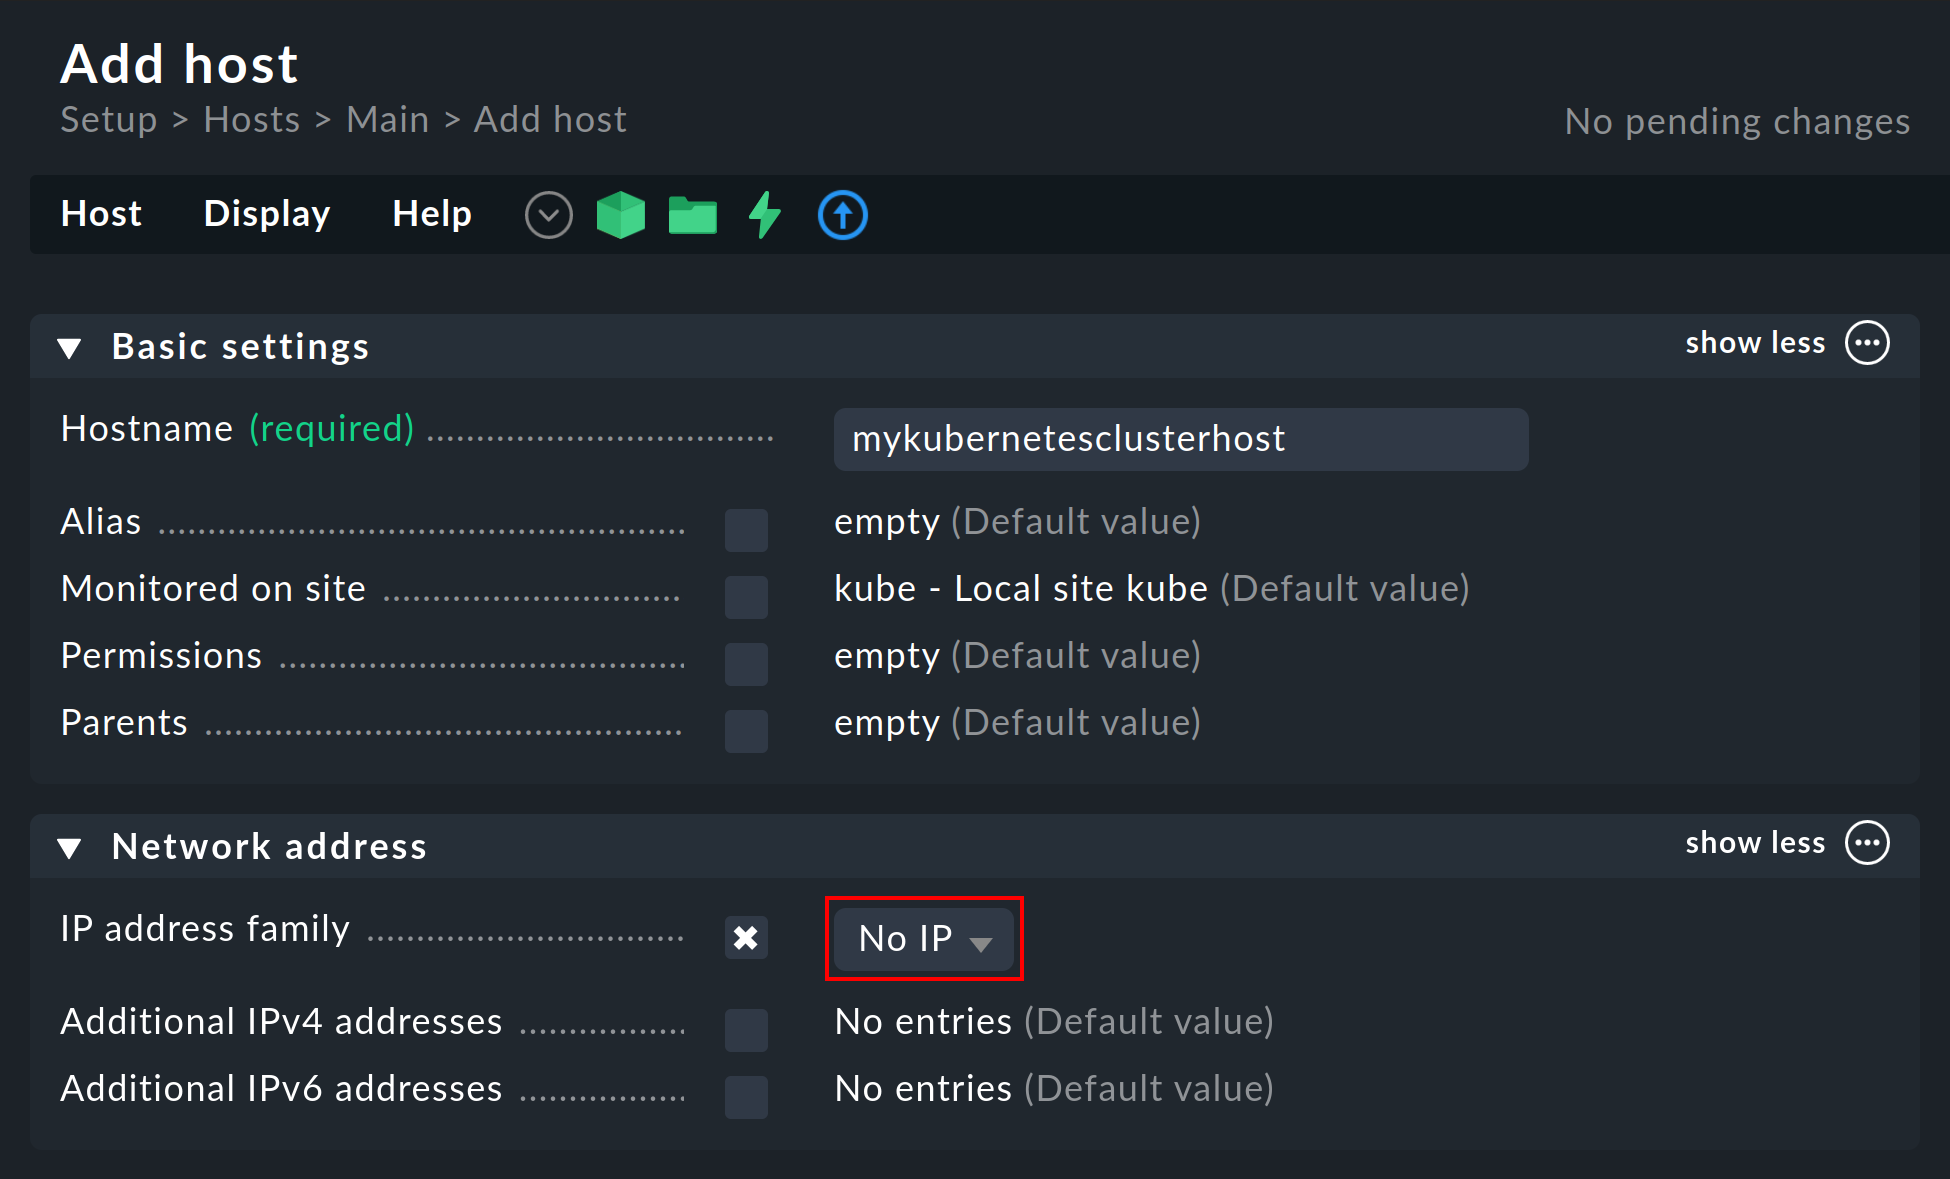
3.3. Creating a piggyback host
Create a new host in Checkmk in the usual way and name it mykubernetesclusterhost for example.
As the title and host name suggest, this host is used to collect the piggyback data and also to map all services and metrics at the cluster level.
Since this host only receives data via the special agent, be sure to set the IP address family option to No IP in the host’s properties.
3.4. Setting up dynamic host management
![]() To ensure separation between the objects of different Kubernetes clusters, it can be useful to create a folder per cluster via Setup > Hosts > Add folder, in which the dynamic host management can automatically create all hosts of a cluster.
However, creating or using such a folder is optional.
To ensure separation between the objects of different Kubernetes clusters, it can be useful to create a folder per cluster via Setup > Hosts > Add folder, in which the dynamic host management can automatically create all hosts of a cluster.
However, creating or using such a folder is optional.
Next, set up a connection in the commercial editions for the incoming piggyback data: with Setup > Hosts > Dynamic host management > Add connection. First enter a title and then click on show more under Connection Properties.
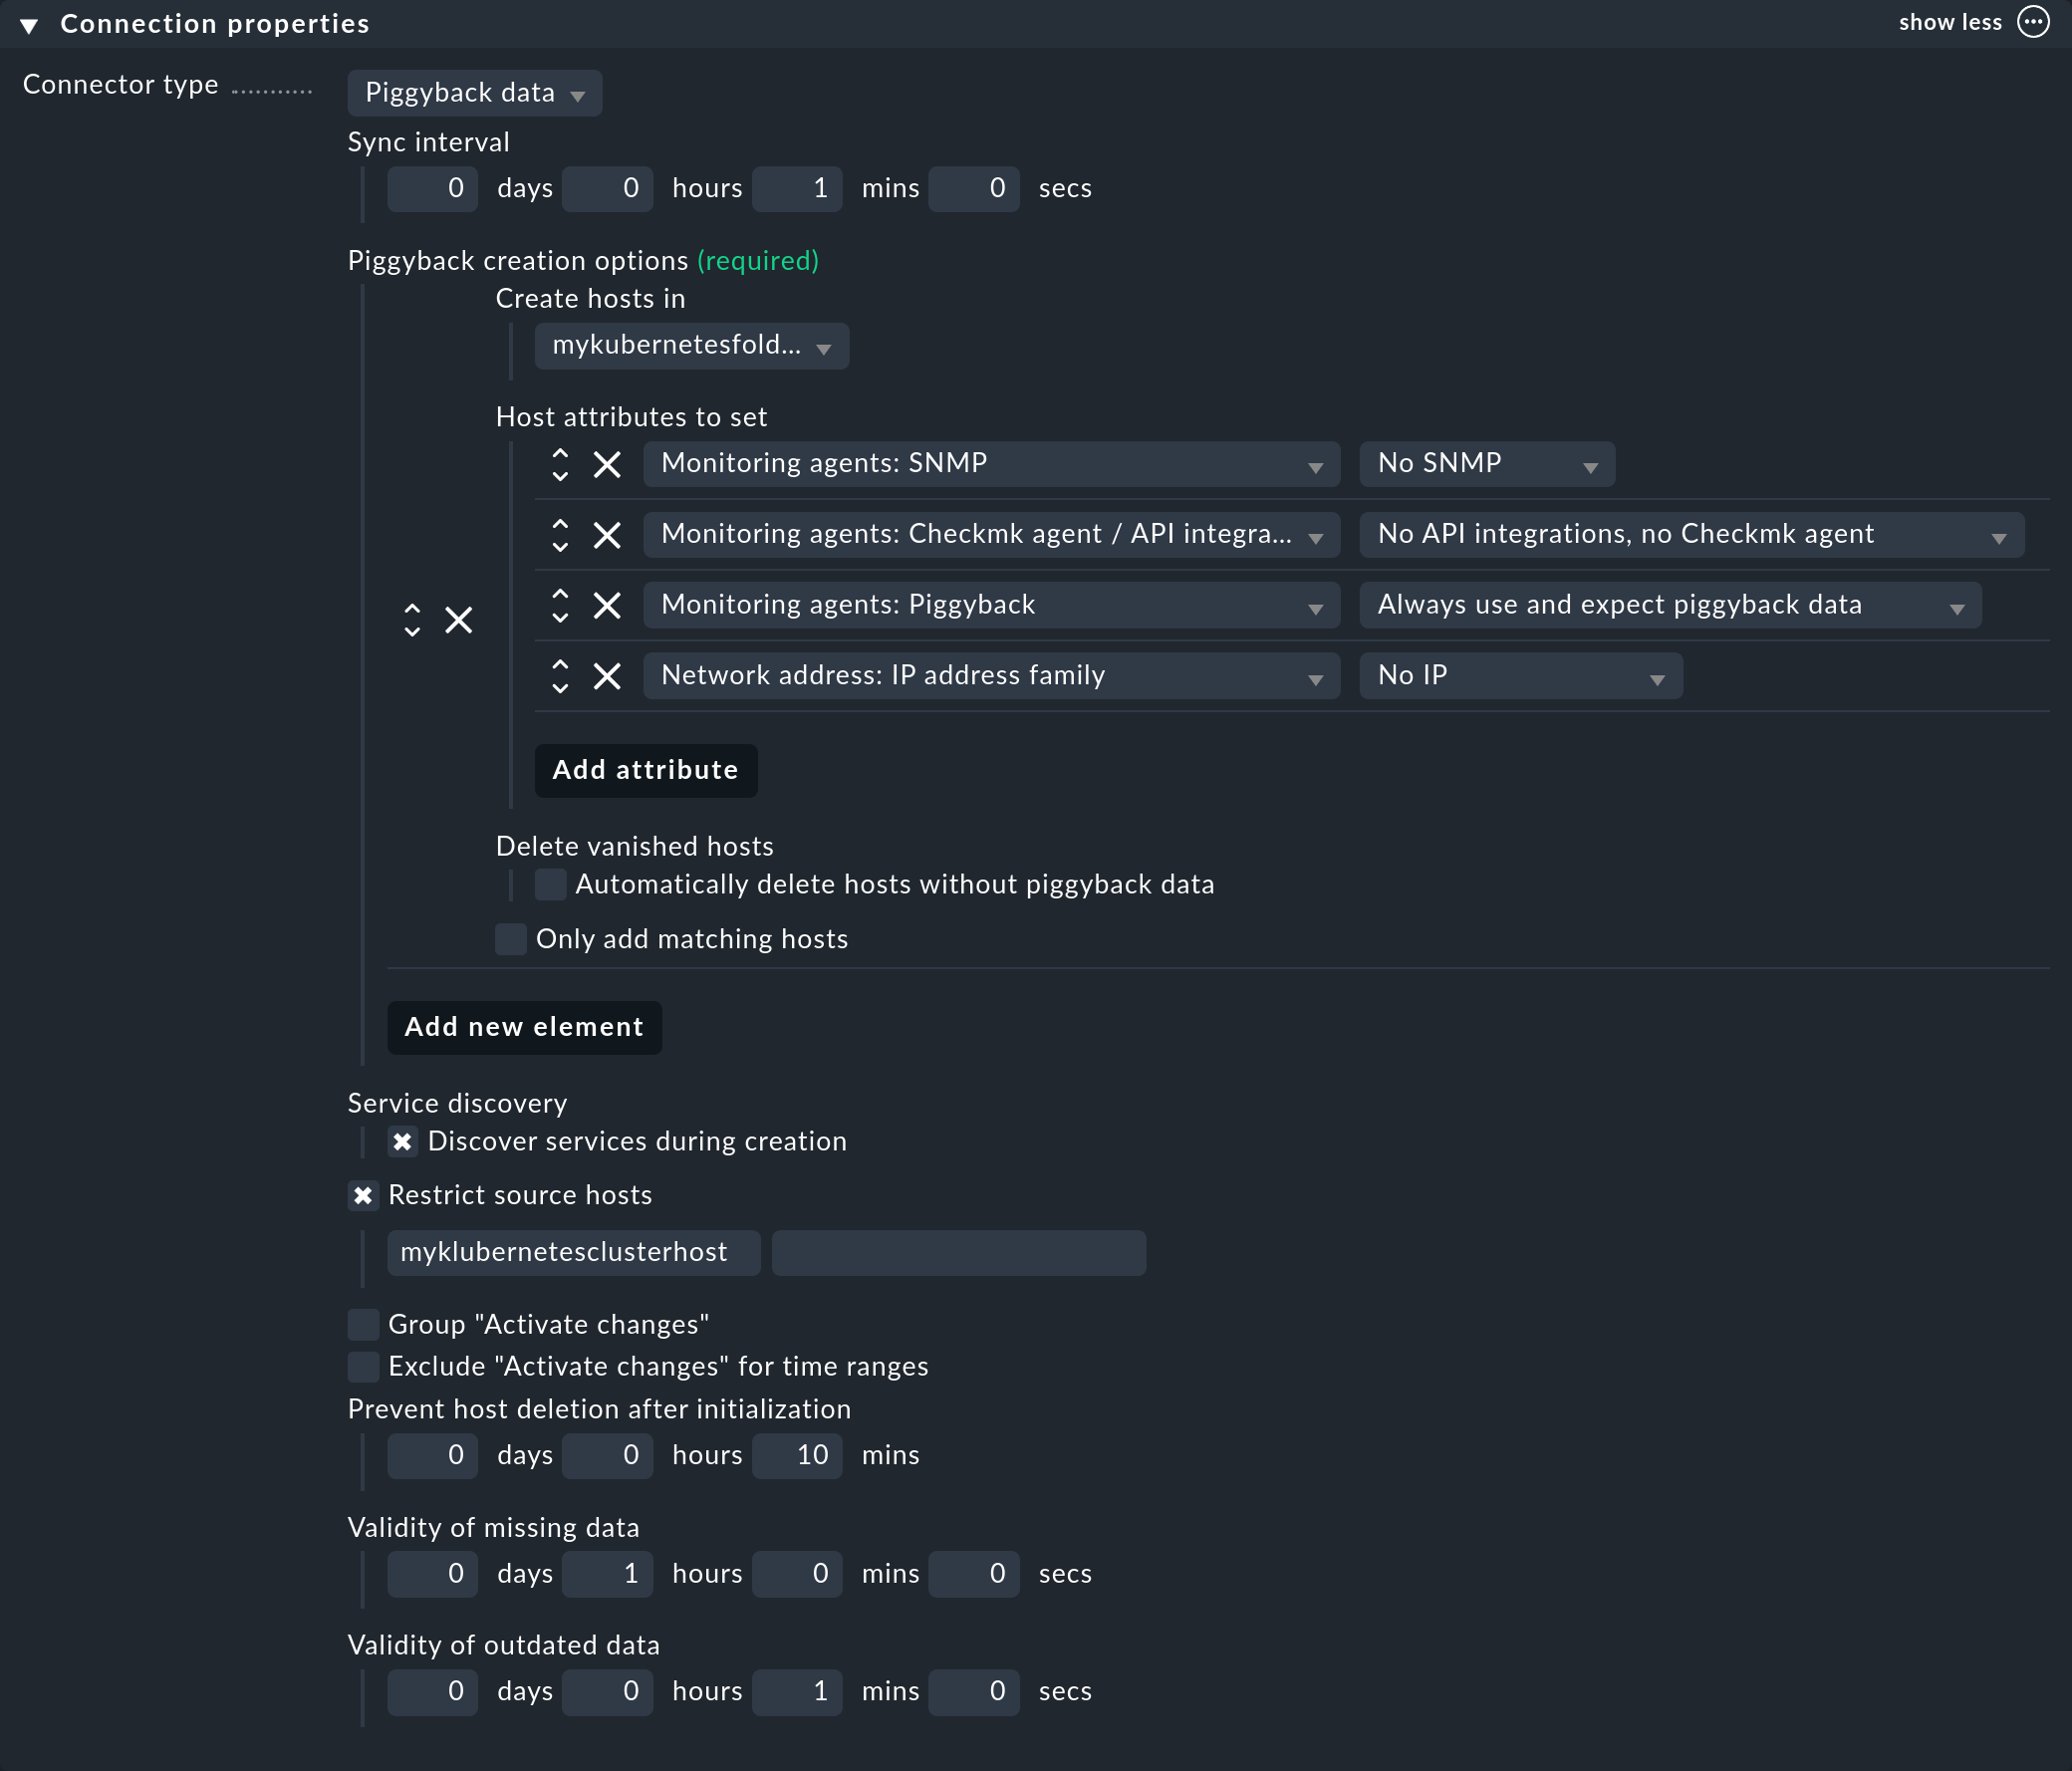
Next, click Add new element and select the previously created folder under Create hosts in.
Leave the default attributes under Host attributes to set as they are. They ensure that Checkmk only adheres to the piggyback data for the automatically created hosts and does not attempt to ping them or reach them via SNMP, for example.
In a Kubernetes environment where monitorable and monitored objects come and go continuously, it is also recommended to activate the option Automatically delete hosts without piggyback data. What exactly this option does and under which circumstances hosts are then actually deleted is explained in the chapter Automatic deletion of hosts in the article on dynamic host management.
Now enter the previously created piggyback host under Restrict source hosts and activate the option Discover services during creation.
The Connection Properties section of this new connection could then look like this:
3.5. Processing piggyback data in Checkmk Community
In Checkmk Community you will need to create the hosts for the accumulating piggyback data manually.
Because a large number of piggybacked hosts are likely to arise here in a Kubernetes cluster, we recommend using the cmk-piggyback list orphans command.
3.6. Customizing the periodic service discovery
By default, Checkmk performs a service discovery every two hours and displays the result from this discovery in the Check_MK Discovery service.
You can find this setting in the Periodic service discovery rule set.
In the context of Kubernetes, we recommend creating a rule for all hosts with the label cmk/kubernetes:yes.
This label is automatically given by Checkmk to every host that represents Kubernetes objects.
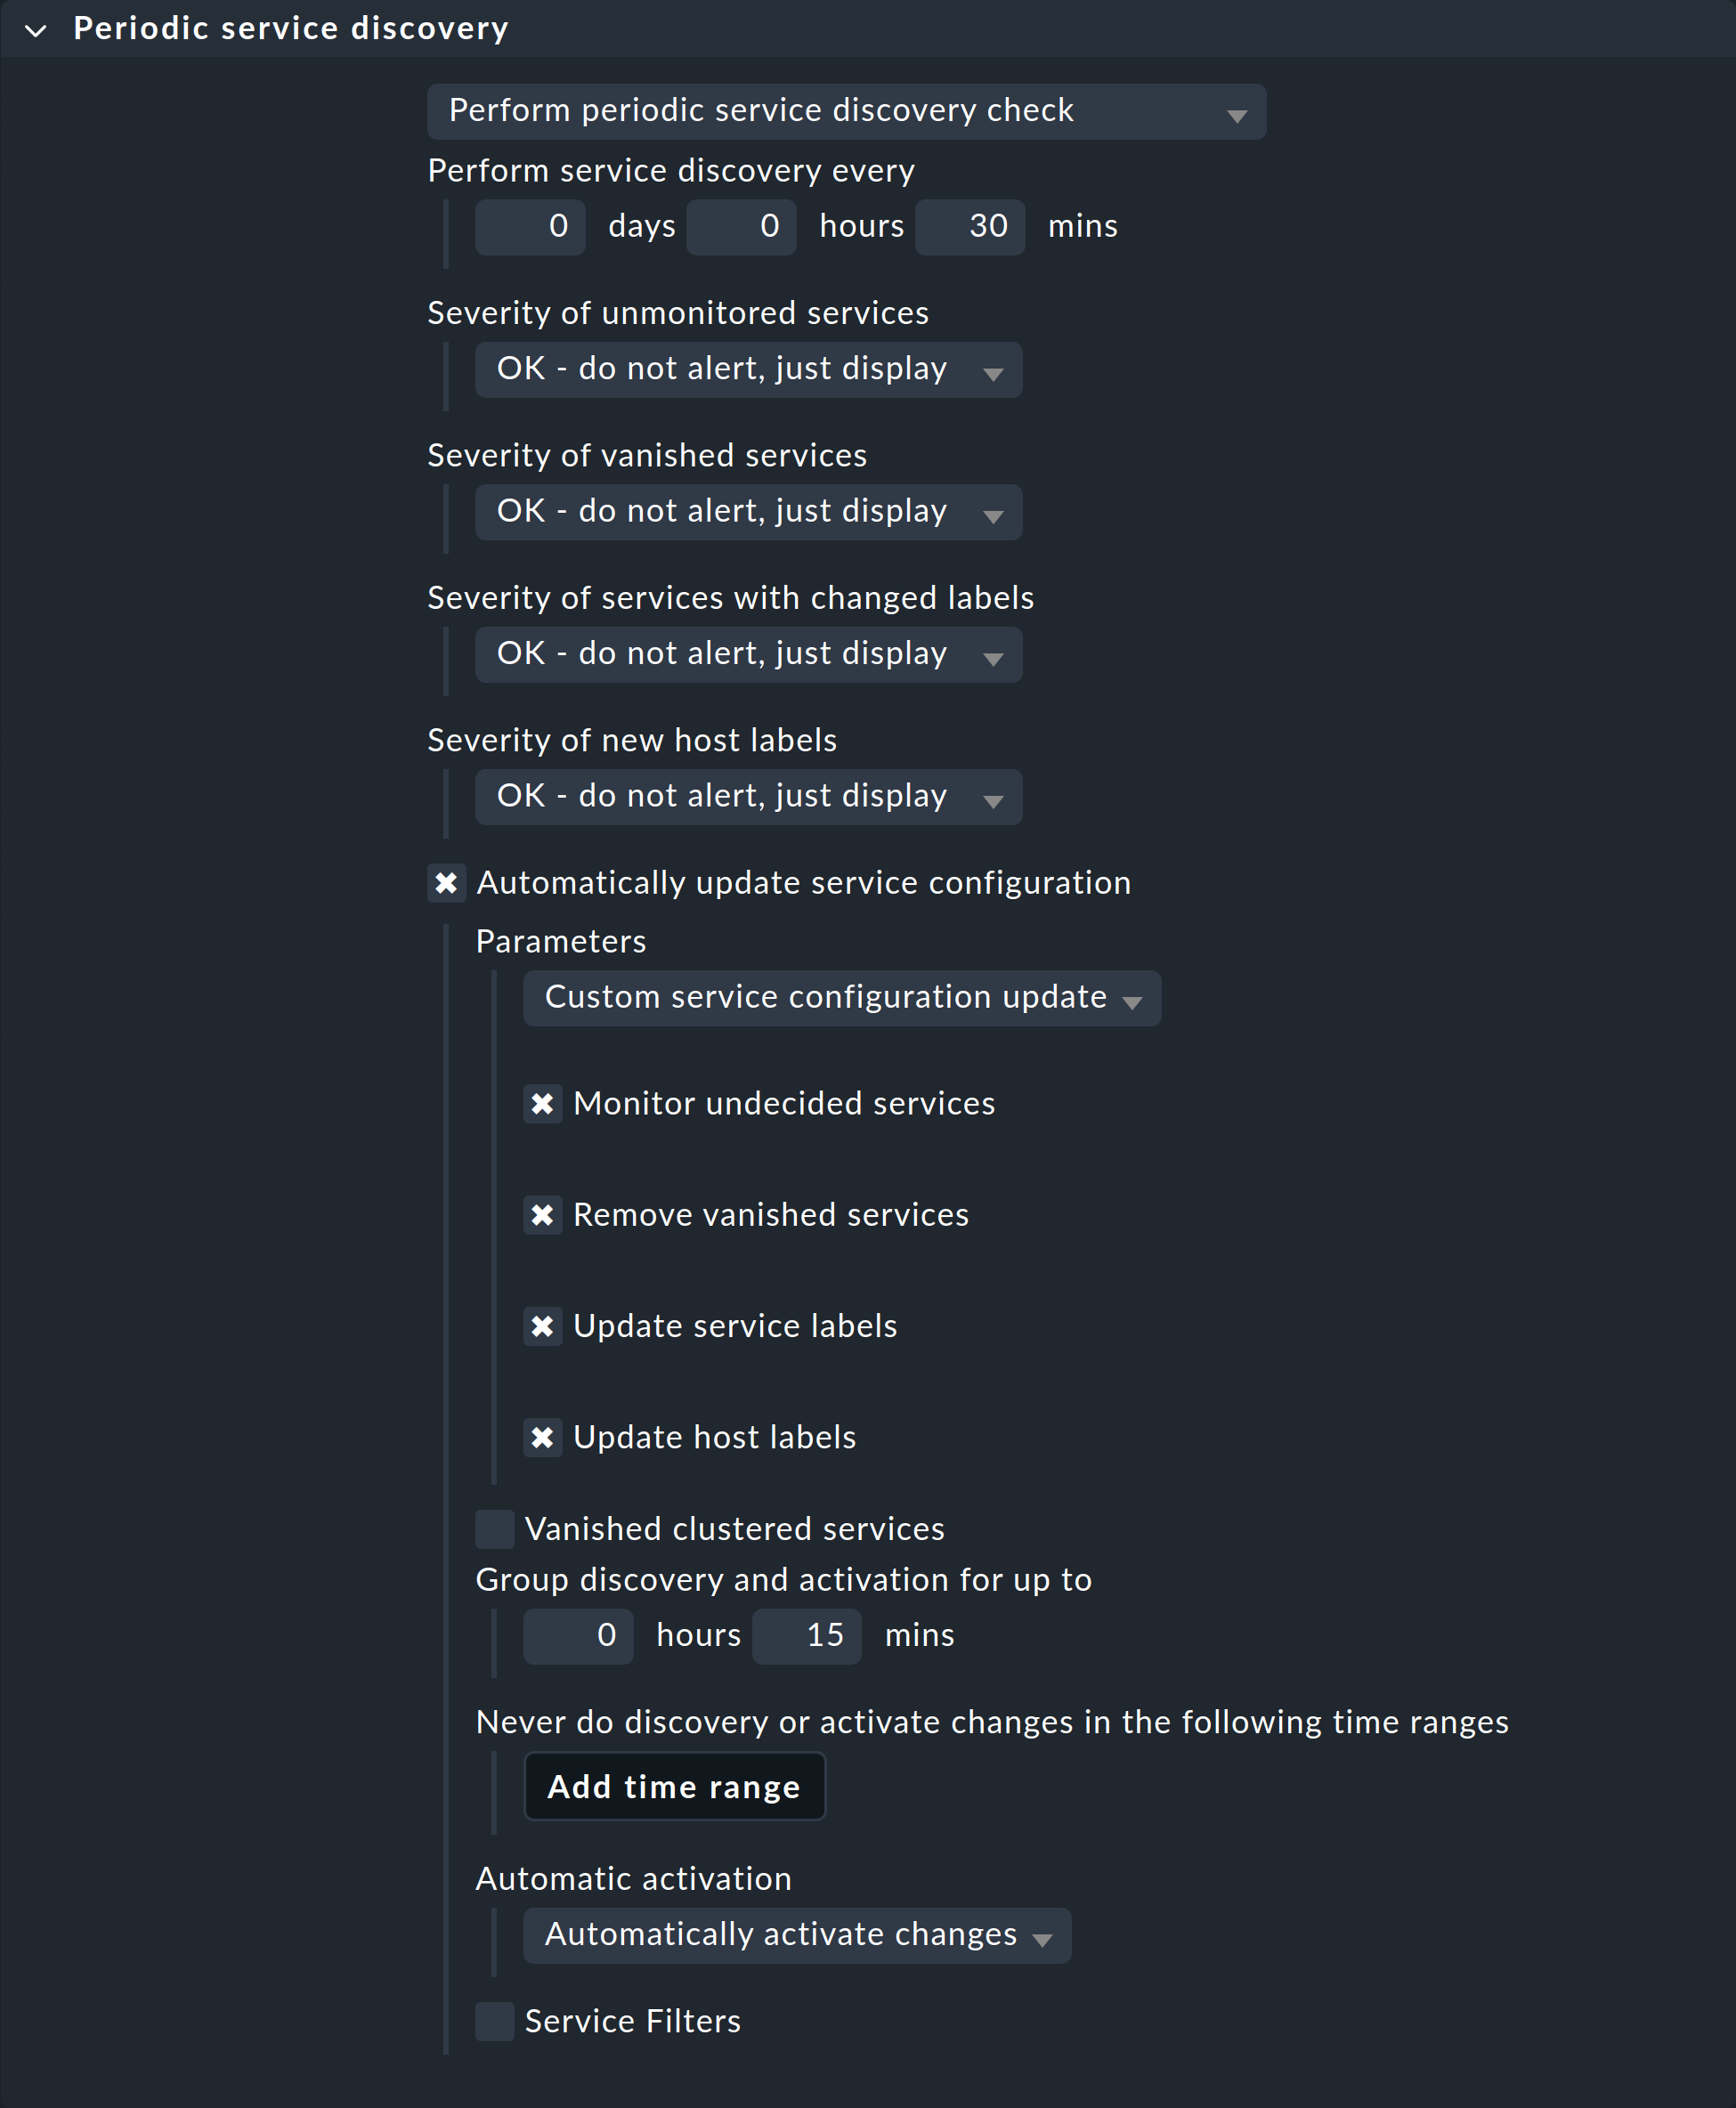
You should select a shorter interval for the service discovery here, and also activate the Automatically update service configuration option.
The settings in the following screenshot are only examples.
You will need to decide what makes sense for your clusters on a case-by-case basis.
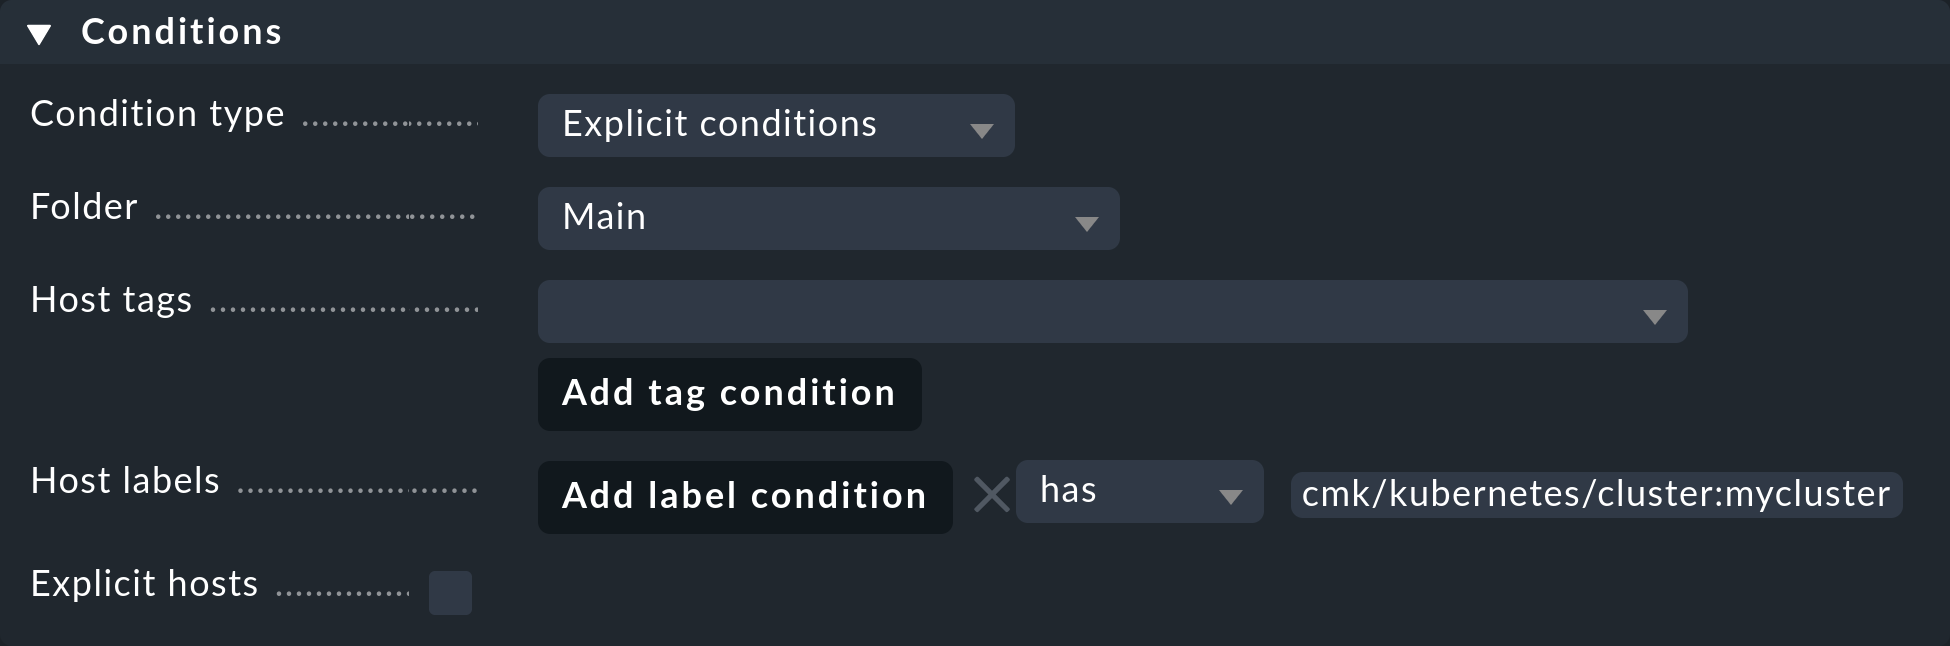
To restrict this rule to all of your cluster’s hosts, it is sufficient to enter cmk/kubernetes:yes in the Conditions under Host labels.
However, if you want to create individual rules for multiple clusters, simply use the respective cluster-specific label here.
These labels always have the form cmk/kubernetes/cluster:mycluster.
3.7. Setting up the special agent
Now that all the prerequisites have been created in the cluster and in Checkmk, you can turn your attention to the configuration of the special agent. You can find this via Setup > Agents > VM, cloud, container > Kubernetes. Create a new rule with Add rule.
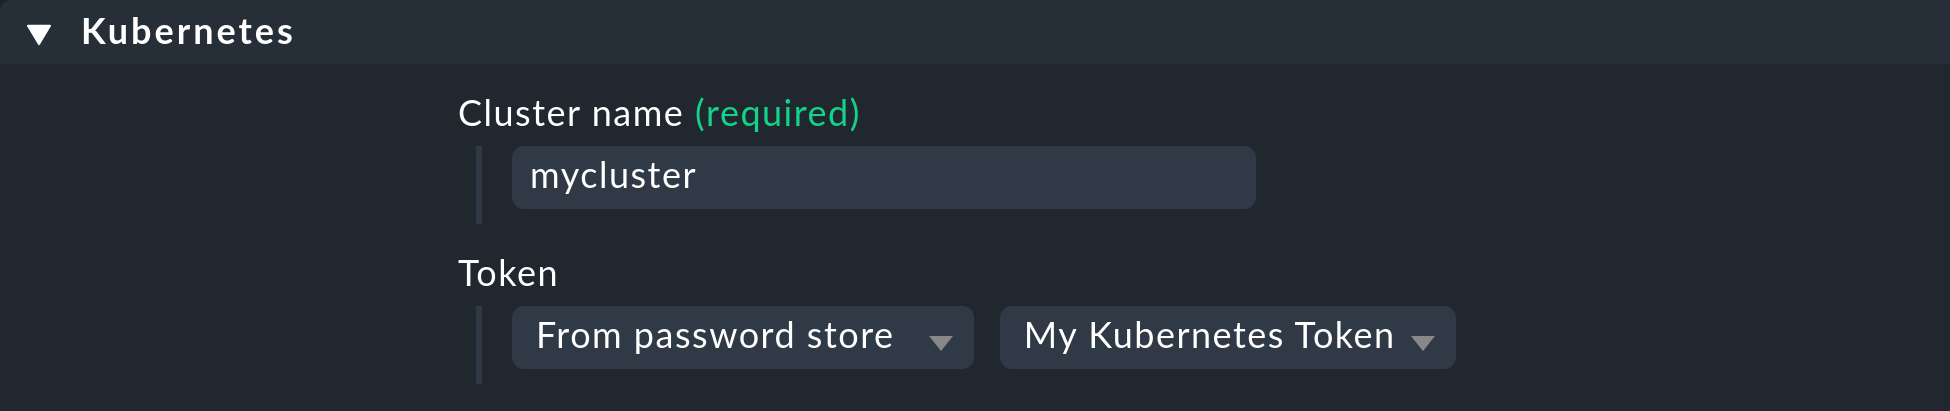
First of all, you must assign a name for the cluster to be monitored.
You can choose this name freely.
It is used to give a unique name to all objects that come from this particular cluster.
For example, if you enter mycluster here, the names of the hosts of all pods from this cluster will later begin with pod_mycluster.
The next part of the host name will then always be the namespace in which this Kubernetes object exists.
The host name of a pod could then be pod_mycluster_kube-system_svclb-traefik-8bgw7, for example.
Under Token, now select the previously created entry from the Checkmk password store.
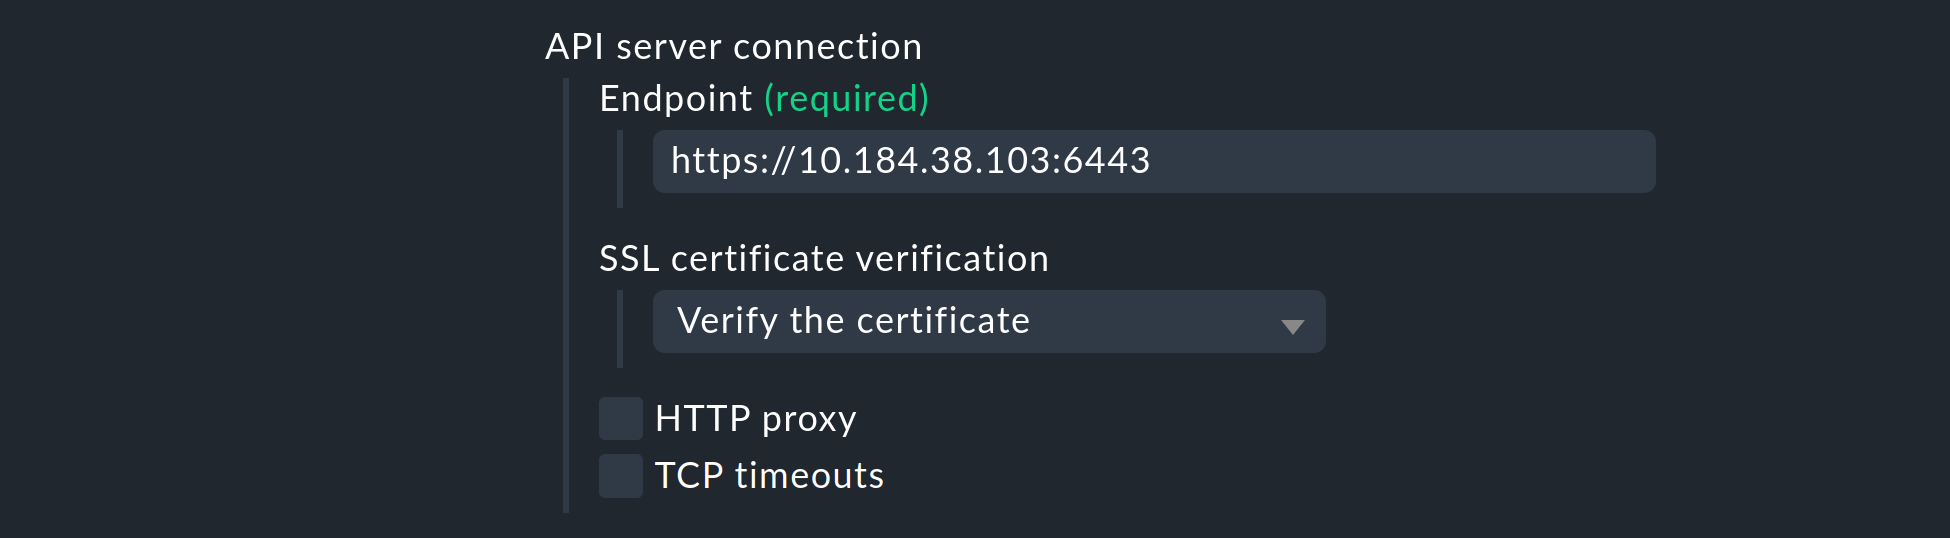
Under API server connection > Endpoint, Checkmk now asks you to enter the URL (or IP address) through which your Kubernetes API server can be accessed.
You only need to enter the port if the service is not provided via a virtual host.
The easiest way to find out this address – if you do not already have it at hand – will depend on your Kubernetes environment.
The following command will give you the API server’s endpoint in the server line:
However, the actual output of kubectl config view varies greatly.
If a port is also specified here in the server line, be sure to include it in the rule as well.
If you have so far followed these instructions step by step and have deposited your cluster’s CA certificate – as described above – in Checkmk, select under SSL certificate verification the Verify the certificate entry.
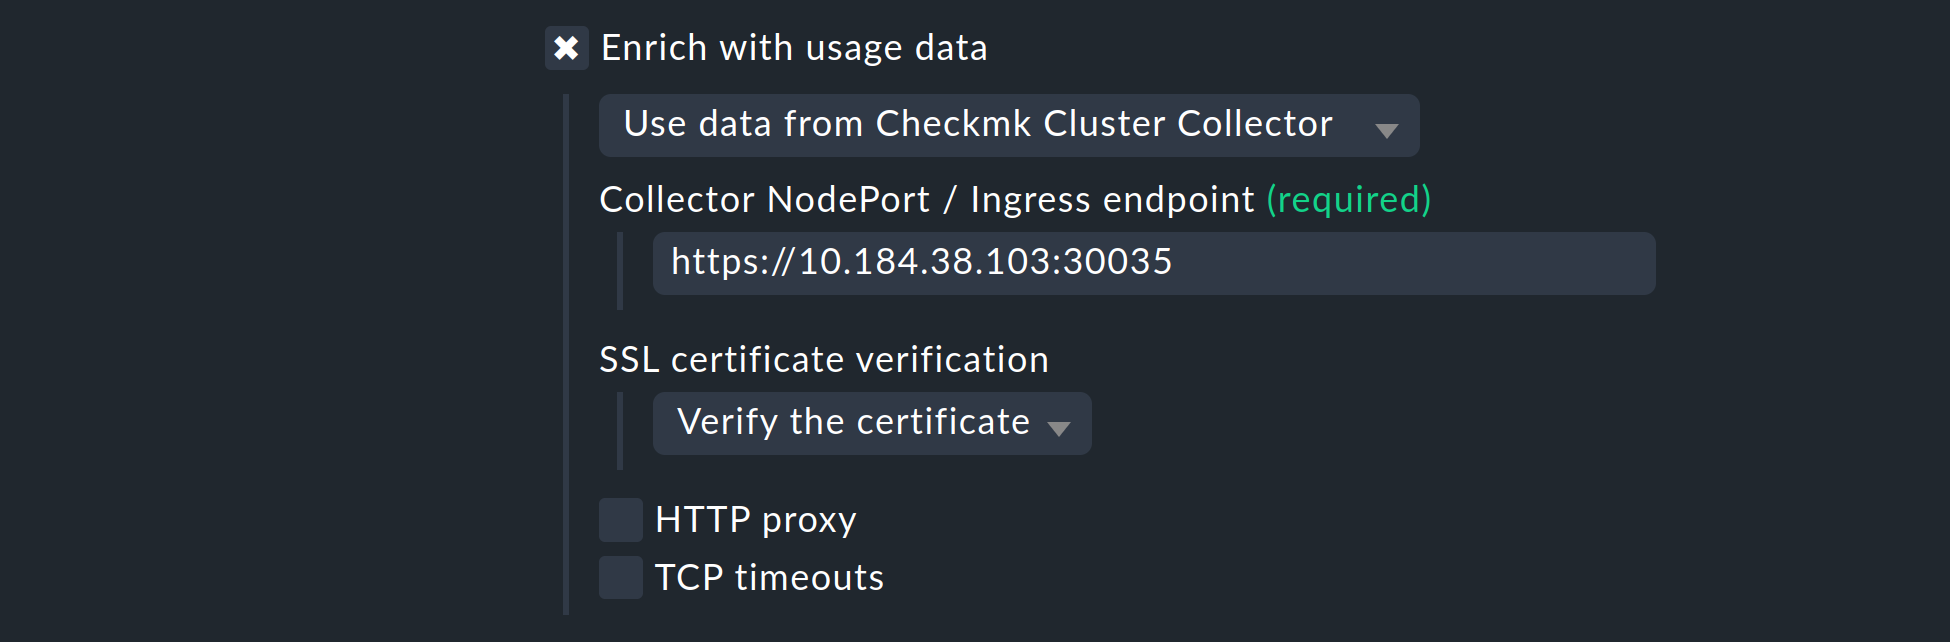
Next, you have the opportunity to enrich the monitoring of your Kubernetes cluster with usage data collected by the Checkmk Cluster Collector. We repeat it once more here to emphasize the importance: The setup of the Cluster Collector is absolutely essential for a fully comprehensive monitoring of your clusters. This is the only way to obtain important data such as CPU and memory utilization and to receive information on the file systems used by the individual components.
So activate the Enrich with usage data from Checkmk Cluster Collector option and specify the endpoint of the NodePort or Ingress. How to re-display this endpoint is in the Helm chart output.
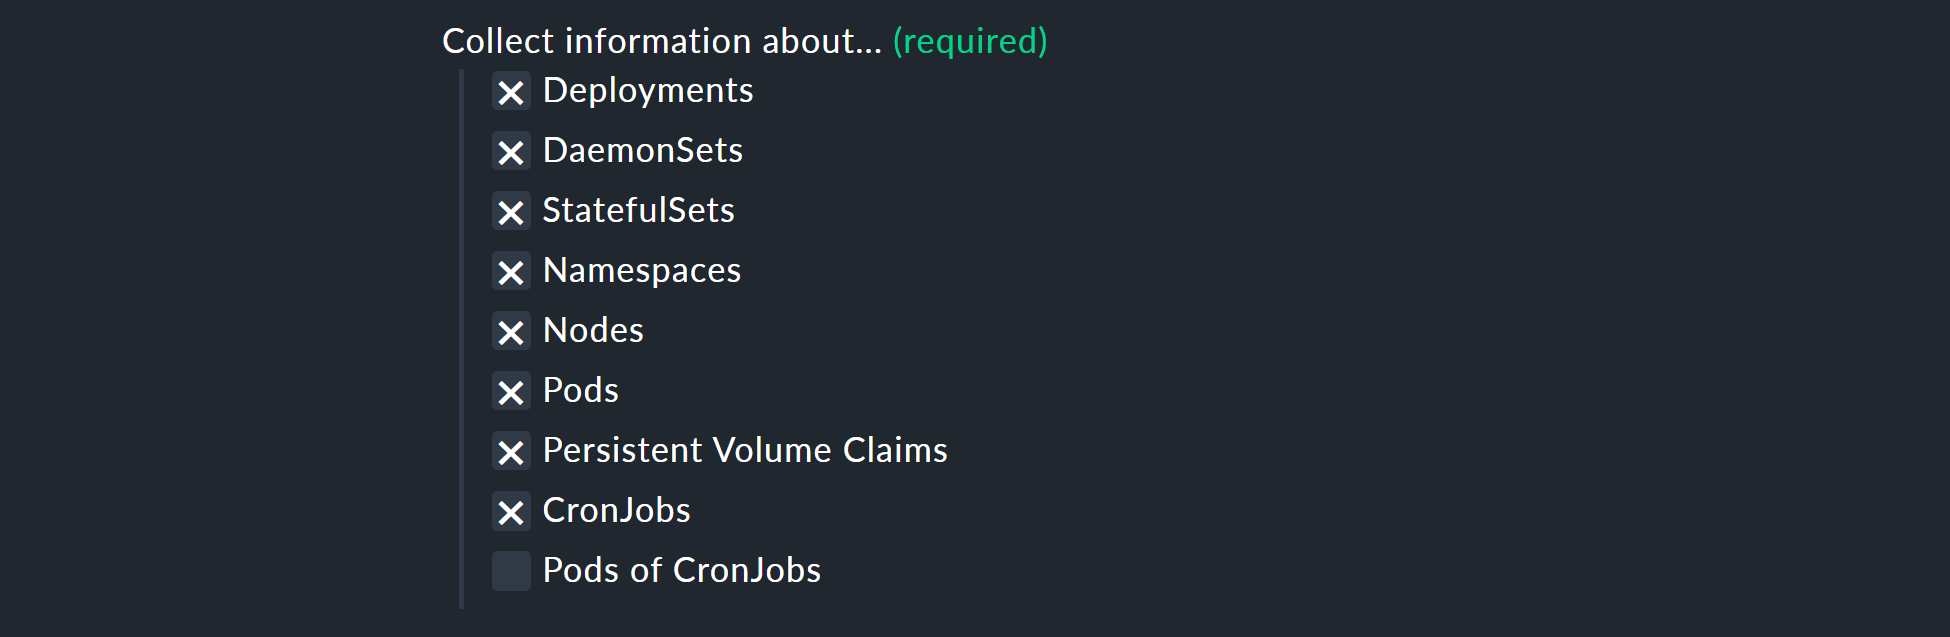
With the Collect information about… options, you can now select which objects within your cluster are to be monitored. Our preselection covers the most relevant objects. If you decide to also monitor the Pods of CronJobs, please refer to the inline help on this point.
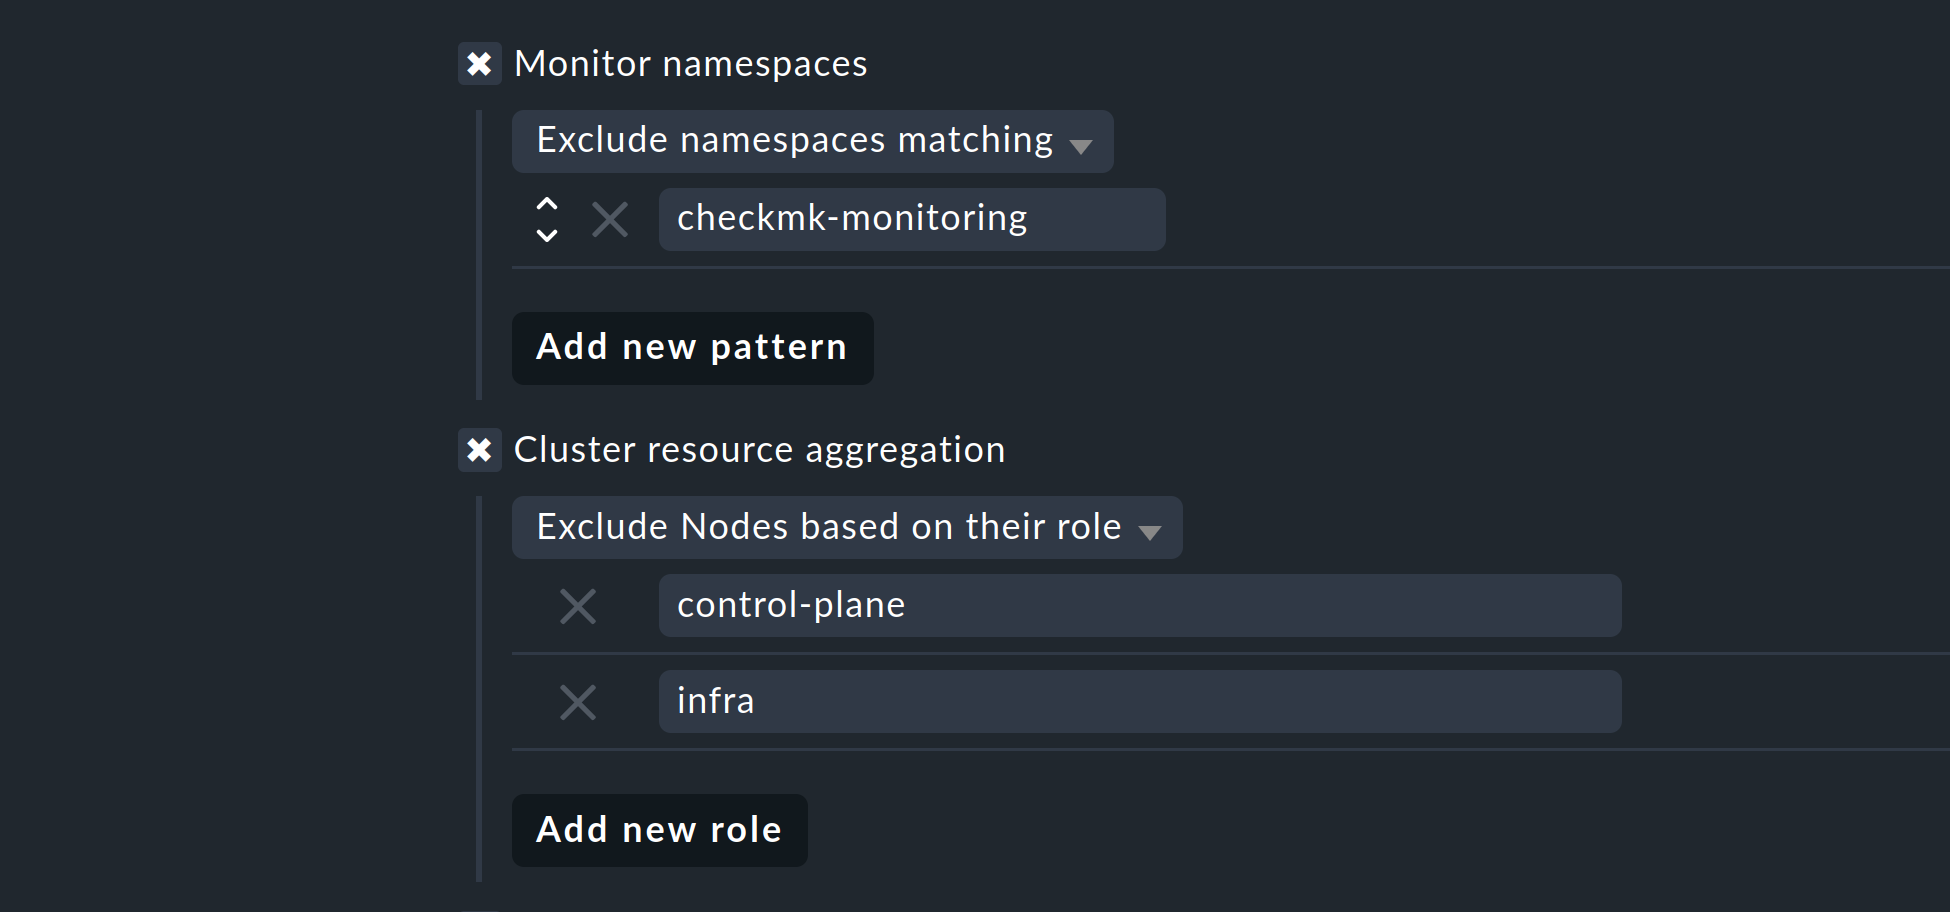
With the next two options, you can further limit the objects to be monitored. If you are only interested in objects from certain namespaces, set this accordingly under Monitor namespaces. Here you can either enter individual namespaces to be monitored or explicitly exclude individual namespaces from monitoring.
With the Cluster resource aggregation option, you can specify nodes that do not provide resources for the workload of your cluster.
These nodes should be excluded from the calculation of available resources, otherwise there is a risk that capacity bottlenecks will not be detected.
By default, we therefore exclude the control-plane and infra nodes from the evaluation.
As a final option, you can import the so-called annotations from Kubernetes. In Checkmk, these annotations become host labels and can thus be used as conditions in rules. You can specify which annotations are to be imported using regular expressions. Again, consult the detailed inline help at this point.
Note: The Import all valid annotations option is provided here only for completeness. We do not recommend blindly importing all annotations, as this can create a very large mountain of useless labels in Checkmk.
Important: Under Conditions > Explicit hosts you must now enter the previously-created host:
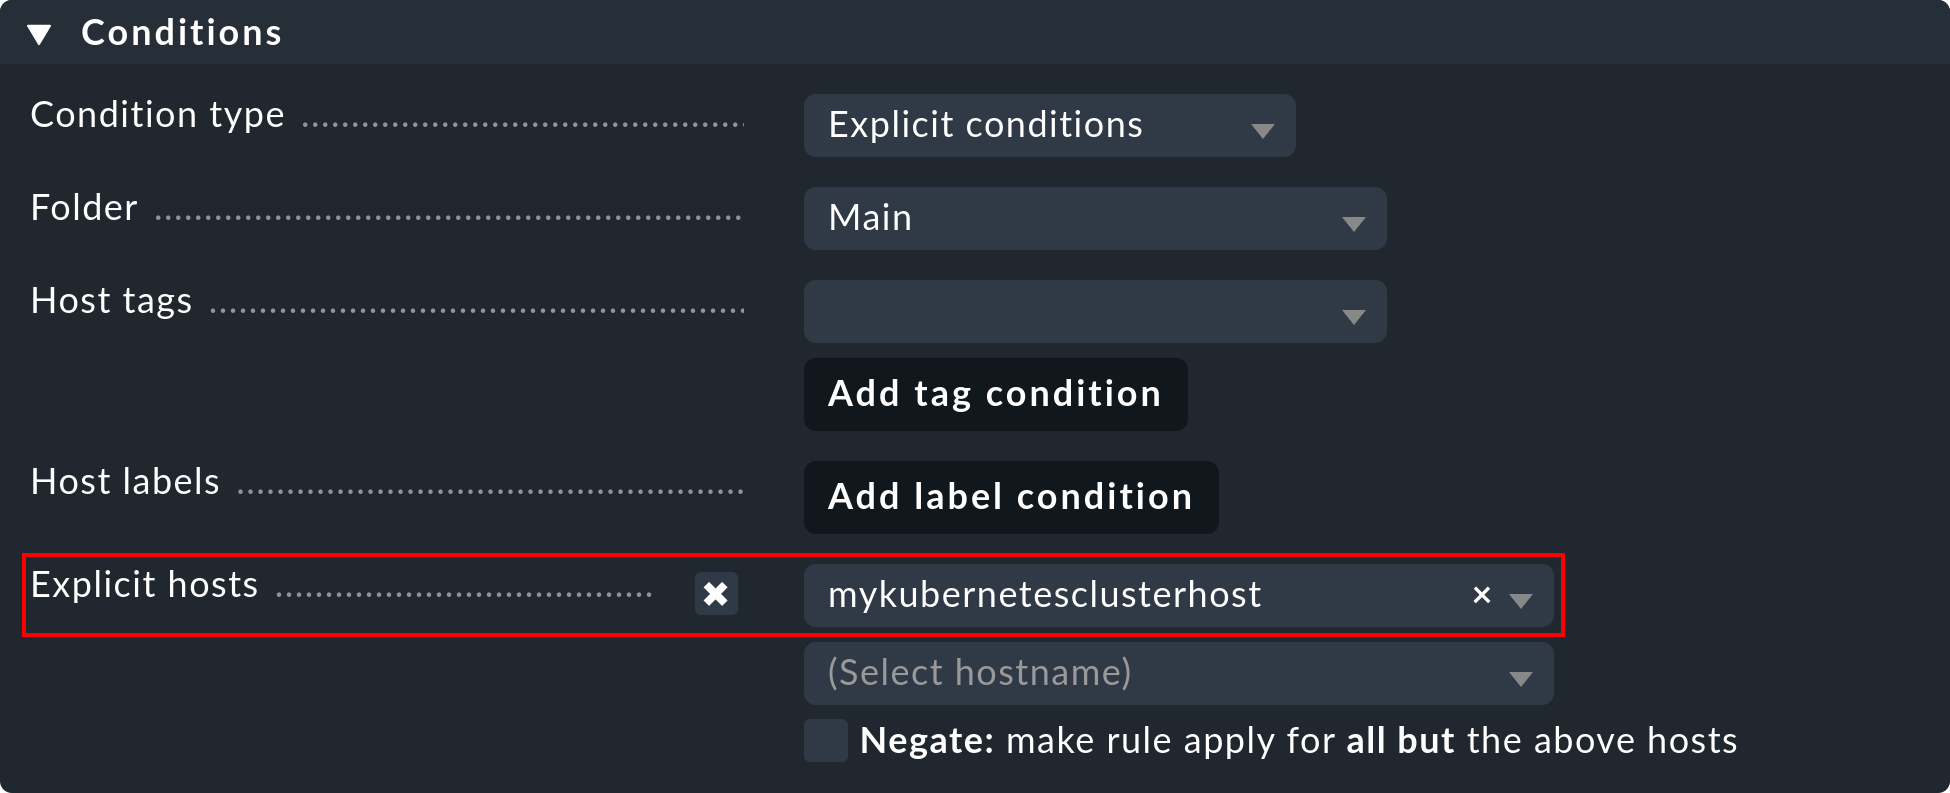
Then save the rule and perform a service discovery on this host. You will immediately see the first cluster-level services here:
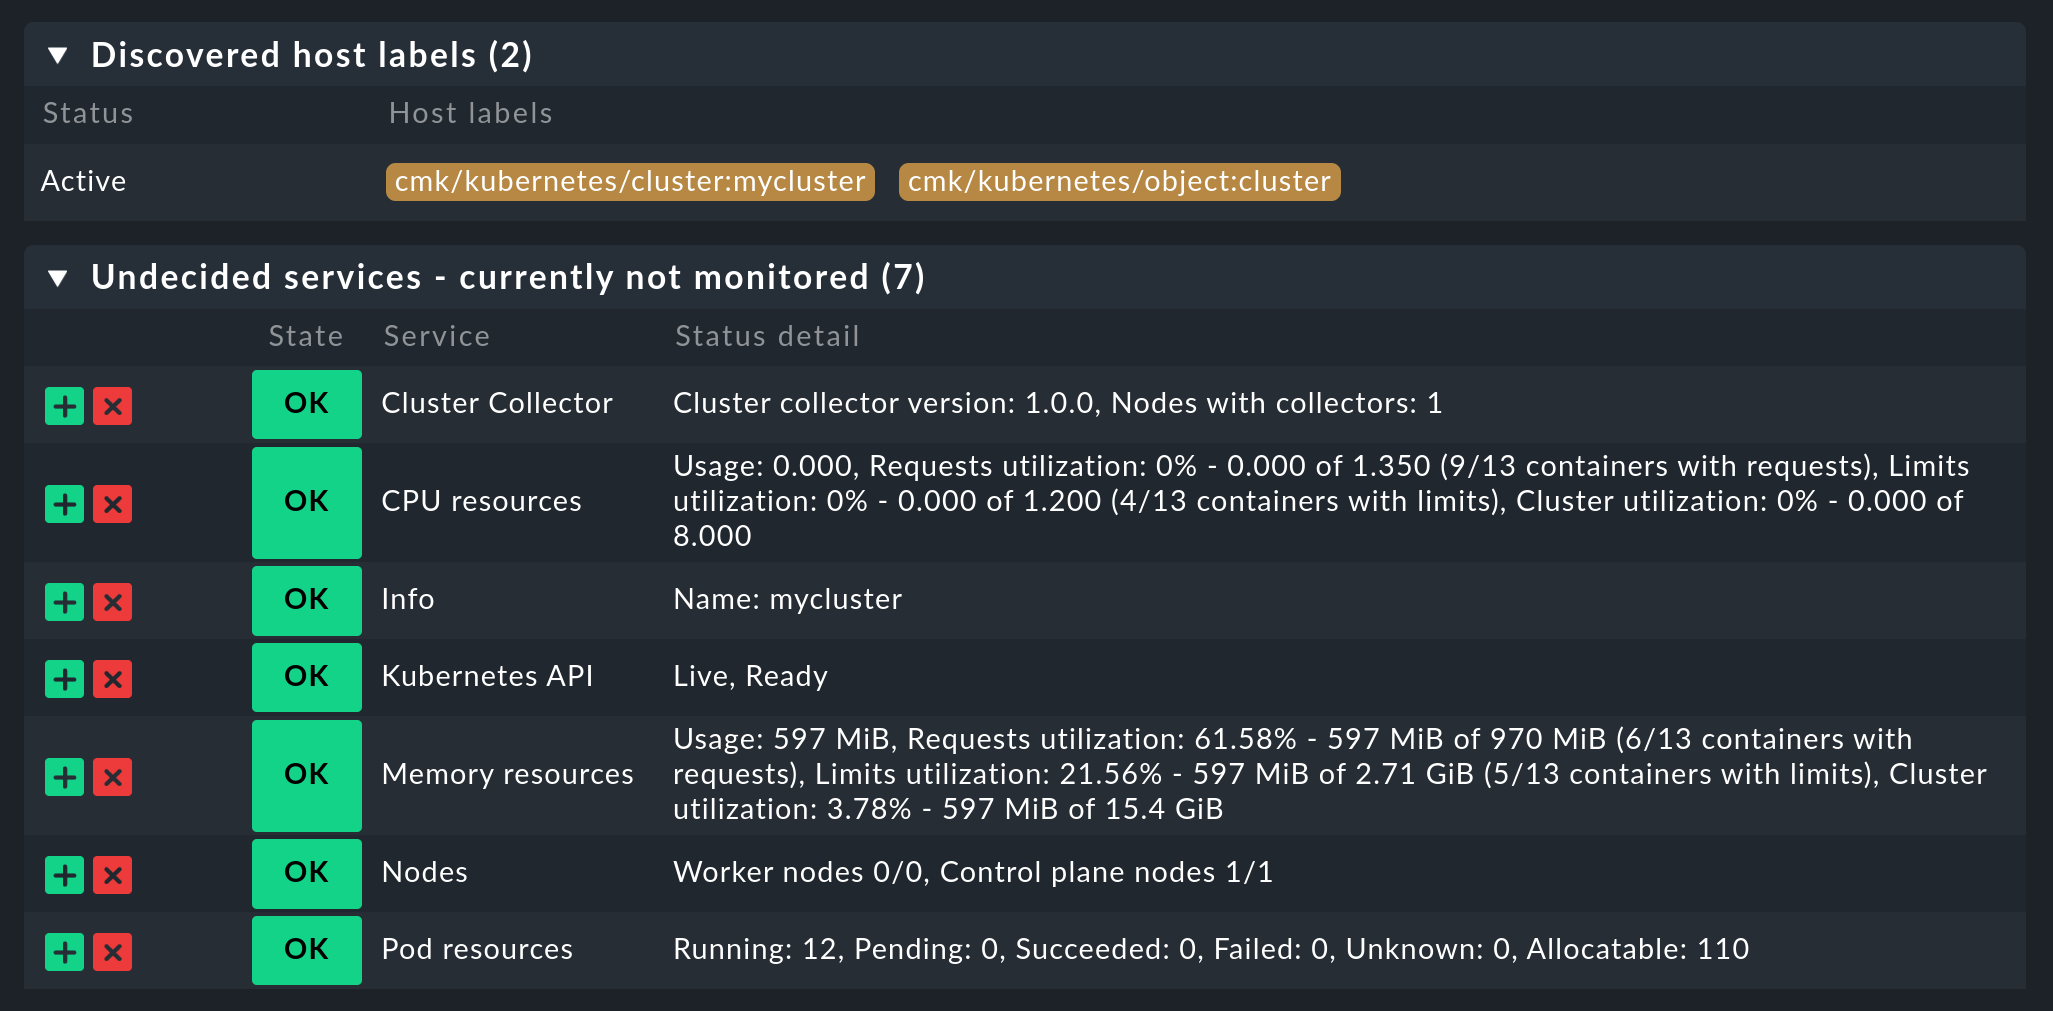
Now activate all of the changes you have made and let the dynamic host management do the work for you. This will create all hosts for your Kubernetes objects within a short space of time.
4. Updating cluster monitoring
As we mentioned in the section Setting up the Helm repository, we perform updates to the Checkmk Cluster Collector and the Checkmk Node Collector as needed. For example, it may be necessary to update the included Checkmk agents. To ensure these changes are applied to your cluster, you must first update the Helm repository. To do this, run the following command:
|
|
At this point, you should check whether our new Helm chart contains values that might override your customized |
If you are satisfied with the contents of your values.yaml, you can then deploy the new Helm chart with your customized values to your cluster:
In this example, we will continue to assume that your release is named myrelease and the namespace being used is checmk-monitoring.
Edit both parameters as required to match your environment.
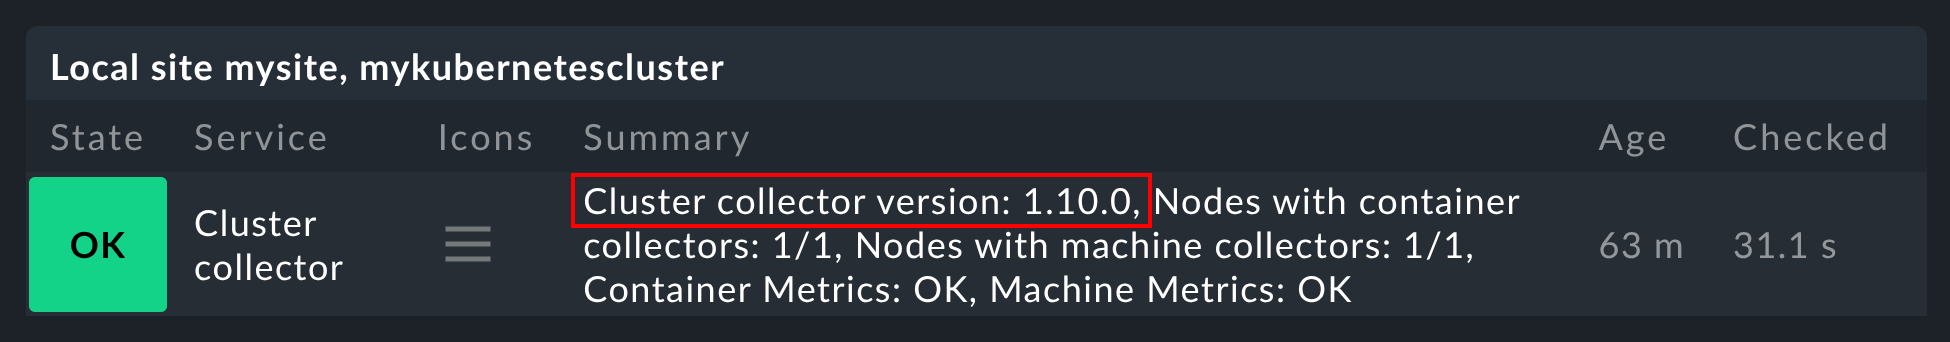
Monitoring of your cluster should now be running with the new versions of Cluster Collector and Node Collector. This can be verified in the Checkmk interface. The Cluster collector service shows which version is being used:
4.1. Incompatible changes
Certain types of changes to Helm charts require that Kubernetes objects be deleted and then recreated.
For example, removing labels associated with a Kubernetes object requires such an action.
When we make such an incompatible change, this will be indicated in the corresponding chart.
In such a case, you must execute the following command before the Update described above:
In this example, we will continue to assume that your release is named myrelease and the namespace used is checkmk-monitoring.
If necessary, adapt the namespace used in the command to suit your environment.
5. Labels for Kubernetes objects
Checkmk automatically generates labels for Kubernetes objects such as clusters, deployments or namespaces during a service discovery.
All of the labels for Kubernetes objects that Checkmk automatically generates start with cmk/kubernetes/.
For example, a pod always receives a label for the node (cmk/kubernetes/node:mynode), a label that shows that this object is a pod (cmk/kubernetes/object:pod) and a label for the namespace (cmk/kubernetes/namespace:mynamespace).
This makes it very easy to create filters and rules for all objects of the same type or in the same namespace.
6. Advanced configuration
6.1. Making changes to the configuration
As described above, we recommend using the Helm chart we provide to configure monitoring for your Kubernetes clusters.
If you want to make changes to this configuration after the initial setup, you only need to modify the values.yaml file you created and then pass it to the helm upgrade command.
The command might look something like this:
6.2. Monitoring worker node network interfaces
If you want to monitor the network interfaces in your worker nodes, you must configure the Checkmk Node Collector accordingly.
To do this, set the key .nodeCollector.machineSectionsCollector.networkInterfaceMonitoring.enabled to true.
You will find a corresponding section in the values.yaml file provided by Checkmk:
By default, the enabled key is set to false.
If you also want to control which network interfaces are detected and how, you can create a rule in the Network interface and switch port discovery rule set, and specify a condition such as the host label cmk/kubernetes/object:node.
6.3. Monitoring file systems on worker nodes
In some Kubernetes environments (e.g., Tanzu), it may be useful to mount the host’s file systems into the Checkmk Node Collector in order to be able to monitor them.
In our supplied values.yaml we have included the .nodeCollector.machineSectionsCollector.extraHostPathMounts dictionary for this purpose, which you can easily comment out and customize to bring specific file systems into the Node Collector’s scope.
In your values.yaml file, this section might look something like this:
If you also want to control which file systems are detected, you can create a rule in the Filesystem discovery rule set and specify a condition such as the host label cmk/kubernetes/object:node.
7. Dashboards and views
7.1. Kubernetes dashboards
![]() The Checkmk commercial editions are
supplied with six built-in dashboards for Kubernetes.
In order to use these dashboards in a practical way, it is necessary to install and configure our Cluster Collector.
Specifically, these six dashboards are called:
The Checkmk commercial editions are
supplied with six built-in dashboards for Kubernetes.
In order to use these dashboards in a practical way, it is necessary to install and configure our Cluster Collector.
Specifically, these six dashboards are called:
Kubernetes
Kubernetes Cluster
Kubernetes DaemonSet
Kubernetes Deployment
Kubernetes Namespace
Kubernetes StatefulSet
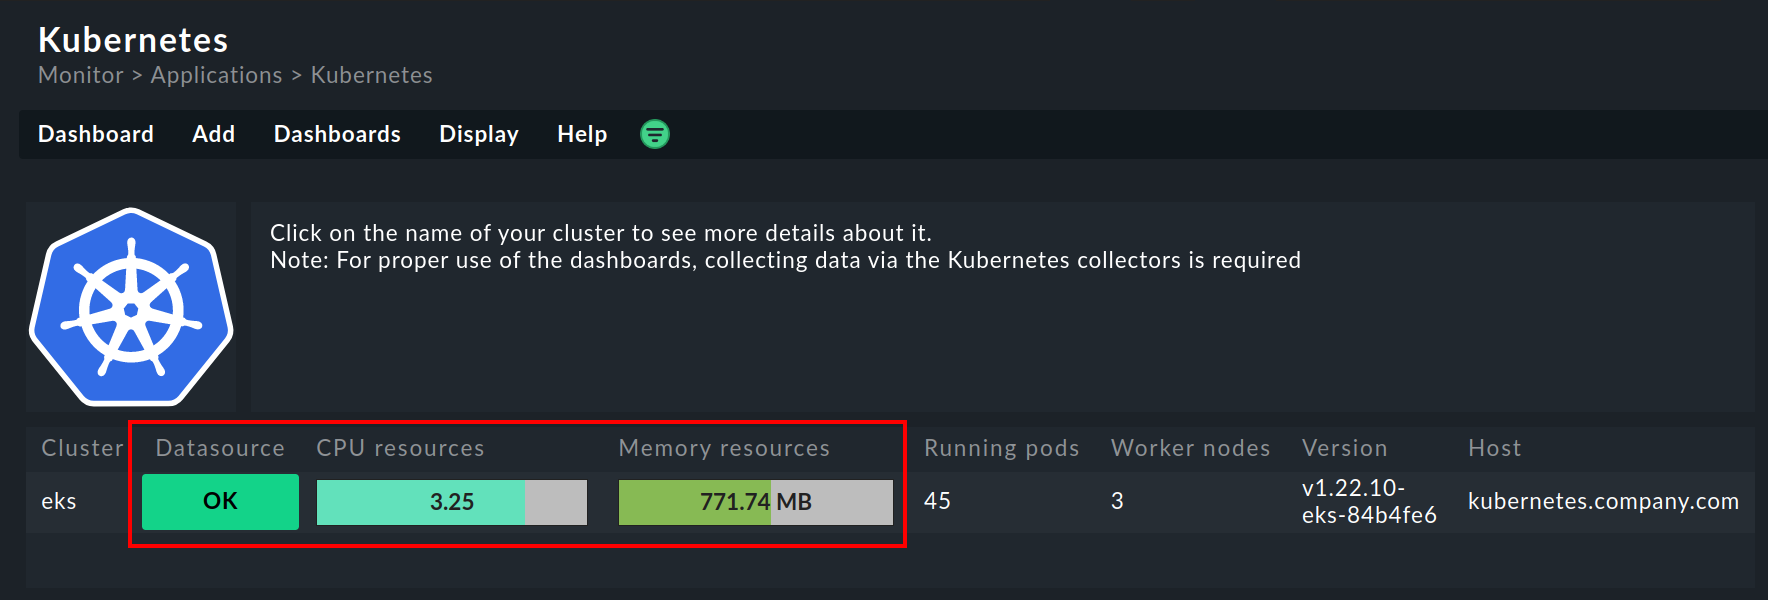
The entry point is always the Kubernetes dashboard, which you can access via Monitor > Applications > Kubernetes:
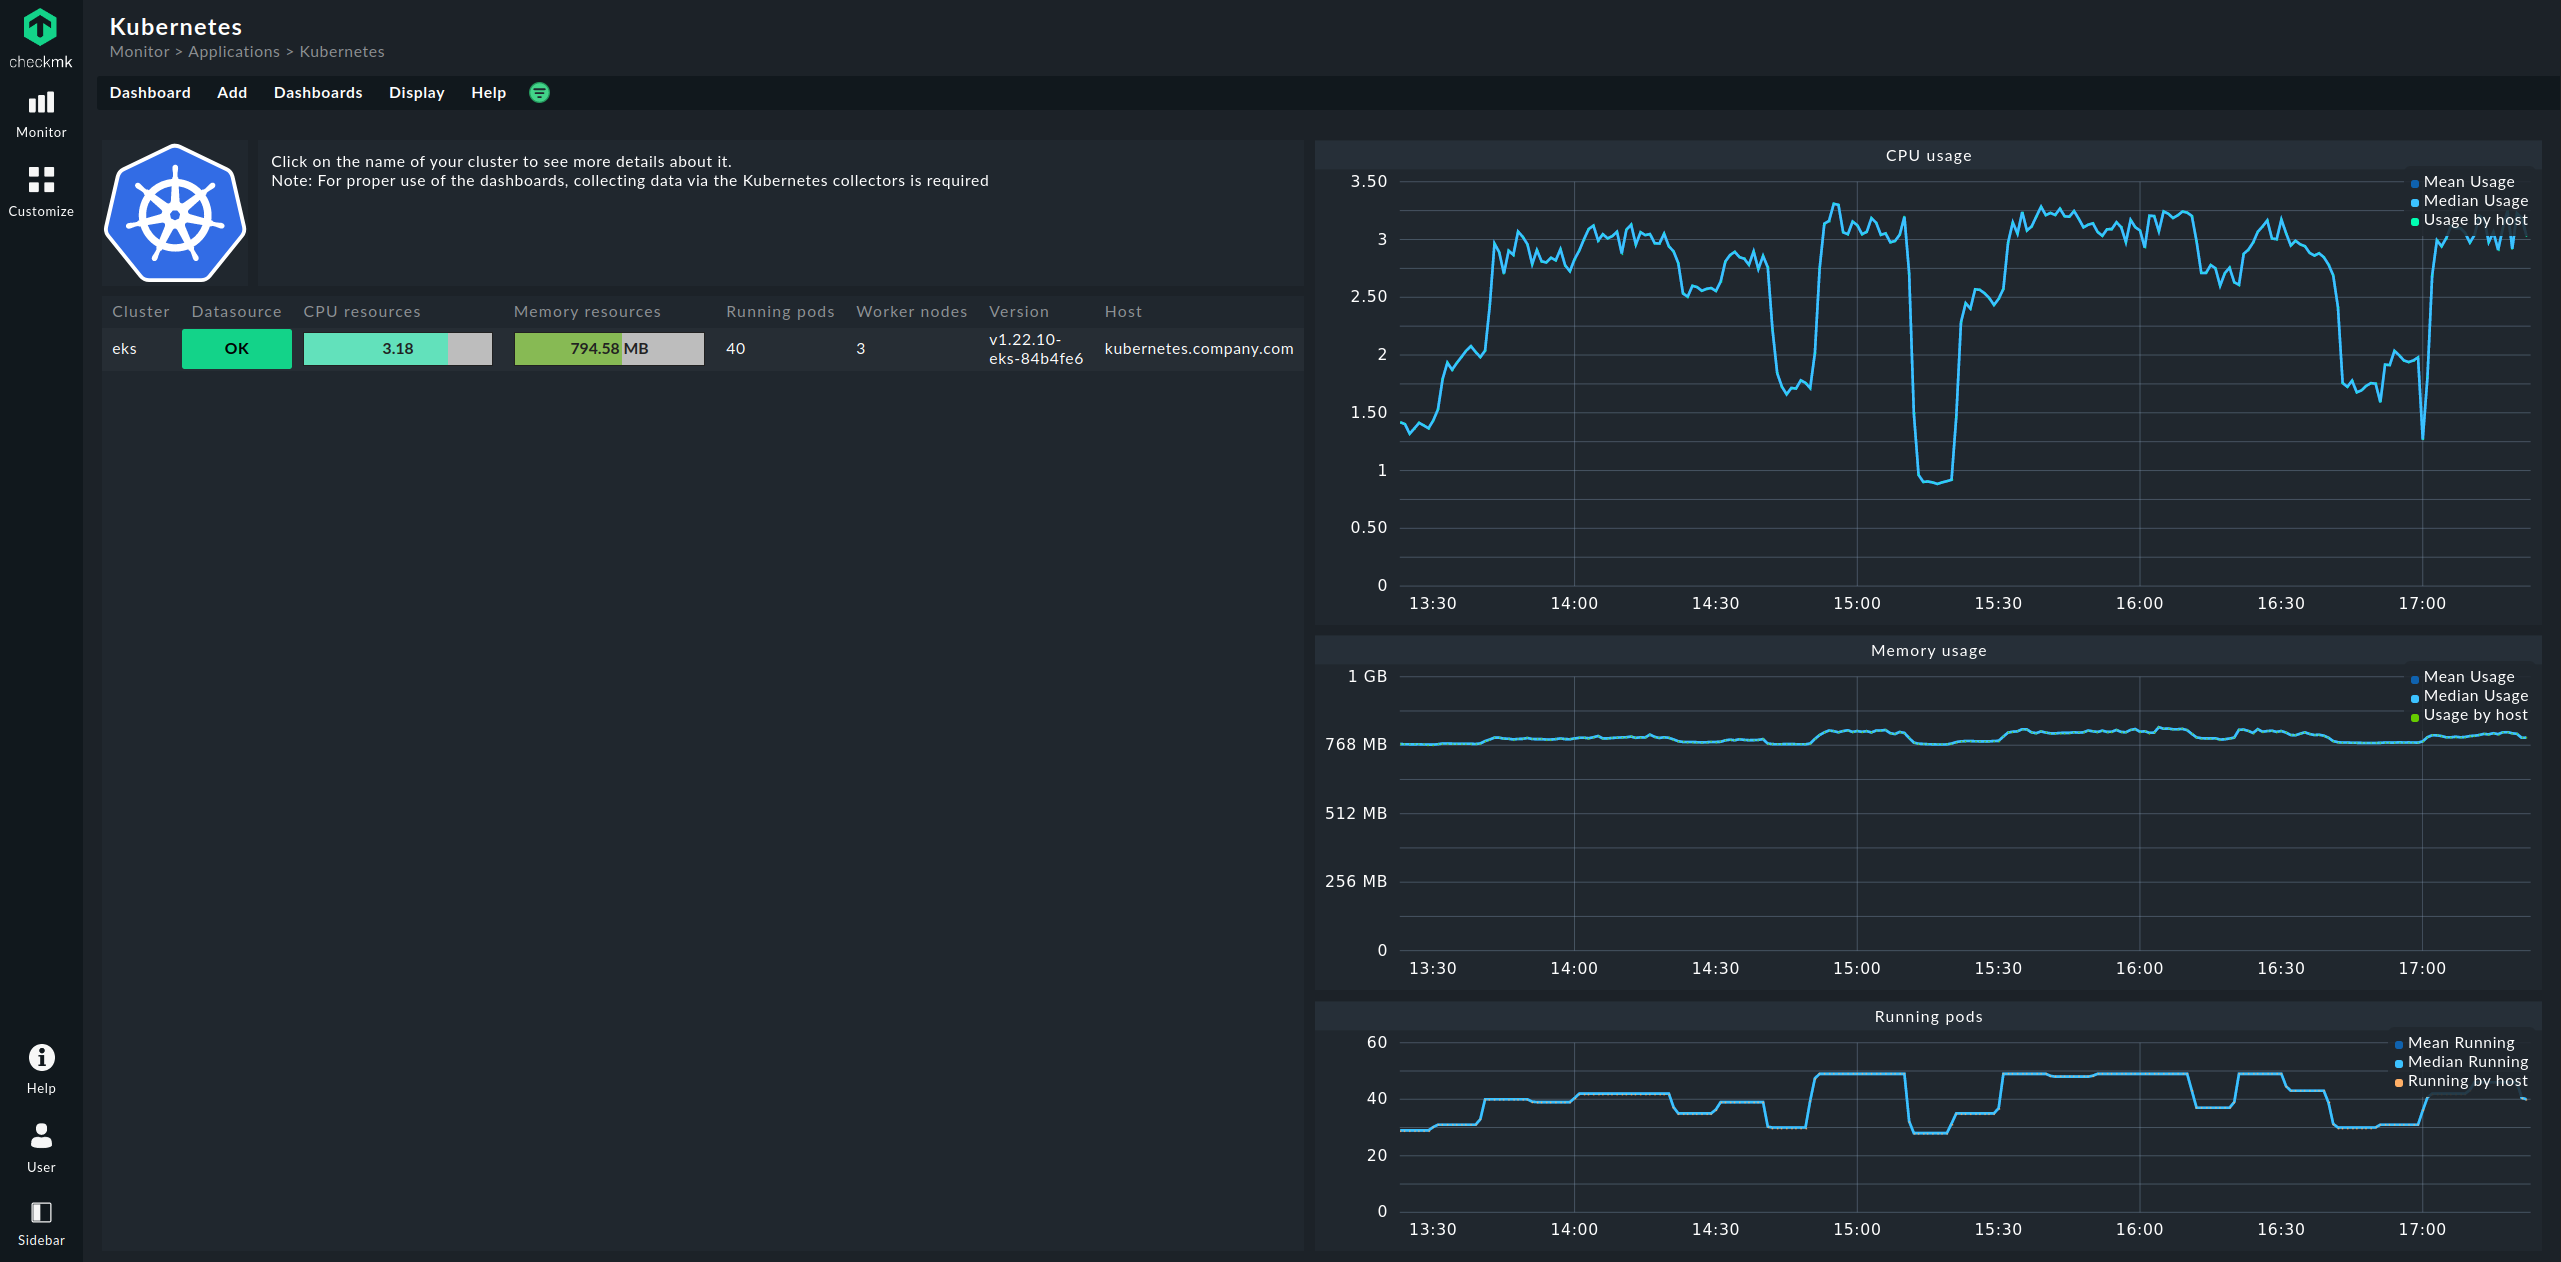
In the Kubernetes dashboard, all of your Kubernetes clusters being monitored will be listed on the left-hand side. This listing of clusters is also your entry point to drill deeper into Kubernetes dashboards. Clicking on the name of a cluster will take you to the selected cluster’s Kubernetes Cluster dashboard. In the Kubernetes Cluster dashboard, clicking on the respective name then takes you to the other context-dependent dashboards:
7.2. The HW/SW inventory
The Checkmk Kubernetes monitoring also supports the HW/SW inventory. For example, if you click on the cluster’s primary name (here: mycluster) in the above cluster dashboard, you will jump to the cluster’s inventory.
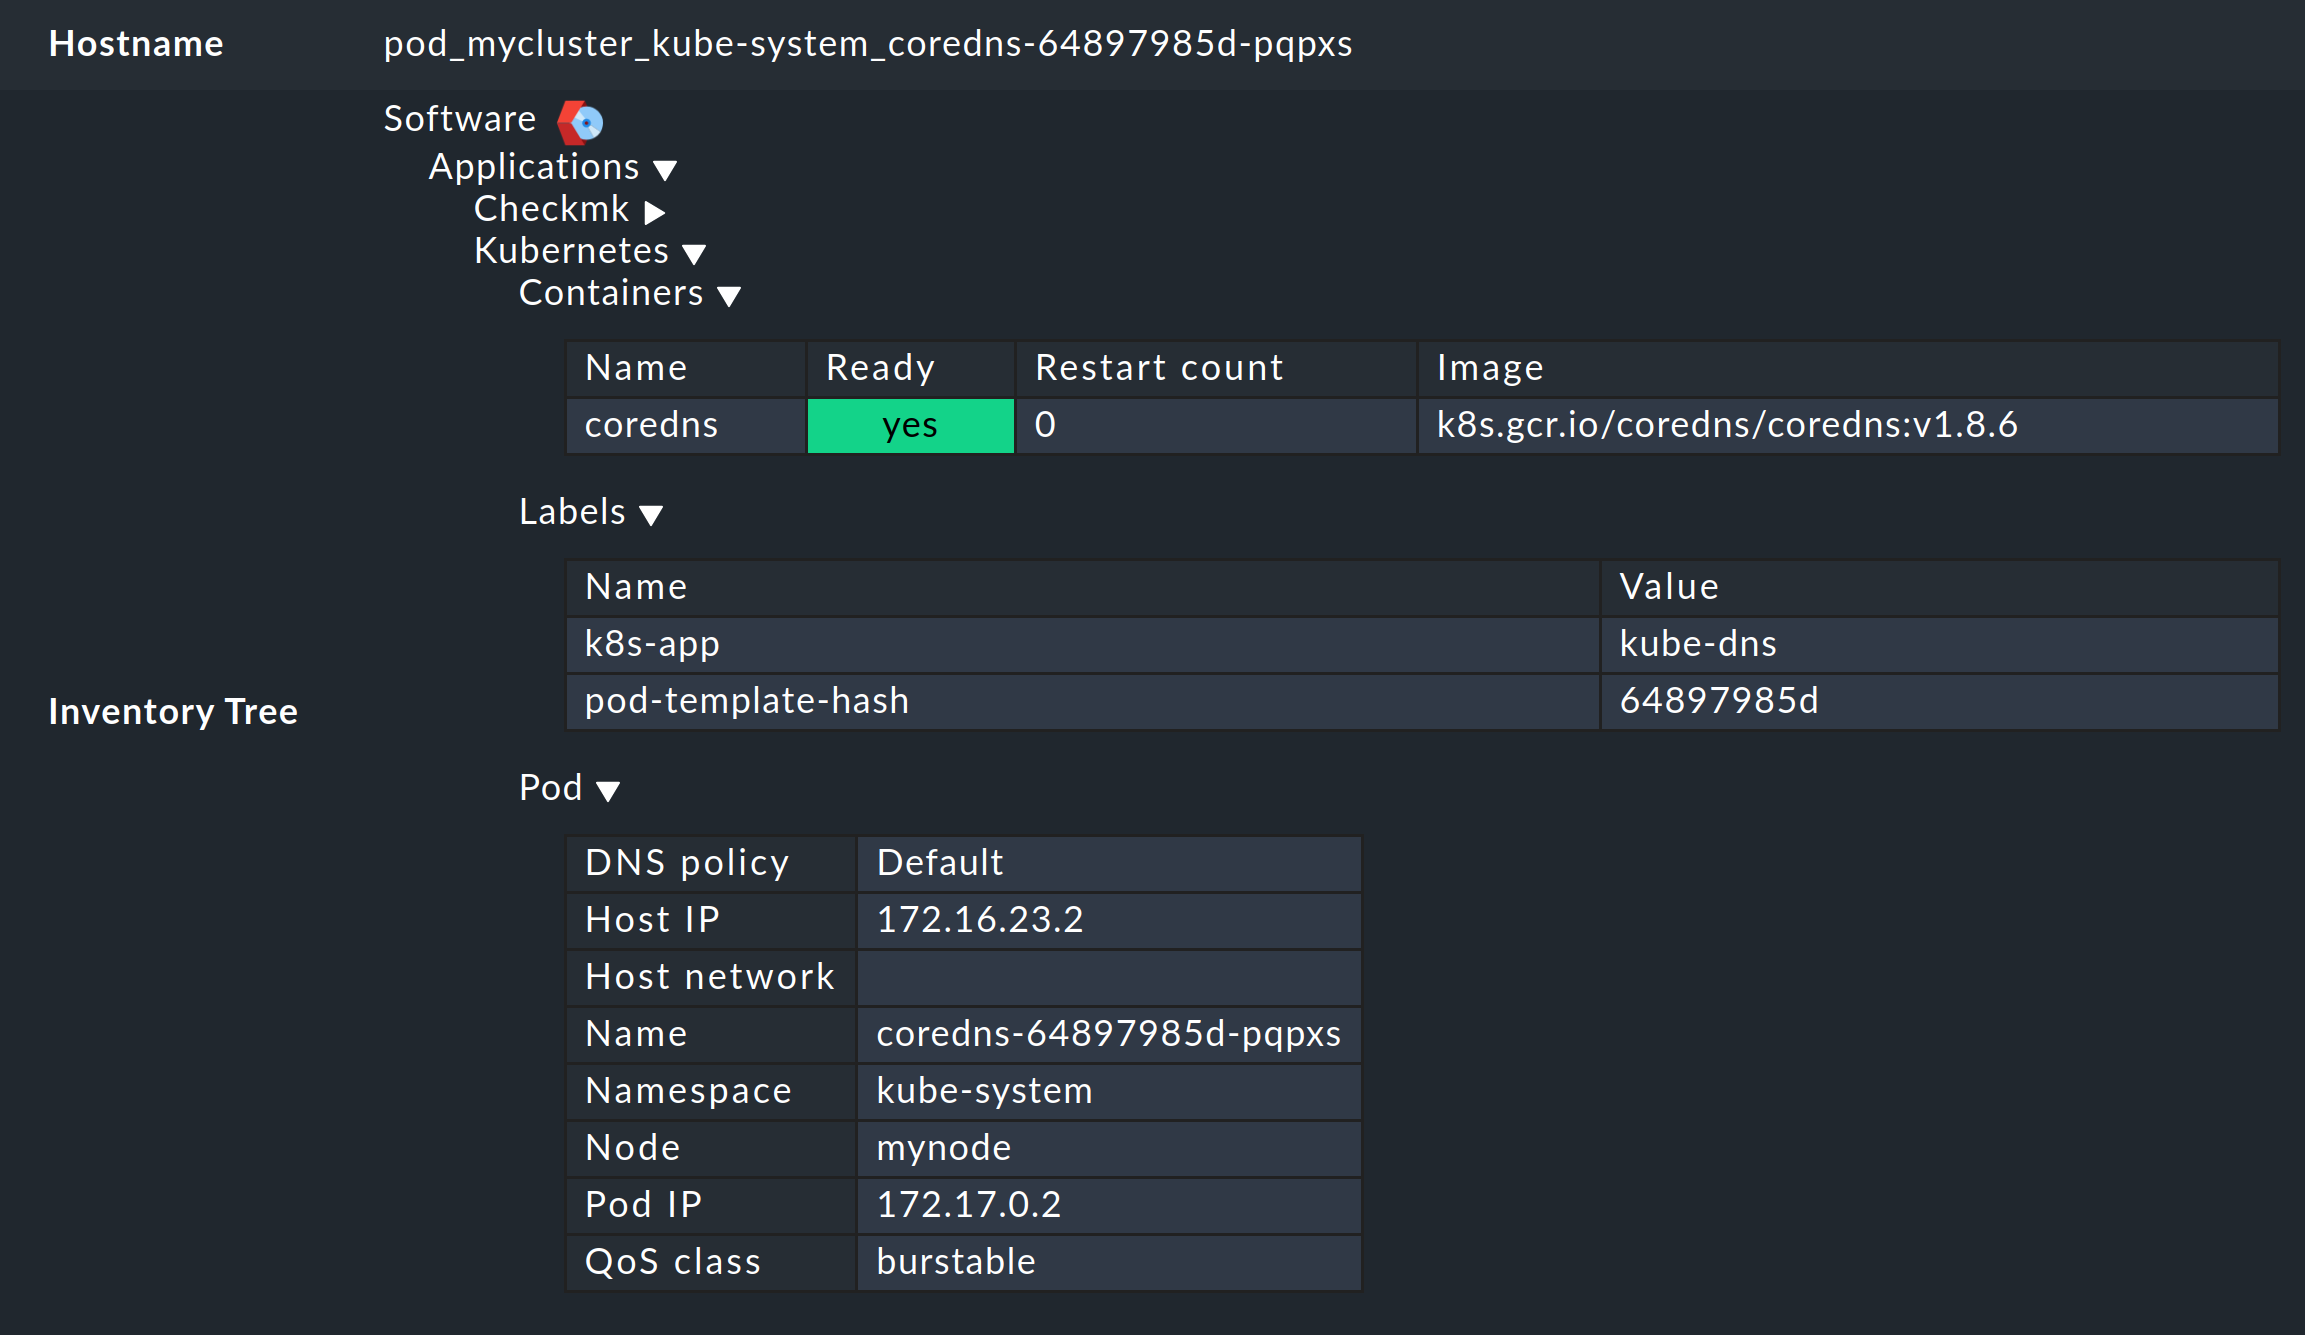
In the same way, i.e. via the boxes with the primary names of the objects, you will also get to the inventory for the respective object in the other dashboards. The following example shows the HW/SW inventory from a pod:
8. Checking the installation
In the Helm chart output section, you have already learned the first method for checking that the components for a comprehensive monitoring of Kubernetes have been successfully installed. In the Checkmk GUI you can also check the successful installation and configuration in a number of places.
The most important services here are definitely Kubernetes API and Cluster Collector. These must be present on the cluster host you have created and should also display certain information.
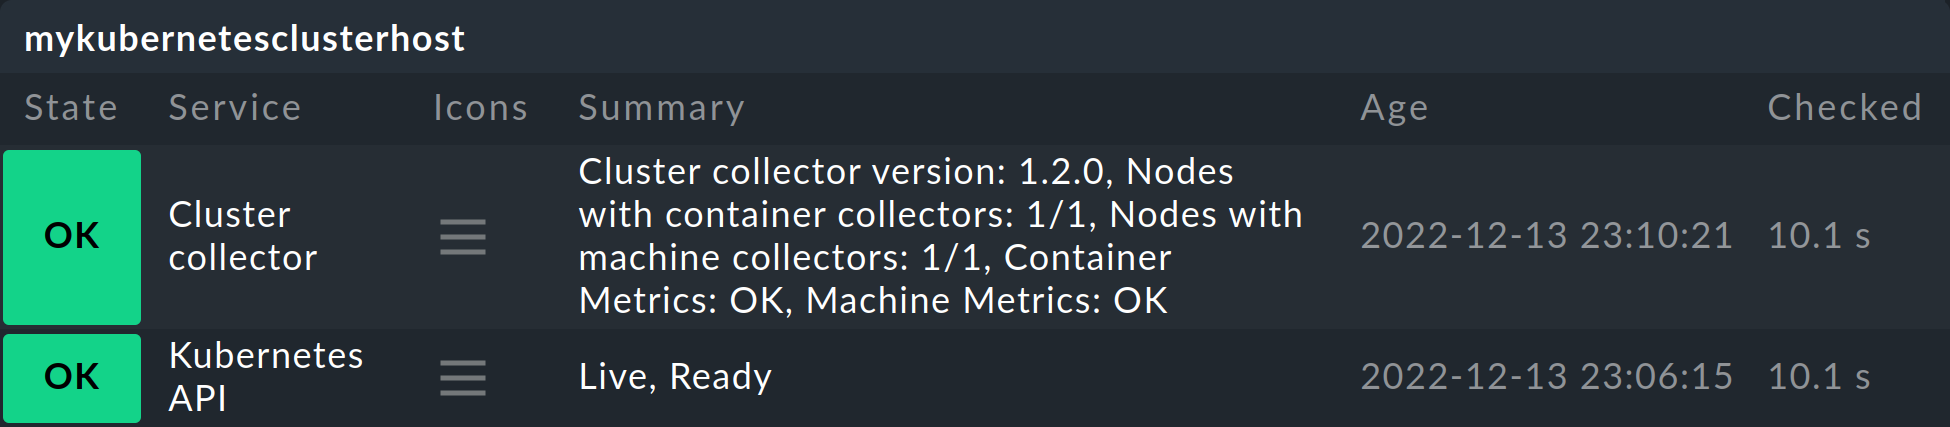
The Kubernetes API service should normally report Live, Ready under Summary. The service Cluster Collector must show the version number of the installed Cluster Collector. If this is not the case for one or the other of these, you must check the installation of the Helm charts and the configuration of the special agent.
Further possibilities for checking are provided in the cluster dashboards of the commercial editions.
In the Kubernetes dashboard, you can see very early on whether the Cluster Collector is running in a cluster and collecting data. If the columns CPU resources and Memory resources do not contain any data, this is already a strong indicator that the Cluster Collector is not running properly. If set up correctly, the Kubernetes dashboard should look something like this:
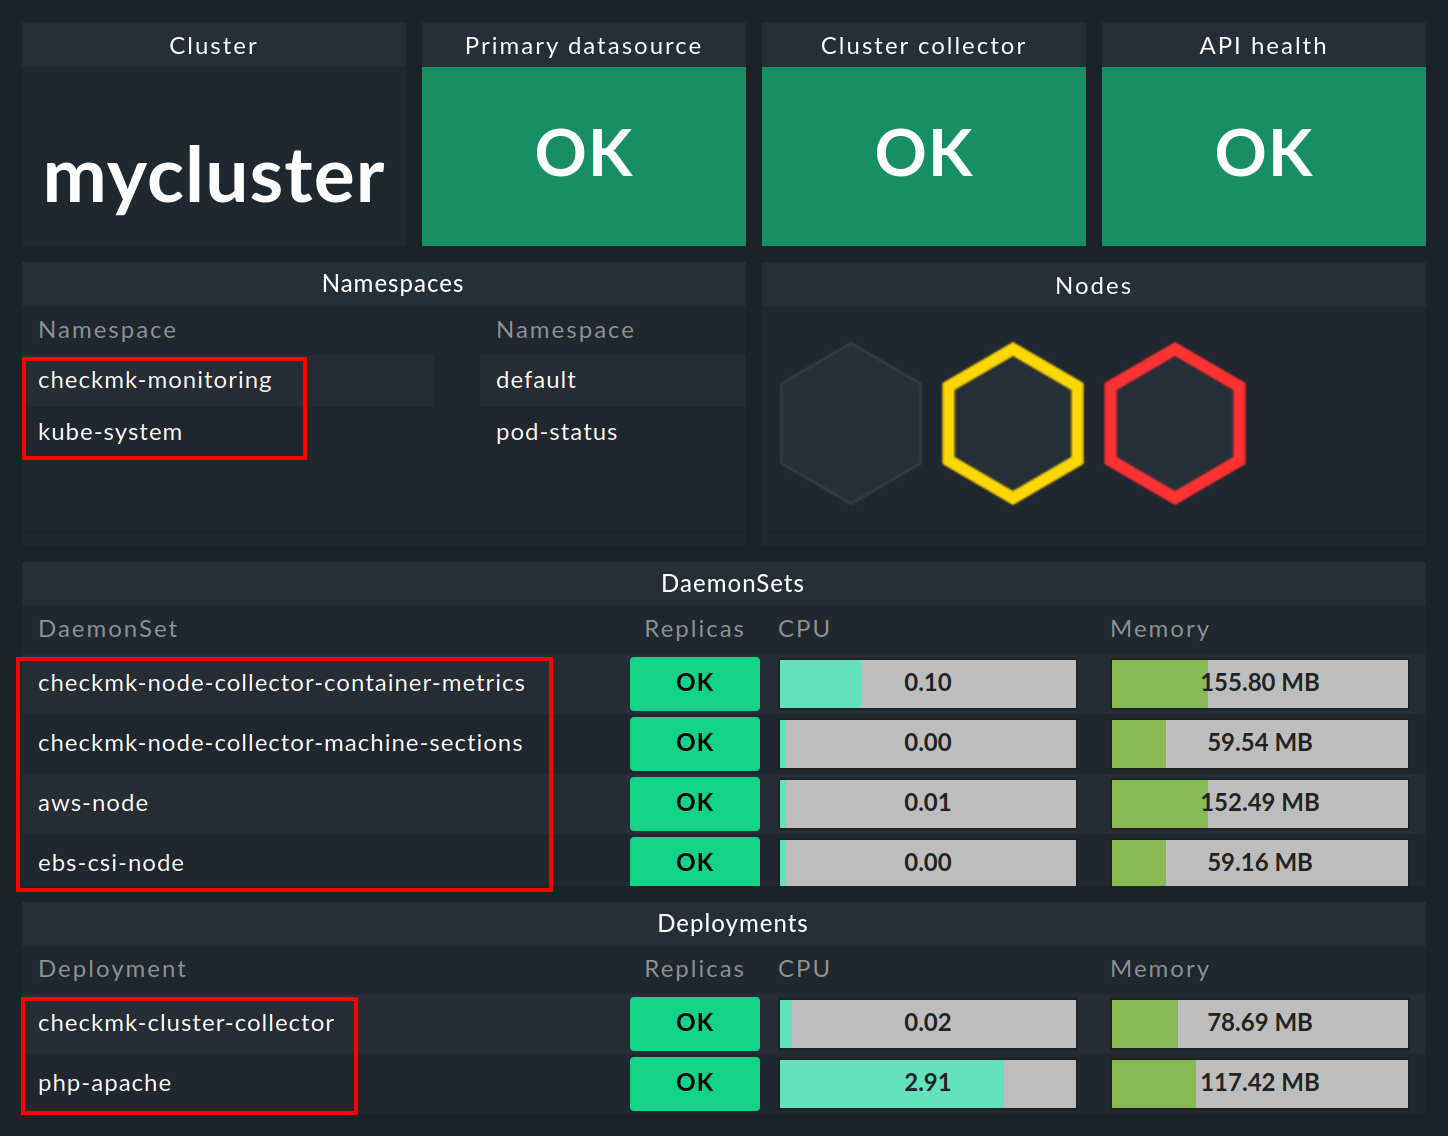
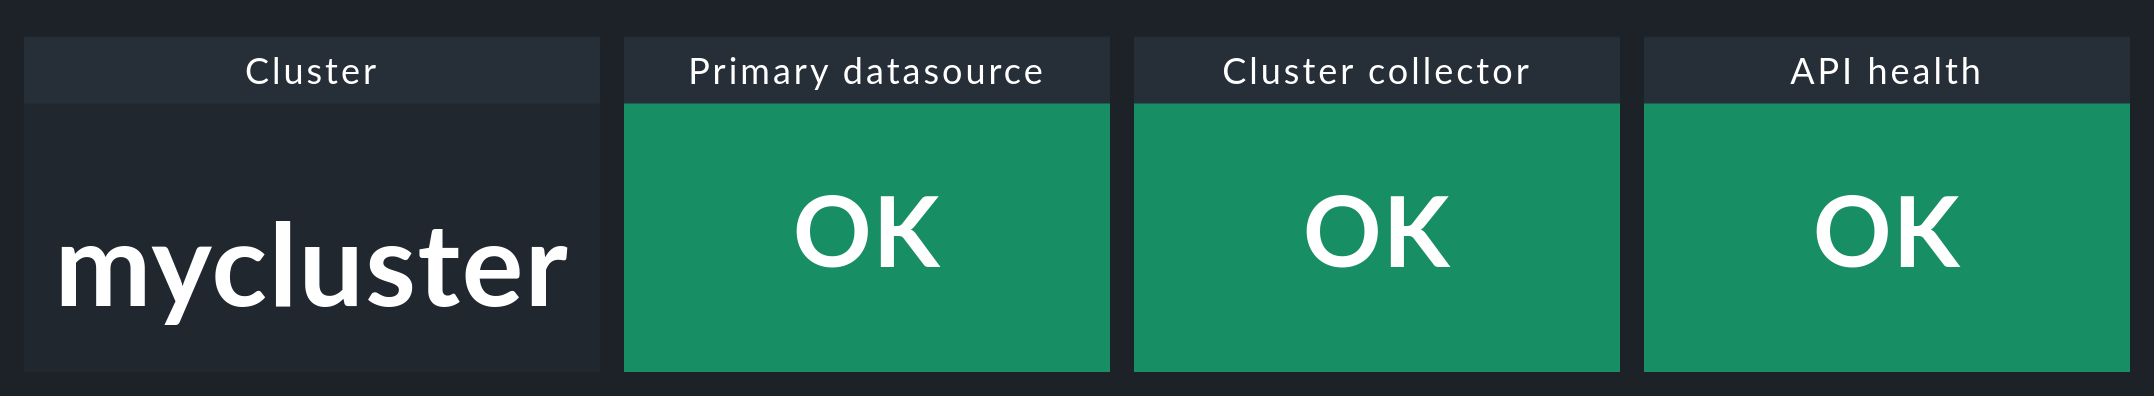
If you now click on the name of the cluster in this window, you will land in the Kubernetes Cluster in the respective cluster’s dashboard. Here the three boxes Primary datasource, Cluster collector and API health should be green and show OK.
9. Removing monitoring components from a cluster
If you have deployed Checkmk to your cluster using our Helm charts, you can remove the created accounts, services, pods and node ports just as easily as you set them up. To do this, simply uninstall the release that was installed using our charts.
If you are unsure of the name of the release, first display all Helm releases in all namespaces:
As in the example output above, you should find a release here that contains a reference to Checkmk in the CHART column.
Remove this release with the following command, specifying the correct namespace: