1. Introduction
In cloud and container environments it is becoming increasingly common that hosts being monitored appear and disappear automatically. Keeping the monitoring configuration up to date manually is no longer a viable option. However, even classic infrastructures such as VMware clusters can be very dynamic, and even if manual maintenance is not feasible here, it is still possible to keep the configuration up to date manually.
![]() The commercial editions of Checkmk support you
with a smart tool: dynamic host management.
Dynamic host management uses information from monitoring Amazon Web Services (AWS), Microsoft Azure, Kubernetes, VMware ESXi, and other sources to automatically add hosts to monitoring — as well as deleting them when they are no longer needed.
The commercial editions of Checkmk support you
with a smart tool: dynamic host management.
Dynamic host management uses information from monitoring Amazon Web Services (AWS), Microsoft Azure, Kubernetes, VMware ESXi, and other sources to automatically add hosts to monitoring — as well as deleting them when they are no longer needed.
Dynamic host management is generic and not limited to the creation of hosts. It forms the basis for future extensions of Checkmk that will dynamically adjust the configuration. For this purpose dynamic host management works with connections. Each connection can retrieve information from a specific type of source and has its own specific configuration for this purpose.
The Dynamic Configuration Daemon (DCD) is the software component which provides the dynamic host management. The software architecture of the DCD has been completely redesigned in Checkmk 2.4.0 to meet the requirements of large, highly dynamic environments and ensure stable and secure processing. The collection of information from the configured connections is now decoupled from the resulting configuration changes in Checkmk. Pending configuration changes are organized in queues and processed sequentially in cycles, which guarantees stable and secure processing. The host manager settings provide you with options for customizing the processing cycles. For more information, see the Configuration chapter.
2. Connection types
By setting up a connection in dynamic host management, you can automatically add hosts to monitoring and also automatically delete them again, so that you always have a real-time picture of the situation. To do this, dynamic host management analyzes the existing data, compares which hosts are already present in the configuration environment and creates any missing hosts or deletes those that are no longer present. Subsequently, a service discovery is (optionally) performed on the hosts, and finally the changes are activated so that the current status can be seen in the monitoring environment.
2.1. Piggyback connection
The piggyback connection is used to evaluate—unsurprisingly—piggyback data. This connection type can be used universally in Checkmk, because the piggyback mechanism is used by Checkmk in all situations where a query to a host (usually via a special agent) provides data about other hosts (usually virtual machines or cloud objects).
Checkmk uses piggyback, for example, to monitor Proxmox, Docker, VMware ESXi, and the hyperscalers AWS, Azure, and GCP. In all of these cases, monitoring automatically retrieves data from other hosts, such as virtual machines (VM), that are not directly accessible via the network and on which no Checkmk agent needs to be running. You can automatically include such hosts in the monitoring and also delete them again. Automatically-created hosts can still be manually edited in the Setup GUI.
The only requirement for using a piggyback connection is piggyback data. You will always have this if you have set up monitoring for AWS, Azure, and others as described in this User Guide.
You can also easily check the presence of piggyback data on the command line, as this data is created by Checkmk in the ~/tmp/check_mk/piggyback/ directory:
If this directory is not empty, piggyback data has been generated in this site.
2.2. OpenTelemetry connection
![]() In
In ![]() Checkmk Ultimate Checkmk provides
support for processing OpenTelemetry metrics.
To do this, an OpenTelemetry Collector in Checkmk collects metric data that the collector receives via the OpenTelemetry Protocol (OTLP) or retrieves via a Prometheus endpoint.
The OpenTelemetry Collector writes the received data to the metrics backend.
Dynamic host management accesses the data stored there.
Checkmk Ultimate Checkmk provides
support for processing OpenTelemetry metrics.
To do this, an OpenTelemetry Collector in Checkmk collects metric data that the collector receives via the OpenTelemetry Protocol (OTLP) or retrieves via a Prometheus endpoint.
The OpenTelemetry Collector writes the received data to the metrics backend.
Dynamic host management accesses the data stored there.
The setup of OpenTelemetry, including the OpenTelemetry Collector and the metrics backend is described in the article Monitoring OpenTelemetry metrics.
3. Setting up a connection
Open the dynamic host management page with Setup > Hosts > Dynamic host management:
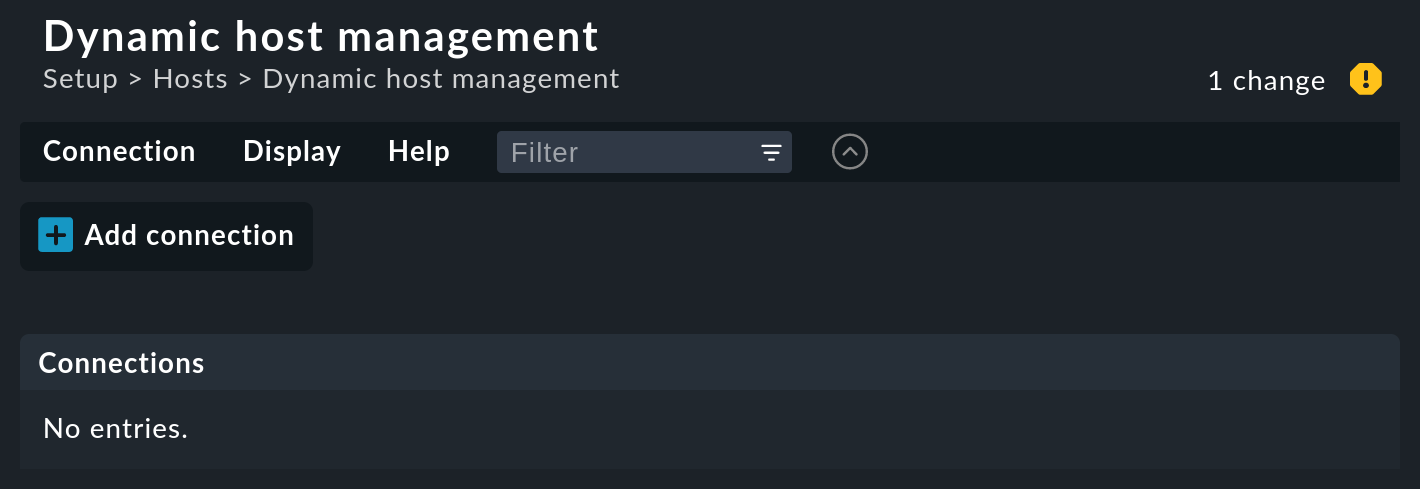
Create a new connection using Add connection.
3.1. General properties
The first part of the configuration is the General properties:
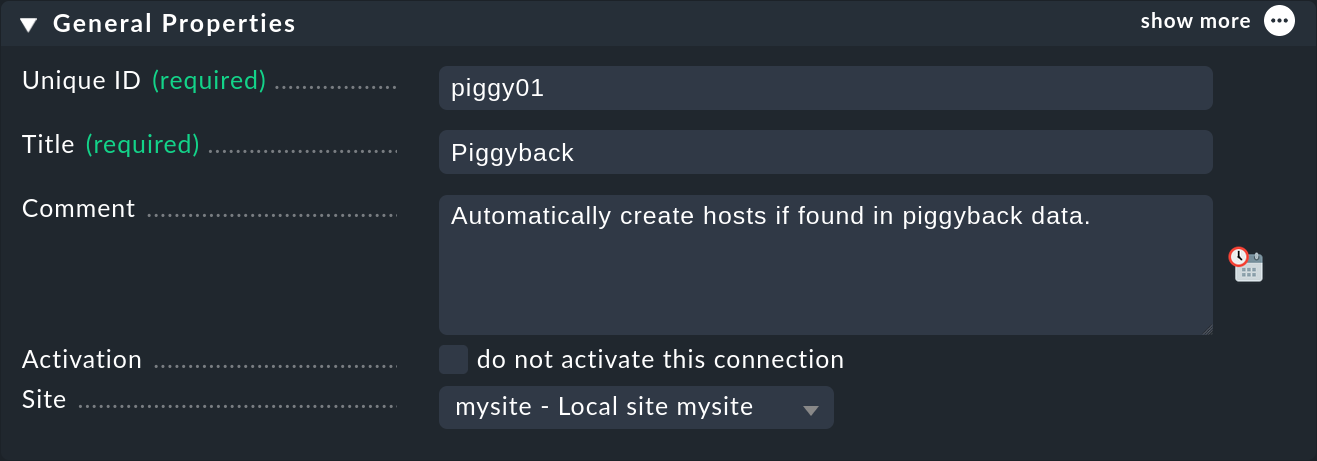
As is often the case, here you assign a unique ID and a title to this connection.
Under Site, you must select the Checkmk site where the data is generated.
'Generated' here refers to the site where data is stored in the ~/tmp/check_mk/ directory for the respective connection type.
In most cases, a special agent handles the storage of the data.
Since data can only ever be processed locally on a specific site, the connection must be assigned to that site. In a distributed monitoring with central setup, you must therefore specify the site on which the data—whether piggyback data or data from other sources—is to be collected and subsequently processed. Here, you do not determine on which site the hosts are to be created. You specify this in the Host attributes to set using the Basic settings: Monitored on site host attribute. The connection is then assigned to the host.
3.2. Properties of a piggyback connection
The second part is the connection properties (Connection properties). Since there is quite a bit to configure here, we will go through the options one by one.
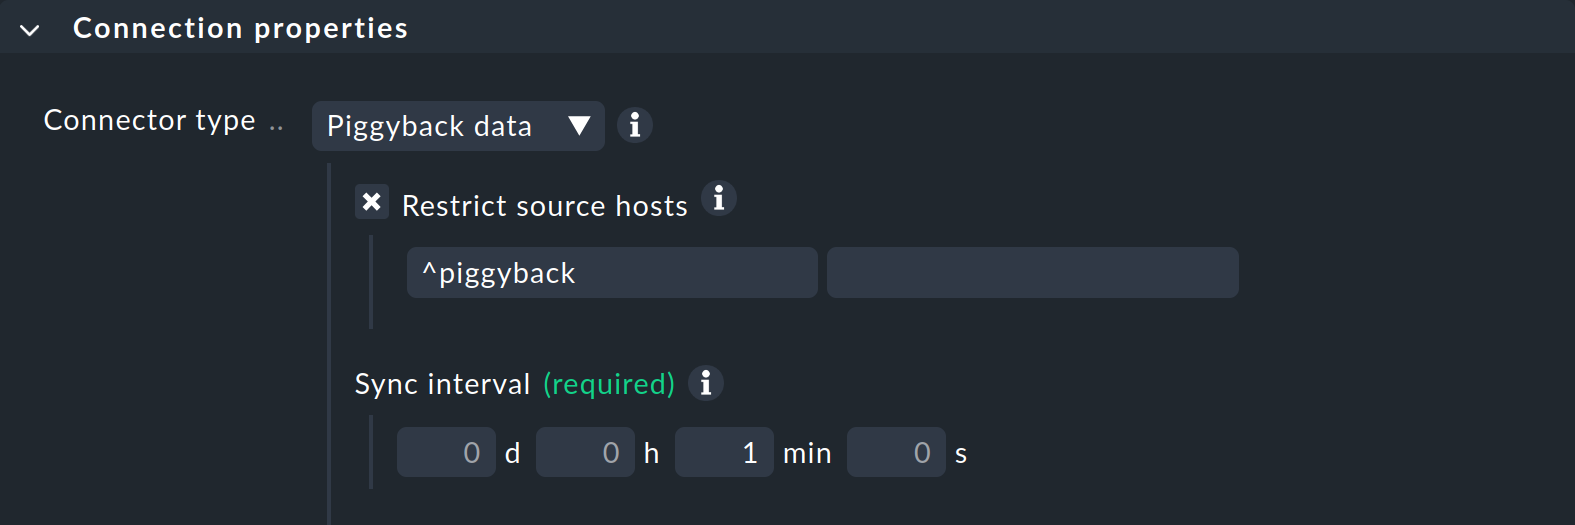
For a piggyback connection, select Piggyback data as the Connector type.
With Restrict source hosts, you can restrict this connection to specific hosts as sources. These are usually the hosts for which a special agent has been set up. Dynamic host management is only active for these hosts. The restriction is made in the corresponding input field, whose content is interpreted as a regular expression. Once you have edited the first input field, the next one will open automatically, meaning you can specify multiple regular expressions.
With the Sync interval, you can determine how often the connection should search for new hosts. If you have kept the regular check interval of one minute, there is no point in doing this much more frequently, as data can only change once per minute at most. In more dynamic environments, you can set both the check interval and the connection interval to significantly smaller values. However, this also results in higher CPU usage on the Checkmk server.
At least one entry must exist under Piggyback creation options. You can also add more using Add new entry:
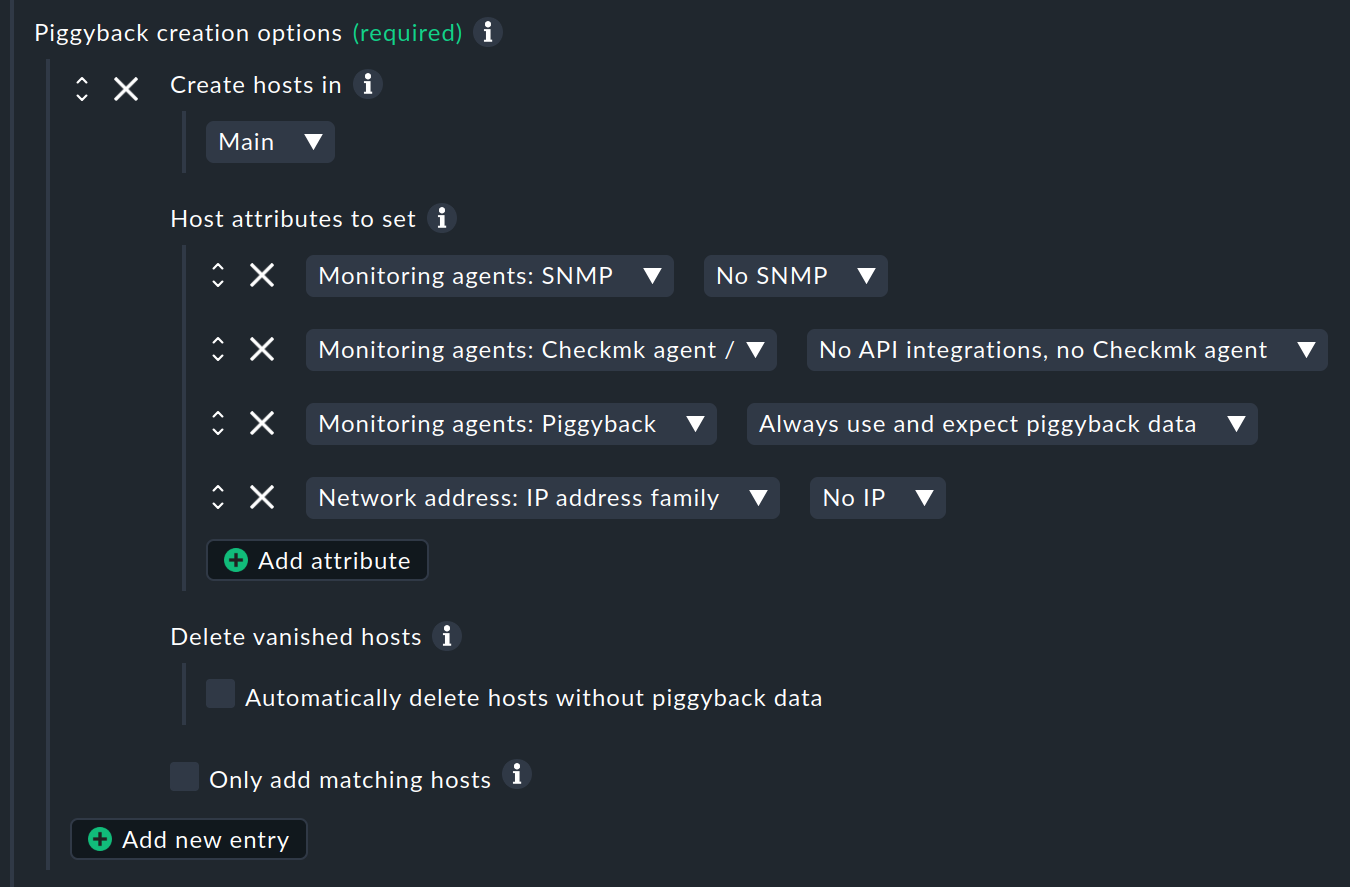
This section deals with the properties of automatically generated hosts, for which you can specify two important things: The folder in which the hosts are to be created (Create hosts in) and which host attributes are to be set. Four important attributes are preset, which are usually useful for piggybacked hosts:
No monitoring via SNMP.
No Checkmk agent on the host itself (data comes via piggyback).
Piggyback data is always expected (and an error occurs if it is missing).
The hosts do not have an IP address.
If you want to use the piggyback data on another site, activate the Add attribute option and then the Basic settings: Monitored on site option and specify the desired site.
Only if you activate the checkbox at Delete vanished hosts will hosts be deleted again if they have disappeared in your dynamic environment. If you do not want to automatically create all piggybacked hosts, you can restrict this with the option Only add matching hosts with an regular expression.
In the third and final part of the connection properties, you can specify that a service discovery is performed on the automatically generated hosts by activating the checkbox at Service discovery:
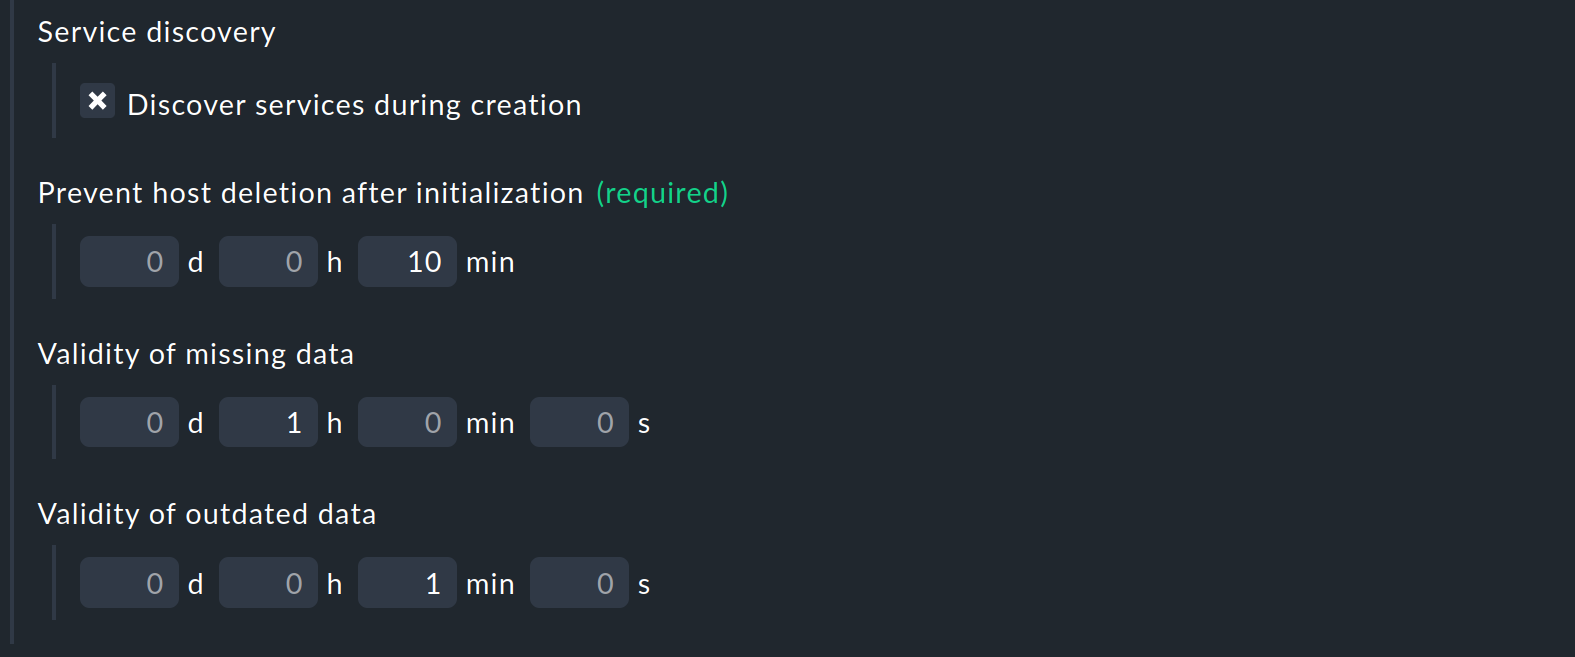
The remaining three options affect the deletion of automatically created hosts, a topic that is explained in detail in a separate chapter.
The option Prevent host deletion after initialization affects a complete restart of the Checkmk server itself. In this situation, the data from all hosts will initially be missing until they have been queried for the first time. To avoid unnecessary deletion and reappearance of hosts (which is also accompanied by repeated notifications of already known problems), deletion is generally not performed during the first 10 minutes by default. You can set this time here.
The option Validity of missing data deals with the case where a host, based on whose monitoring data several hosts were automatically created, no longer provides piggyback data. This can be the case, for example, if access to AWS and Co. no longer works. Or, of course, if you have removed the special agent from the configuration. The automatically generated hosts will then remain in the system for the set time before being deleted from the Setup GUI.
The option Validity of outdated data is similar, but deals with the case where data is still coming in, but no longer for some hosts. This is the normal case when, for example, virtual machines or cloud services are no longer available. If you want the corresponding objects to disappear from Checkmk promptly, set a correspondingly short time period here.
3.3. Properties of an OpenTelemetry connection
The options for creating a piggyback connection and an OpenTelemetry connection differ in one key aspect: While piggyback connections use the host names provided with the piggyback data, host names for OpenTelemetry data can be generated more flexibly. We will discuss this point in detail; all other properties of an OpenTelemetry connection will be covered in a quick overview.
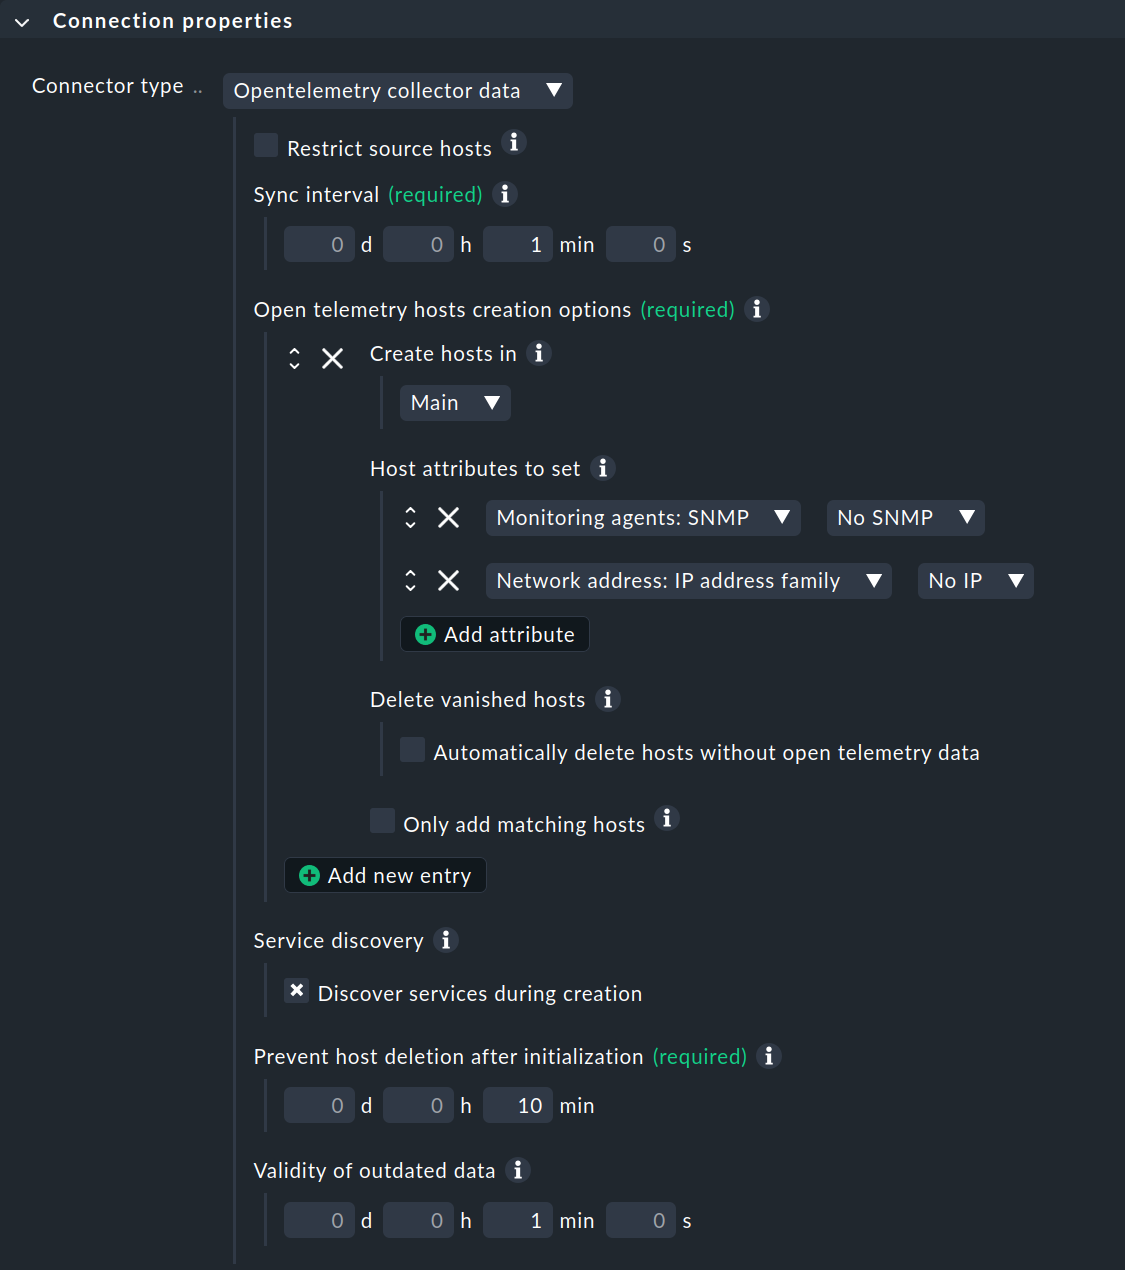
For an OpenTelemetry connection, select OpenTelemetry data - Metric backend as the Connector type.
Use Sync interval to specify how often the connection should search for new hosts.
The biggest difference from piggyback connections is Metric backend filter criteria.
Here, you can first use the Attributes to specify which data should be included when creating a host, and then determine which attribute should be used to generate the host name.
The image above shows the Resource attribute for hostname lookup field filled in with the service.name attribute, which generates a host from each Telemetry service name.
This is the default setting if you used the OpenTelemetry Quick Setup.
Open the help for the input field to get more detailed information.
You can find out which attributes are available for specific data using the interactive tool for creating custom graphs.
Under Open telemetry hosts creation options, you can specify the folder in which the hosts should be created (Create hosts in) and which host attributes should be set. Three attributes are preset:
Only data delivered via API integrations is used for monitoring.
SNMP is disabled.
The hosts do not have an IP address.
Only if you check the box under Delete vanished hosts will hosts be deleted once they have disappeared from your dynamic environment. If you do not want all hosts to be created automatically, you can use the option Only add matching hosts using a regular expression.
By checking the box next to Service discovery, you specify that a service discovery be performed on the automatically generated hosts. However, this will only produce the desired result if the special agent for OpenTelemetry is configured.
The last two options, Prevent host deletion after initialization and Validity of outdated data, affect the deletion of automatically created hosts. These options function as described in the section on piggyback connection. The deletion of automatically created hosts is explained in detail in a separate chapter.
3.4. Saving the connection
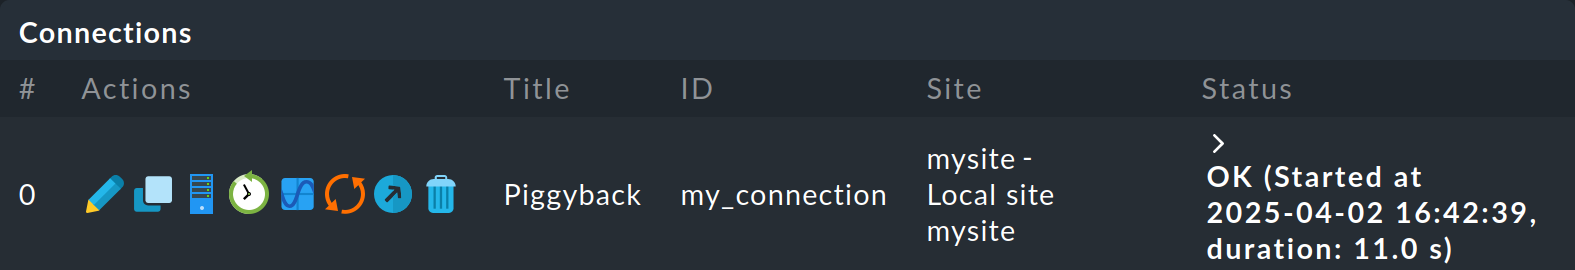
Once saved, the connection will appear in the connection list. However, it can only be executed after the changes have been activated. Only then will the connection start working.
Therefore, do not be confused by the message that initially appears in the Status column after saving:
Connection 'my_connection' isn’t found: consider activating changes
3.5. Activating the connection
After saving the connection properties and activating the changes, the connection will automatically start operating. If data is already available for this connection and you are expecting the corresponding hosts to be generated, you will soon see a corresponding entry in the list under Recent processing cycles, which might look something like this:

In the example image, you can see that this run is almost complete and that at least 50 hosts will be created at the end. If you refresh this page shortly afterwards, these changes will probably already have been automatically activated by dynamic host management. The result from processing the above example will then look like this:

The new hosts will then already be in monitoring and will be monitored regularly.
The Recent processing cycles list will display the cycles over a longer period of time that have actually resulted in changes.
Cycles of the connection that have not resulted in any changes will be hidden after a few seconds.
To view these anyway, click on the clock symbol ![]() in the Actions column, which will bring you to the Execution history of this connection.
in the Actions column, which will bring you to the Execution history of this connection.
3.6. Actions for a connection
For each connection, the connection list in the Actions column displays icons for performing actions:
Some of the following icons are only displayed for an activated connection:
| Icon | Action |
|---|---|
|
Opens the connection for editing. |
|
Clones the connection and opens it for editing. |
|
Displays a list of hosts created by this connection. |
|
Displays the execution history for the connection. |
|
Displays the status of dynamic host management, i.e., the current processing cycles. |
|
Executes the connection without waiting for the next processing cycle. |
|
Shows how the connection can be created with the Checkmk REST API. |
|
Deletes the connection after confirmation. |
4. Automatically deleting hosts
As mentioned above, hosts that 'no longer exist' can be automatically deleted from the monitoring by the dynamic host management. At first glance, this sounds very logical, however, exactly what 'no longer exists' means is a little more complex when one thinks about it, as there are various alternative cases to consider.
In the following overview we will assume that you have activated the option at Delete vanished hosts for the connection. Otherwise, hosts will never be deleted automatically.
| Situation | What happens? |
|---|---|
A connection is removed. |
If you deactivate a connection (with do not activate this connection in the General properties) or delete it completely, all hosts created by this connection are retained. If necessary, you must delete them manually. |
A piggyback host is no longer monitored. |
If you delete a piggyback host that you use to monitor your cloud or container environment from monitoring, it will of course no longer generate piggyback data. In this case, the automatically generated piggybacked hosts are by default automatically deleted after one hour. You can adjust this period using the Validity of missing data option. |
A piggybacked host is not reachable. |
If your cloud environment is unavailable and the Check_MK service that queries it goes to CRIT, the automatically generated hosts remain in monitoring indefinitely. There is no one-hour timeout here! |
An automatically created host is no longer included in the data. |
This is pretty much the norm in a cloud/container environment. In this case, by default the host is automatically deleted after one minute. You can adjust the time period using the Validity of outdated data option. |
The Checkmk server itself is stopped. |
Stopping all monitoring does cause data to become outdated, but existing hosts are of course not deleted as a result. The same applies when the Checkmk server is rebooted (which temporarily causes all data to be lost, as it is stored in the RAM disk). |
Note that with the Automatic host removal rule, it is possible for all hosts to be automatically deleted. Both options for lifecycle management work independently of each other, i.e., a host is deleted if one of the two conditions is met.
5. Configuration
The host manager settings allow you to customize the processing cycles of dynamic host management. You can access the dialog via Setup > Hosts > Dynamic host management > Host manager settings:
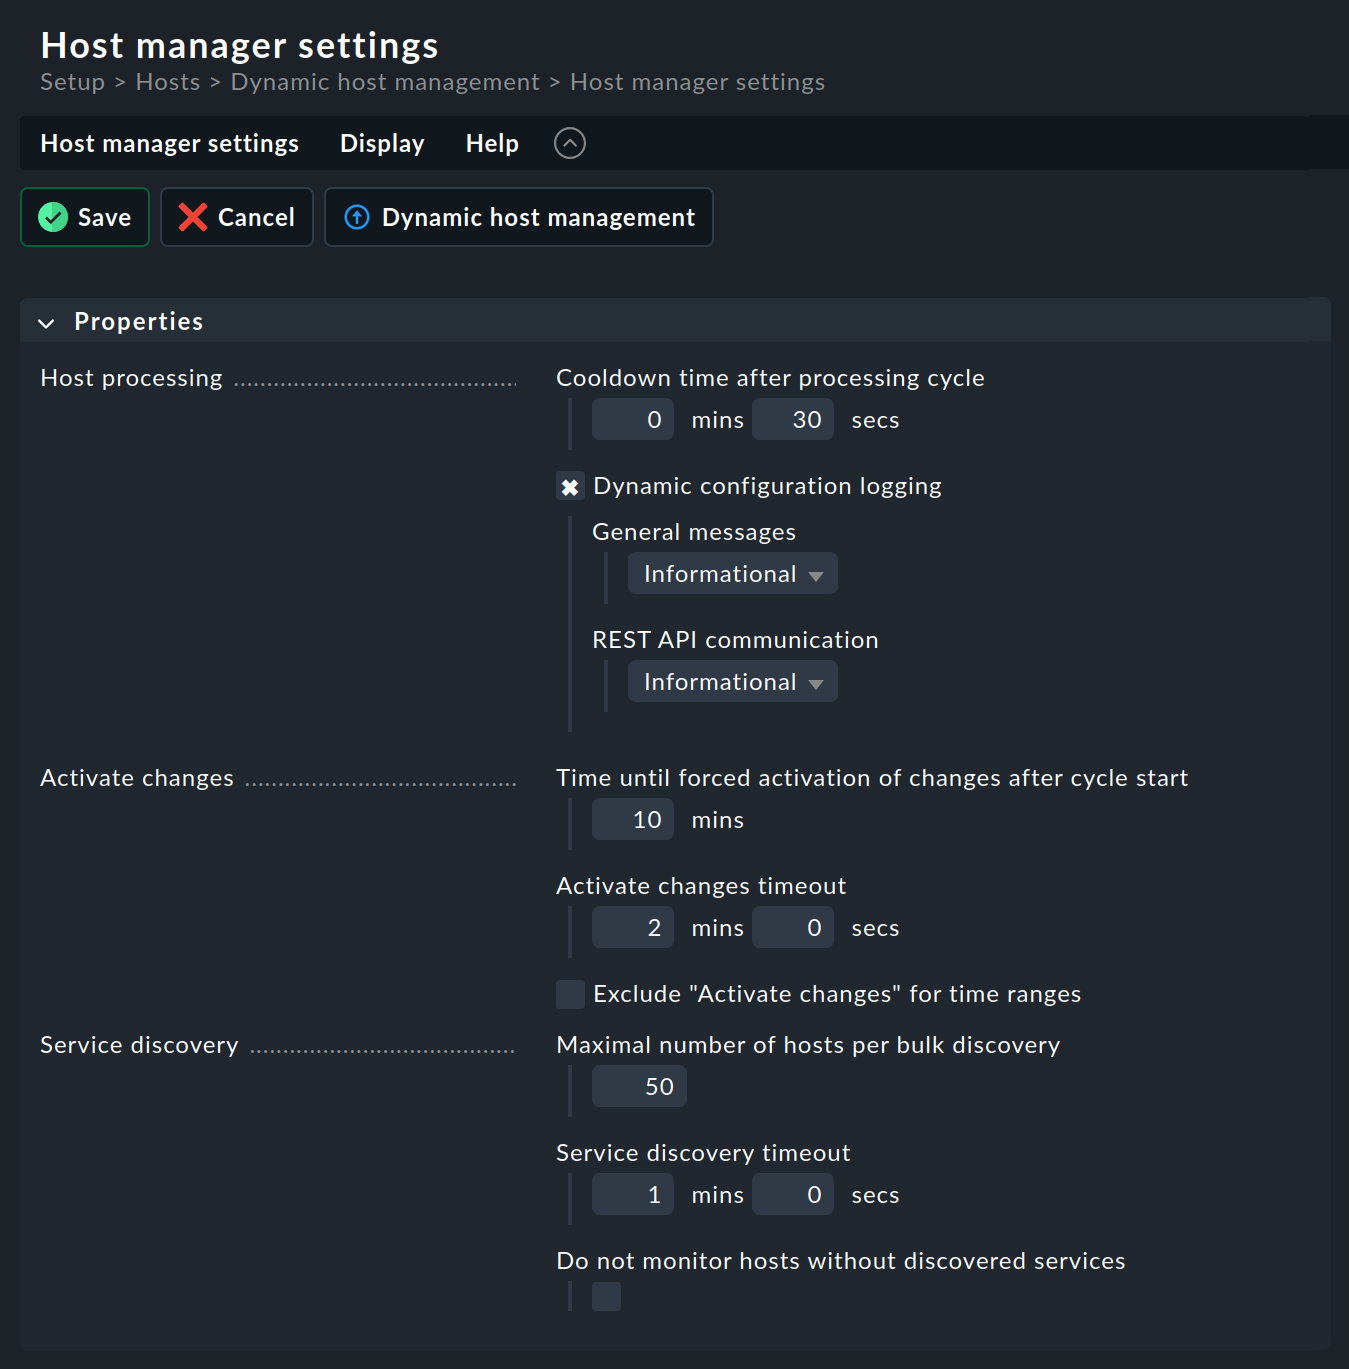
The default settings here are already selected so that they should work well even in larger and extremely dynamic environments. However, if your environment undergoes many changes every minute, these will create a certain load on your Checkmk server. To better control this load, the Host manager settings were introduced with Checkmk 2.4.0.
What the individual options do exactly is already described in great detail in the inline help and will therefore not be repeated here. In the following, we describe the three areas and what their functions are.
Host processing involves finding and assigning host-specific data from the available data. This answers questions such as whether new data has been found and whether hosts should be created for this data. If a large number of such decisions have to be made regularly, it may be useful to increase the pauses between runs to allow sufficient time for queues to be processed.
As a Checkmk administrator, you are probably already very familiar with the Activate changes function. This action determines how and when dynamic host management should activate changes and how long it can take to do so.
Even Service discovery itself will no longer be a big mystery to you. However, depending on the environment being monitored, a few more hosts may be waiting for bulk discovery in dynamic host management. Refer to the detailed inline help in such a situation so that you can intervene in a timely and targeted manner in the event of any delays in the dynamic host management process.
The last option in the group (Do not monitor hosts without discovered services) was introduced to handle a special situation. It is basically only required if pending changes are frequently forced without prior service discovery. This option should be activated with caution. However, if it is necessary, this may be an indicator that the previous options have not been optimally configured, or that the Checkmk server can no longer cope with the load generated by the dynamic host management.
6. Diagnosis
6.1. Execution history
If you want to watch the DCD at work, you will find the clock icon ![]() in the list of connections for each entry,
which will take you to the execution history:
in the list of connections for each entry,
which will take you to the execution history:
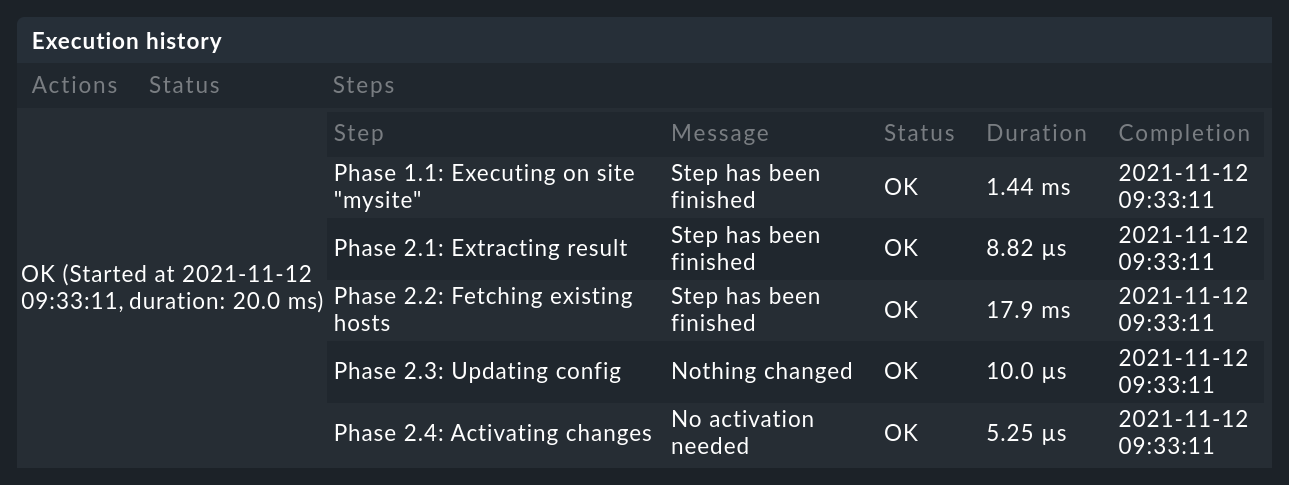
If, for any reason, the creation of a host fails, this will be visible in the execution history.
6.2. The DCD log file
The DCD log file is ~/var/log/dcd.log.
Here is an example that matches the previous illustration:
2025-08-21 11:46:18,962 [20] [cmk.dcd.Manager] 1 batches arrived 50, last activated is reset
2025-08-21 11:46:19,059 [20] [cmk.dcd.Manager] Batches: {281} = Create: 0 Edit: 0 Delete: 0 Discover: 0
2025-08-21 11:46:19,059 [20] [cmk.dcd.Manager] Skip batches {281}
7. Files and directories
| File path | Function |
|---|---|
|
This is where piggyback data is generated. A subdirectory is created for each piggybacked host contained in the piggyback data. |
|
This is where OpenTelemetry data is generated. A subdirectory is created for each host. The files created there are in JSON format. |
|
Log file of the Dynamic Configuration Daemon (DCD). |