1. Why command line?
When a Checkmk system has been installed, it can be 100 % configured and operated using the web interface. There are nonetheless situations in which it is useful to dive into the depths of the command line, for example:
when searching for the source of problems
when automating the administration of Checkmk with the REST API
when programming and testing your own extensions
to be able to understand how Checkmk functions internally
if you simply enjoy working with the command line!
This article will present the most important commands, files and directories of Checkmk.
2. The site user
2.1. Login as site user
When administering Checkmk, with a few exceptions you need never work as the root user.
In this article we will generally assume that you are logged in as a site user.
That is done with, e.g.:
It is also possible to make a direct SSH login to a site without a detour via root.
Since the site user is a ‘completely normal’ Linux user, you must simply assign a password for this (which requires root permissions, once only, for the configuration):
Afterwards an SSH-login directly from another computer should be possible (Windows-users preferably use PuTTY for this).
From Linux this login is simply performed with the ssh command:
At the first login a warning regarding an unknown host key will probably be received.
When you are certain that in this brief moment no attacker has taken over your operating system’s IP-address, you can simply verify it with yes.
You can also work with the command line on the Checkmk appliance. How that is done is explained in its own article.
2.2. Profile and environment variables
So that as few problems as possible arise, particularly as a result of individual distributions or differing operating system configurations, the Checkmk system ensures that the site user – and likewise all of the monitoring’s processes – always have a clearly defined environment. Along with the home directory and the permissions, the environment variables play an important role.
Among other things, when logging in as a site user the following variables will be set or modified. These variables are available for use in all processes running within the site. This also applies to scripts that are indirectly invoked by these processes (for example, a user’s own notification scripts).
|
The site’s name ( |
|
The path for the site directory ( |
|
Directories in which executable programs will be searched for.
For example, Checkmk keeps the site’s |
|
Directories in which additional binary libraries are searched for. Using this variable Checkmk ensures that libraries provided with Checkmk have priority over those installed in the normal operating system. |
|
Search path for Perl modules. Here, too, module variants delivered by Checkmk have priority in case of doubt. |
|
The language setting for command line commands.
This setting is adopted from the Linux installation.
This variable is automatically removed in the site’s processes, and the setting reverts to the default English!
This also affects other regional settings.
Removing |
With the env command you can output all of the environment variables – adding | sort to this command arranges the list a bit more clearly:
Under Linux the environment is an attribute of a process. Every process has its own variables, which it automatically passes on to sub-processes. These start initially with the same, inherited variables, but can also alter them.
With the env command you can always only view the current shell’s environment.
If you suspect there is an error in a particular process’s environment, with a small trick you can nonetheless output a listing of its environment.
For this you only need the process-ID (PID).
You can identify this with, e.g., ps ax, pstree -p or top.
With this you can then access the process’s environ file directly via the /proc file system.
Here as an example is a suitable command for the PID 13222:
If you require custom variables for your own scripts or other software to be run in the site,
store them in the ~/etc/environment file which has been specially created for this purpose.
All variables defined here will be available everywhere within the site:
# Custom environment variables
#
# Here you can set environment variables. These will
# be set in interactive mode when logging in as site
# user and also when starting the OMD processes with
# omd start.
#
# This file has shell syntax, but without 'export'.
# Better use quotes if your values contain spaces.
#
# Example:
#
# FOO="bar"
# FOO2="With some spaces"
#
MY_SUPER_VAR=blabla123
MY_OTHER_VAR=10.88.112.17
2.3. Customizing the shell
If you wish to customize your shell (prompt or other things), you can perform this as usual in the .bashrc file.
Environment variables nonetheless belong to ~/etc/environment, so that they are certain to be available to all processes.
There is also nothing to prevent you having your own .vimrc file if you like working with Vim.
3. The directory structure
3.1. The separation of software and data
The following graphic shows the most important directories in a Checkmk installation with a site named mysite and a <version> called for example 2.5.0p8.pro:
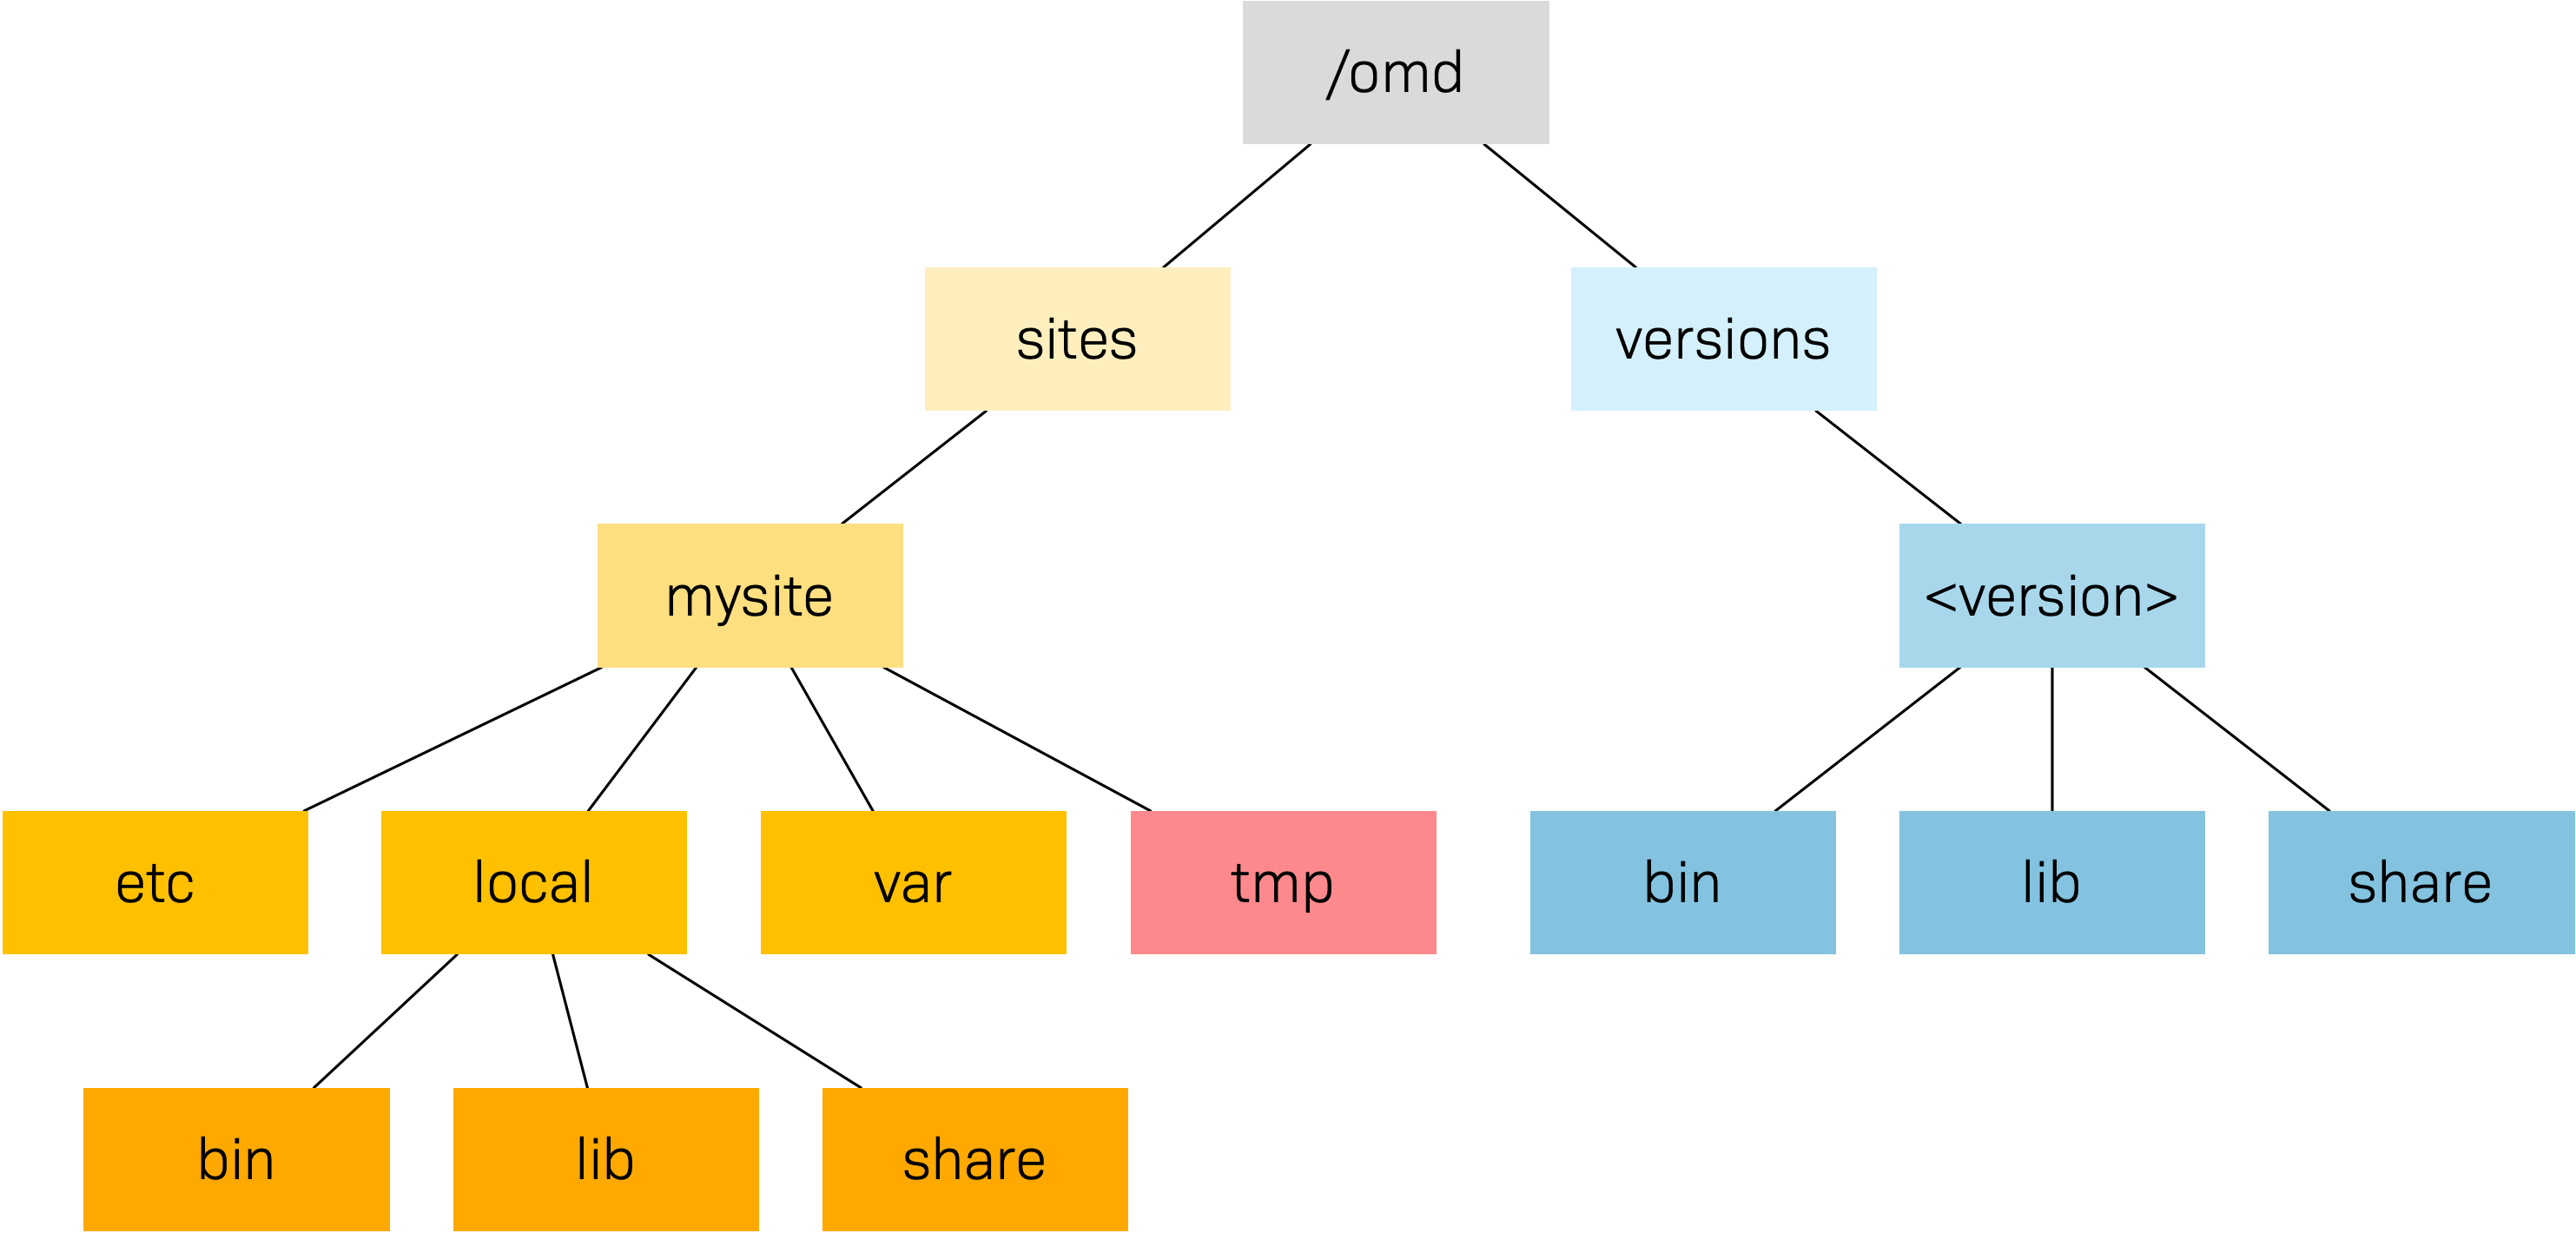
The basis for this structure is provided by the /omd directory.
Without exception, all of the files for Checkmk are found here.
/omd is in fact a symbolic link to /opt/omd, while the actual physical data is located in /opt
– but all data paths in Checkmk always use /omd.
Important is the separation of data (highlighted yellow) and software (blue).
The site’s data is found in /omd/sites/, and the installed software in /omd/versions/.
3.2. Site directory
Like every Linux user, the site user also has a home directory, which we refer to as the site directory.
If your site is named mysite it will be found in /omd/sites/mysite/.
As usual in Linux the shell abbreviates the its own home directory with a tilde (~) (or swung dash).
Since immediately following a login you will actually be in this directory, the tilde appears automatically in the input prompt:
OMD[mysite]:~$Subdirectories of the site directory are shown relative to the tilde:
A number of subdirectories are located within the site directory, these can be listed with ll (alias for ls -l):
As can be seen, the directories bin, include, lib, share and version are symbolic links.
The rest are ‘normal’ directories.
This mirrors the separation of software and and data as explained above.
The software directory must be accessible as a subdirectory in the site,
but it is physically located in /omd/versions/, and can also possibly be used by other sites.
| Software | Data | |
|---|---|---|
Directories |
|
|
Owner |
|
Site user ( |
Created by |
Checkmk installation |
Site creation, configuration, and monitoring |
Physical location |
|
|
File type |
Symbolic links |
Normal directories |
3.3. Software
The software directories, as usual under Linux, belong to root and thus may not be altered by a site user.
The following subdirectories are present – those in the example are physically located within /omd/versions/2.5.0p8.pro/, and they are accessible via symbolic links from the site directory:
|
Directory for executable programs.
Here the |
|
C-directories, plug-ins for Apache and Python – and in the |
|
The main part of the installed software.
Very many components are located in |
|
Contains include files for C-programs, which should be linked to libraries in |
The version symbolic link is a ‘intermediate stop’ and serves as a relay point for the version used by the site.
During a software update this will be switched from the old to the new version.
Nonetheless, do not attempt to perform an update manually by altering the link, since an update requires a number of other further steps – which will fail.
3.4. Data
The actual data for a site is found in the remaining subdirectories in the site directory. Without exception, these belong to the site user. The site directory itself is also included. Checkmk stores nothing apart from the directories listed there. You can create your own files and directories without problem here, in which tests, downloaded data, copies of log files, etc. can be kept as desired.
The following directories have been predefined:
|
Configuration files. |
|
Runtime data. |
|
Volatile data. |
|
Own extensions. |
3.5. Modifying and extending Checkmk – the local files
Some statements made in this section regarding the priority of local (site-specific) files over files with the same name in the software directory are no longer correct. We will update the relevant areas soon. |
As just shown in the above table, the ~/local/ directory with its numerous subdirectories is intended for your own extensions.
In a new site, all of the directories in ~/local/ are initially empty.
With the practical tree command you can quickly get an overview of the structure of ~/local/.
The -L 3 option restricts the depth to 3:
All of the directories in the lowest level are actively integrated in the software.
A file stored here will be treated in the same way as if it was in the directory with the same name within /omd/versions/…
(or respectively, in the logical path from the site in ~/bin/, ~/lib/ or ~/share/).
Example: In the site, executable programs will be searched for in ~/bin/ and in ~/local/bin/.
Here it applies that in the case of identical names the file in ~/local/ always has priority.
This enables modification of the software without the need to change installation files in /omd/versions/.
The procedure is simple:
Copy the desired file to the appropriate directory in
~/local/.Modify this file.
Restart the appropriate service so that the change can take effect.
Regarding point 3 above, if it is not known exactly which service to which the change applies, simply restart the complete site with omd restart.
3.6. Log files
In Checkmk – as already-described – the log files are stored in the data directory var/.
The log files of the relevant components can be found there.
The following output for one of the commercial editions is abbreviated:
On the web interface you can easily configure the extent to which data should be written to the log files
by searching in Setup > General > Global settings for all entries with logging:
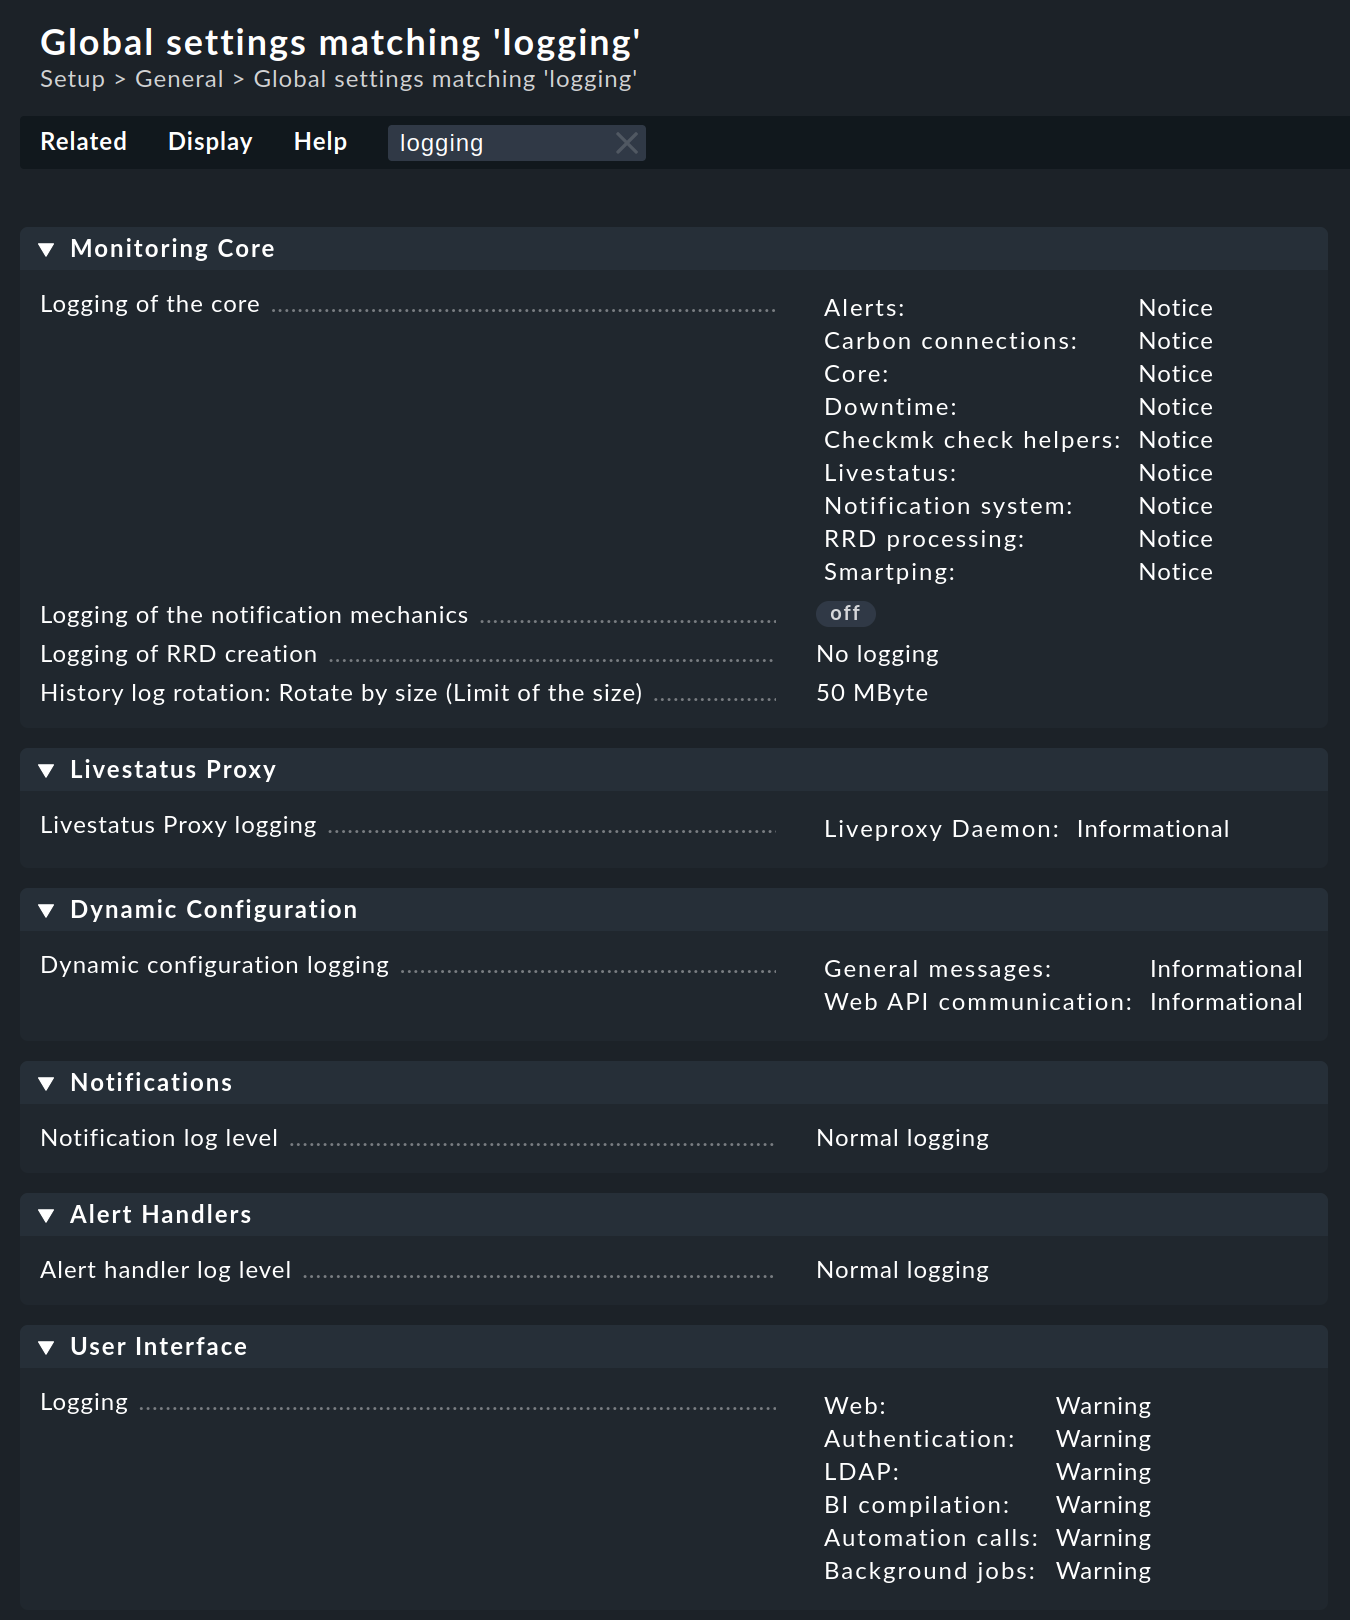
Log files can quickly become very large if a high log level has been set. It is generally advisable to use such settings for a temporary customization, as an aid in problem identification for example. |
4. The cmk command
Along with the omd command, which serves for starting and stopping sites, for the basic configuration of components,
and for starting a software update, cmk is the most important command.
With this a configuration for a monitoring core can be created, checks executed manually, a service discovery performed, and much more.
4.1. The command options
The command cmk is actually an abbreviation for check_mk, introduced to make the command faster to type.
The command includes a built-in, very detailed online help, that can be called up with --help option:
As you can see in the command above, we have called help with the option -h instead of --help.
Because what is true for the command itself is also true for its options:
The less there is to type, the faster it goes.
Not for all options, but for those that are often needed, there is therefore a short form in addition to the long form.
Even though the long form is more intuitive, especially for beginners (check_mk --list-hosts) than the short form (cmk -l), we will use the short form in the User Guide.
If in doubt, you can always consult the command help.
A longer look in the command help is a good idea in any case, as we will not present all options in the User Guide.
By entering an option, you start the command cmk in a certain mode.
Here follows the overview of the options we will present in this chapter, but also in other parts of the manual:
| Option | Function |
|---|---|
Monitoring core | |
|
|
|
|
|
|
|
|
Checks | |
|
Executing checks on host |
Services | |
|
|
|
Runs the discovery check on the host, which checks for new and disappeared services and for new host labels.
When a change occurs, the host is 'marked' by creating a file with the host name in |
Agents | |
|
|
|
|
Diagnostics | |
|
|
|
|
|
|
Information | |
|
Displays the Checkmk version installed in the site. |
|
|
|
|
|
Showing a check plug-in manual page (here of plug-in |
Special topics | |
|
Deletes the DNS cache and re-creates it. For details on the DNS cache, see the article on hosts. By default, this command is executed in a Checkmk site once a day via cronjob. |
|
Deletes all obsolete piggyback data in the |
|
|
|
Pulling an SNMP walk from host |
|
|
|
|
In some modes, further, specific options are available to you,
e.g. you can limit the service discovery to certain checks, e.g. to the check df with the command cmk -I --detect-plugins=df myserver123.
A number of options always work — regardless of the mode with which the command is executed:
| Option | Function |
|---|---|
|
Prompts |
|
The same as the above, with even more details: ‘very verbose’ |
|
The information is read from cache files, even if they are out of date.
The agent is only contacted if no cache file exists.
The cached agent data of the host can be found in |
|
Works like |
|
The information is always fetched up to date, i.e. no cache files are used. |
|
For SNMP hosts: instead of accessing the SNMP agent this uses a stored SNMP walk, that has been previously pulled with |
|
If an error occurs, this option ensures that it will no longer be intercepted, rather the original Python exception will be displayed in full.
This can be important information for the developer, by showing the exact program location in which the error is located.
It will also be very helpful with locating errors in self-written check plug-ins.
If when invoking |
In the following section we will show how the commands can be used. The example outputs are mostly shown in an abbreviated form.
4.2. Commands for the monitoring core
The commercial editions utilizes the Checkmk Micro Core (CMC) as its monitoring core, ![]() Checkmk Community uses Nagios.
An important task for the
Checkmk Community uses Nagios.
An important task for the cmk is the generation of a configuration file that is readable for the core,
and which contains all of the configured hosts, services, contacts, contact groups, time periods, etc.
On the basis of this information the core knows which checks are to be executed and which objects it should provide to the GUI via Livestatus.
For Nagios as well as for the CMC, it is fundamental that the number of hosts, services and other objects always remains static during the operation, and that this number can only be altered through the generation of a new configuration, followed by a reloading of the core. With Nagios, this requires a restart of the core. The CMC has a very efficient function for the reloading of its configuration during active processing.
The following table highlights important differences between the configurations of both cores:
| Nagios | CMC | |
|---|---|---|
Configuration file |
|
|
File type |
Text file with |
Compressed and optimized binary file |
Activation |
Core restart |
Core command for reloading the configuration |
Command |
|
|
Regenerating the configuration is always necessary
if the contents of the configuration files in ~/etc/check_mk/conf.d, or automatically-detected services in ~/var/check_mk/autochecks have been modified.
The Setup keeps a record of such changes and highlights them in the GUI as to activating changes.
The following commands are available for activation via the command line:
| Option | Function |
|---|---|
|
Generates a new configuration for the core and restarts the core (analogous to |
|
Generates the configuration for the core and loads this without a restart of the active processing (analogous to |
|
Generates the configuration for the core without activating it. |
|
For diagnostic purposes, this outputs the configuration to be generated on the standard output, without altering the actual configuration file.
Here you can enter a host name simply in order to view the host’s configuration (e.g. |
4.3. Executing checks
A second mode in Checkmk deals with the execution of a host’s Checkmk-based checks. With this you can allow all automatically detected, and also manually configured services, to be immediately checked, without needing to bother yourself with the monitoring core or the GUI.
To do this, enter cmk --check followed by the name of a host configured in the monitoring.
Since the --check option is the default option of cmk, you can also omit it.
In addition, you should always add the two options -n (do not send results to the core) and -v (output all results).
More on this in the description of the options below.
Further tips:
Do not use this command in monitored production hosts which use log file monitoring. Log messages are only sent once by agents, and it can happen that a manual
cmk -nv‘catches’ these and that they will then be lost from the monitoring. In such a situation use the--no-tcpoption.If Nagios is being used for the core and
-nis omitted, the effect will be an immediate actualization of the check results in the core and in the GUI.The command is useful when developing your own check plug-ins, because it enables a quicker test than by using the GUI. If the check fails and returns an UNKNOWN, the
--debugoption can help to find the problem location in the code.
The following options influence the command:
| Option | Function |
|---|---|
|
Check results output: Without this option you will only see the output from the service Check_MK itself, and not the results from the other services. |
|
Dry run: Results are not passed to the core, the performance counter is not updated. |
|
Restricts the execution to the check plug-ins |
4.4. Retrieving agent output
The command cmk -d retrieves and displays the output from a host’s Checkmk agent.
With cmk -d agent data is retrieved in the same way as with the monitoring. It is neither validated nor processed.
Thus the data showed exactly matches the data that is turned over to the Agent Controller (when TLS encryption is enabled) or to a tunneling program in case data source programs are configured.
You can even run cmk -d using the name or IP address of a host that is not configured in the monitoring.
In this case legacy settings for the host will be assumed (TCP connection to port 6556, no Agent Controller, no encryption, no data source program).
4.5. Baking agents
In the commercial editions you can also bake the agents from the command line, as you would otherwise do via the web interface. This gives you the option, for example, of updating the agents regularly, for example via a cronjob.
To bake the agents, use the option -A followed by the name of a host (or several):
The output shows that the agent packages available for the host myserver123 have been successfully baked.
If you do not specify a host, the packages will be baked for all hosts.
The command only bakes when necessary. If the packages are still up to date, the output will look something like this:
You can still force baking with the -f (force) option.
4.6. Listing hosts
The cmk -l command simply lists the names of all hosts configured in the Setup:
Because the data is provided ‘naked’ and ‘unprocessed’, it is easy to use in scripts – for example a loop across all host names can be constructed:
If, instead of echo you insert a command that performs something meaningful, this can be really useful.
The cmk --list-tag invocation likewise outputs host names, but also offers the possibility of filtering by host tags.
Simply enter a host tag and you will receive all hosts having this tag.
The following example lists all hosts monitored by SNMP:
Enter multiple tags and they will be linked with AND. The below command delivers all hosts that are monitored by both SNMP and Checkmk agent. As no hosts fulfill this condition, the output remains empty:
4.7. Displaying host configuration
For one or more specified host, cmk -D displays the configured services, host tags, labels and other attributes.
Because the list of services is so extensive it can look somewhat confusing on the terminal.
Send the output through less -S to avoid a break:
4.8. Information on the check plug-ins
Checkmk provides a large number of ready to use check plug-ins as standard.
In every version a few new ones are added, and version 2.5.0 already includes more than 2,000 plug-ins.
Three cmk command options give you access to information about these plug-ins.
cmk -L produces a table of all plug-ins with their name, type and a description.
At the same time, any self-written plug-ins stored in ~/local/ will also be listed.
The following are possible types:
|
Evaluates data from agent plug-ins or special agents. The agent is (normally) retrieved via TCP Port 6556. |
|
Serves the monitoring of devices via SNMP. |
|
Calls an active check. This includes Nagios-compatible third-party plug-ins for which Checkmk only adopts the configuration. |
The list can of course be filtered simply with grep if something specific is being searched for:
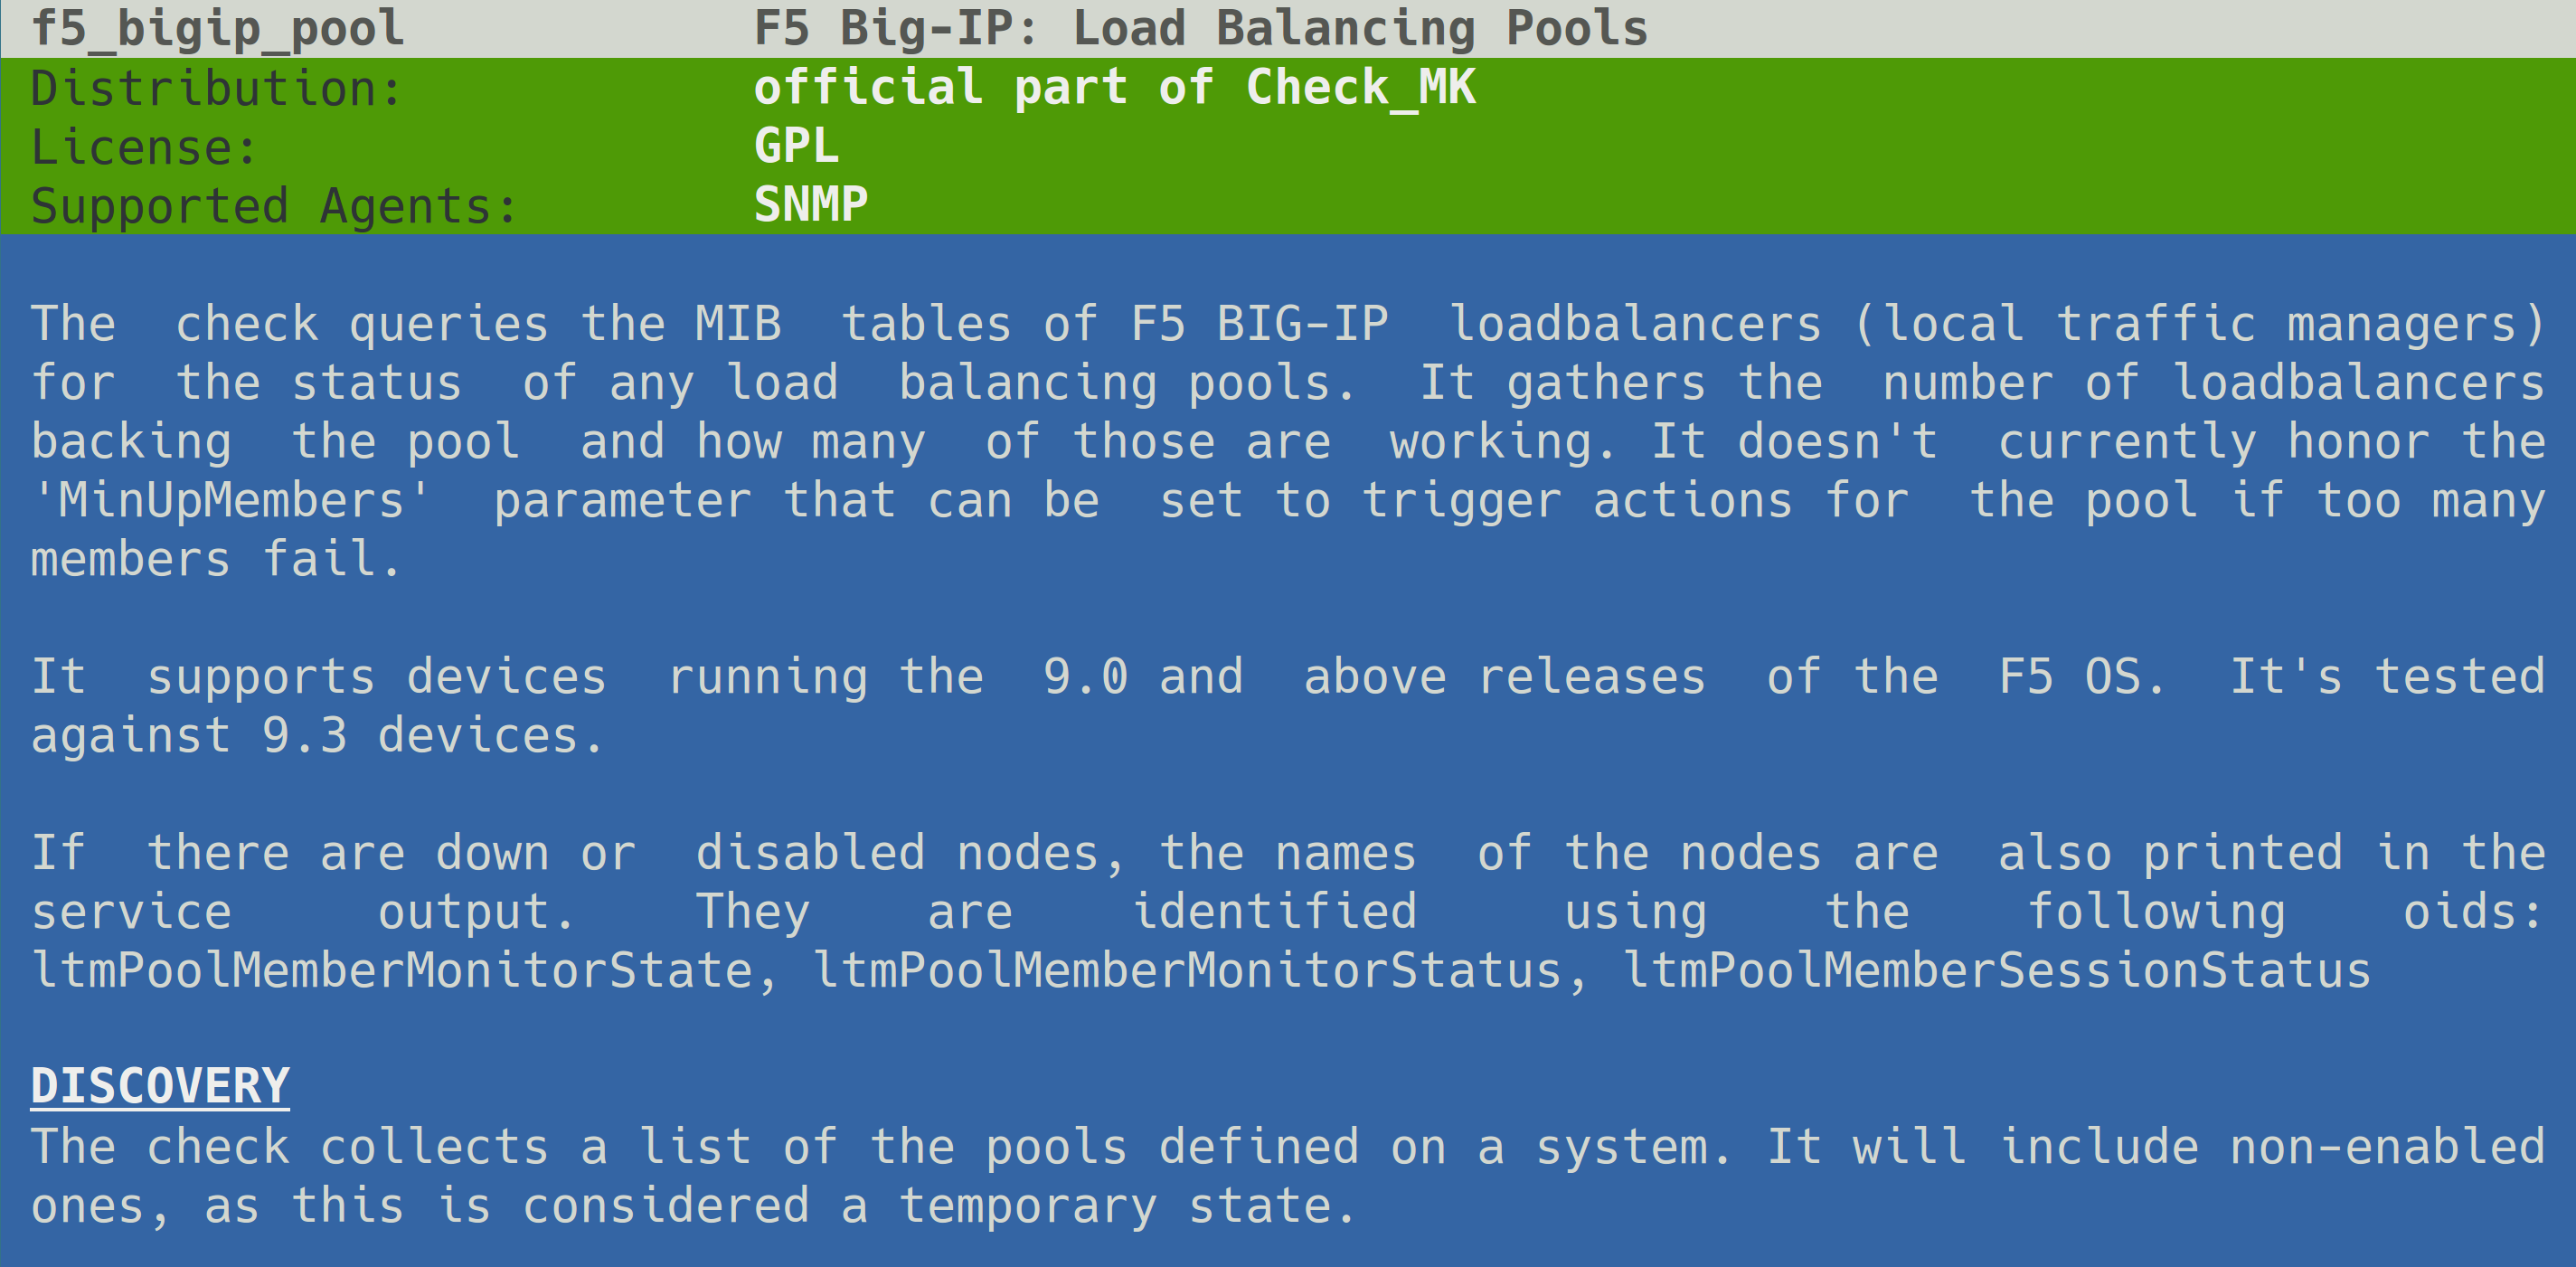
If you want more information on a certain plug-in, documentation as manual page can be called up with cmk -M:
This produces the following output:
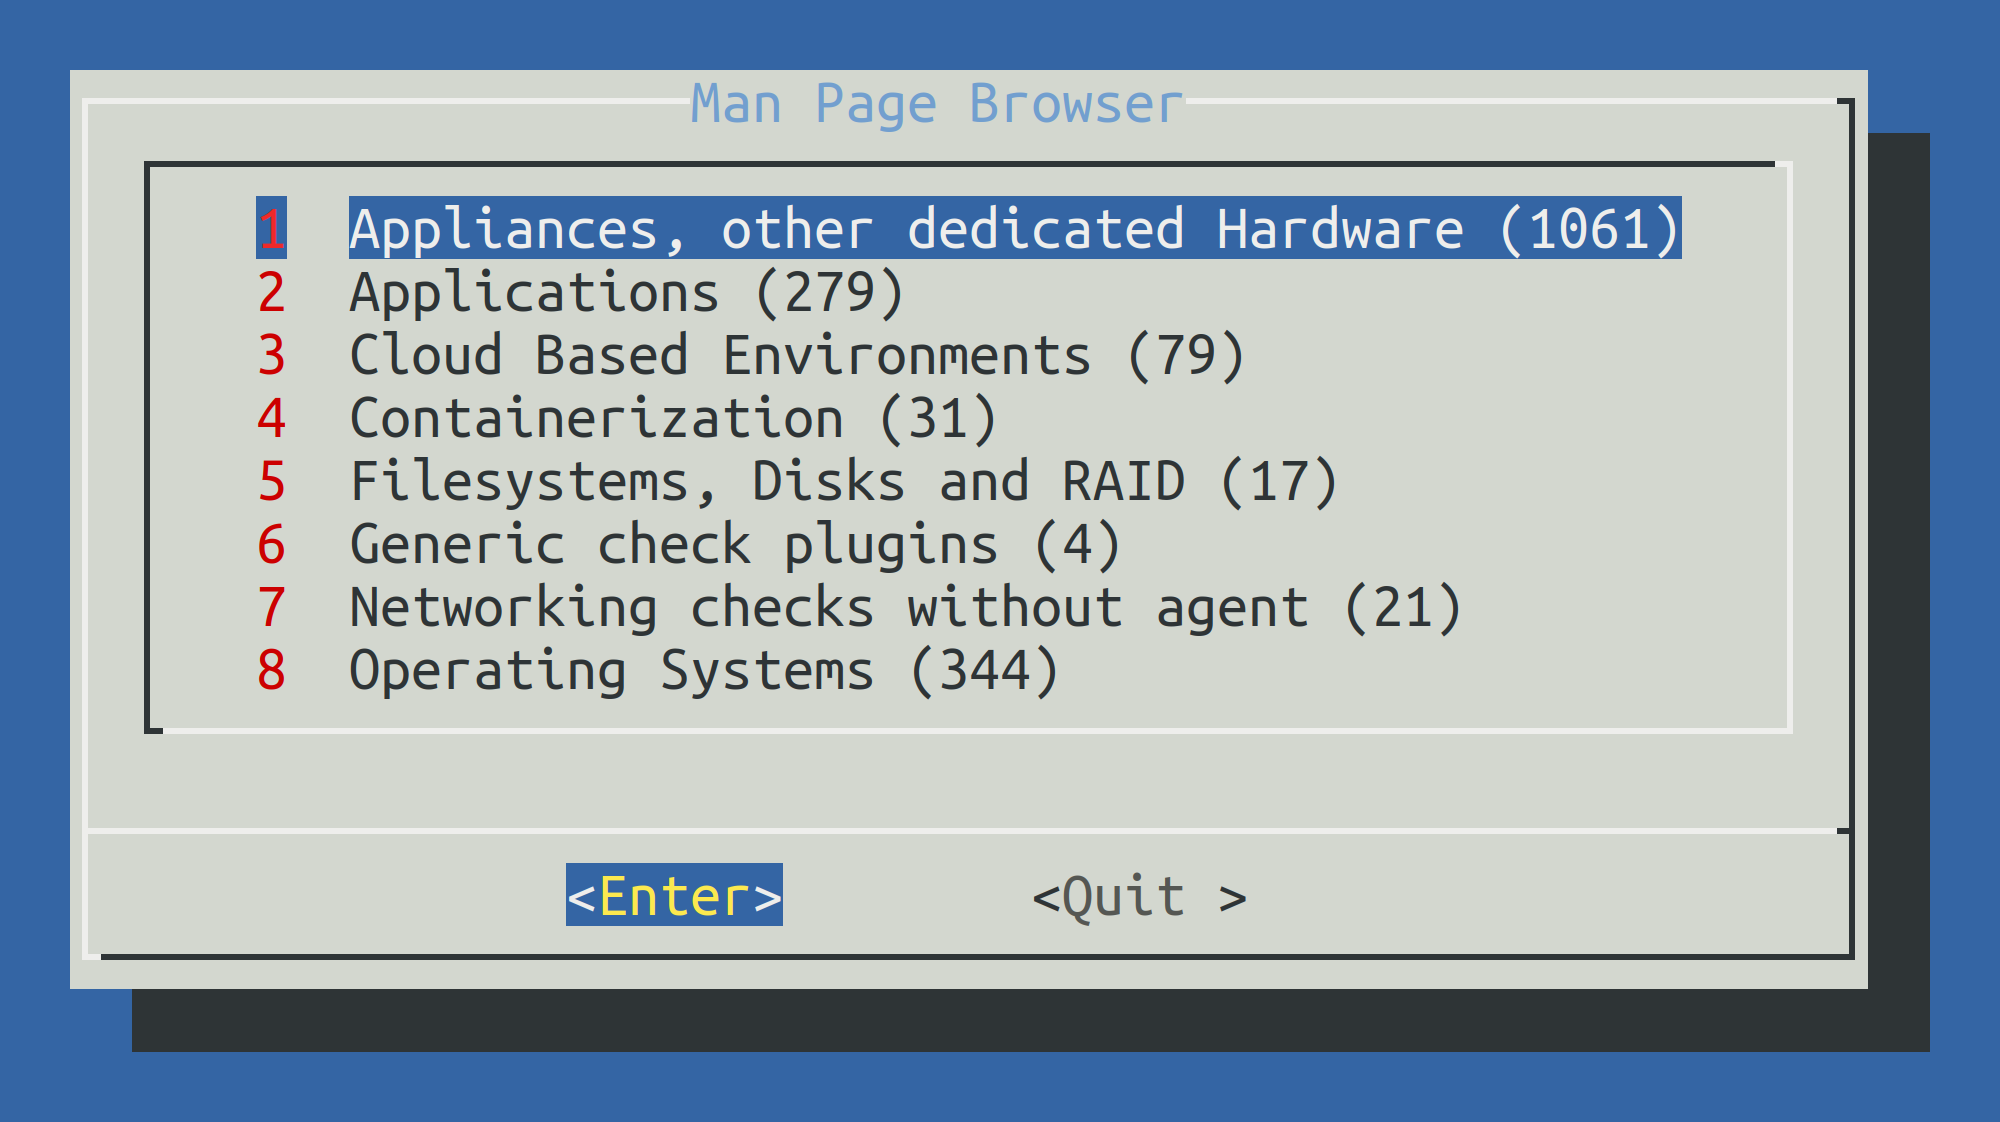
Using cmk -m with no further options will access a complete catalog of all check plug-ins manual pages.
You can navigate interactively in this catalog:
5. Configuration files
Knowing the location and structure of configuration files can often help with resolving problems and identifying errors, for example, in extensions downloaded from the Checkmk Exchange or self-programmed.
The comparison between Setup and configuration files in this chapter is not intended to encourage the modification of configuration files using scripts. If it is necessary to automate configuration changes, this can be done safely and without side effects using the REST API.
Do not make any changes to configuration files unless you have been explicitly instructed to do so by a Checkmk support representative, because… There be dragons! |
5.1. Where is the documentation?
Not here. Configuration files are defined by the components that write and read them. Ultimately, only by looking at the source code and associated tests can the structure of the configuration stored in the file system be revealed.
Also note that configuration file formats may change between patch versions. In this case, migration routines ensure the conversion of changed data formats.
Furthermore, the units used may differ between the display in the Setup and the storage in the configuration file. This applies, for example, to the display of time ranges or temperatures.
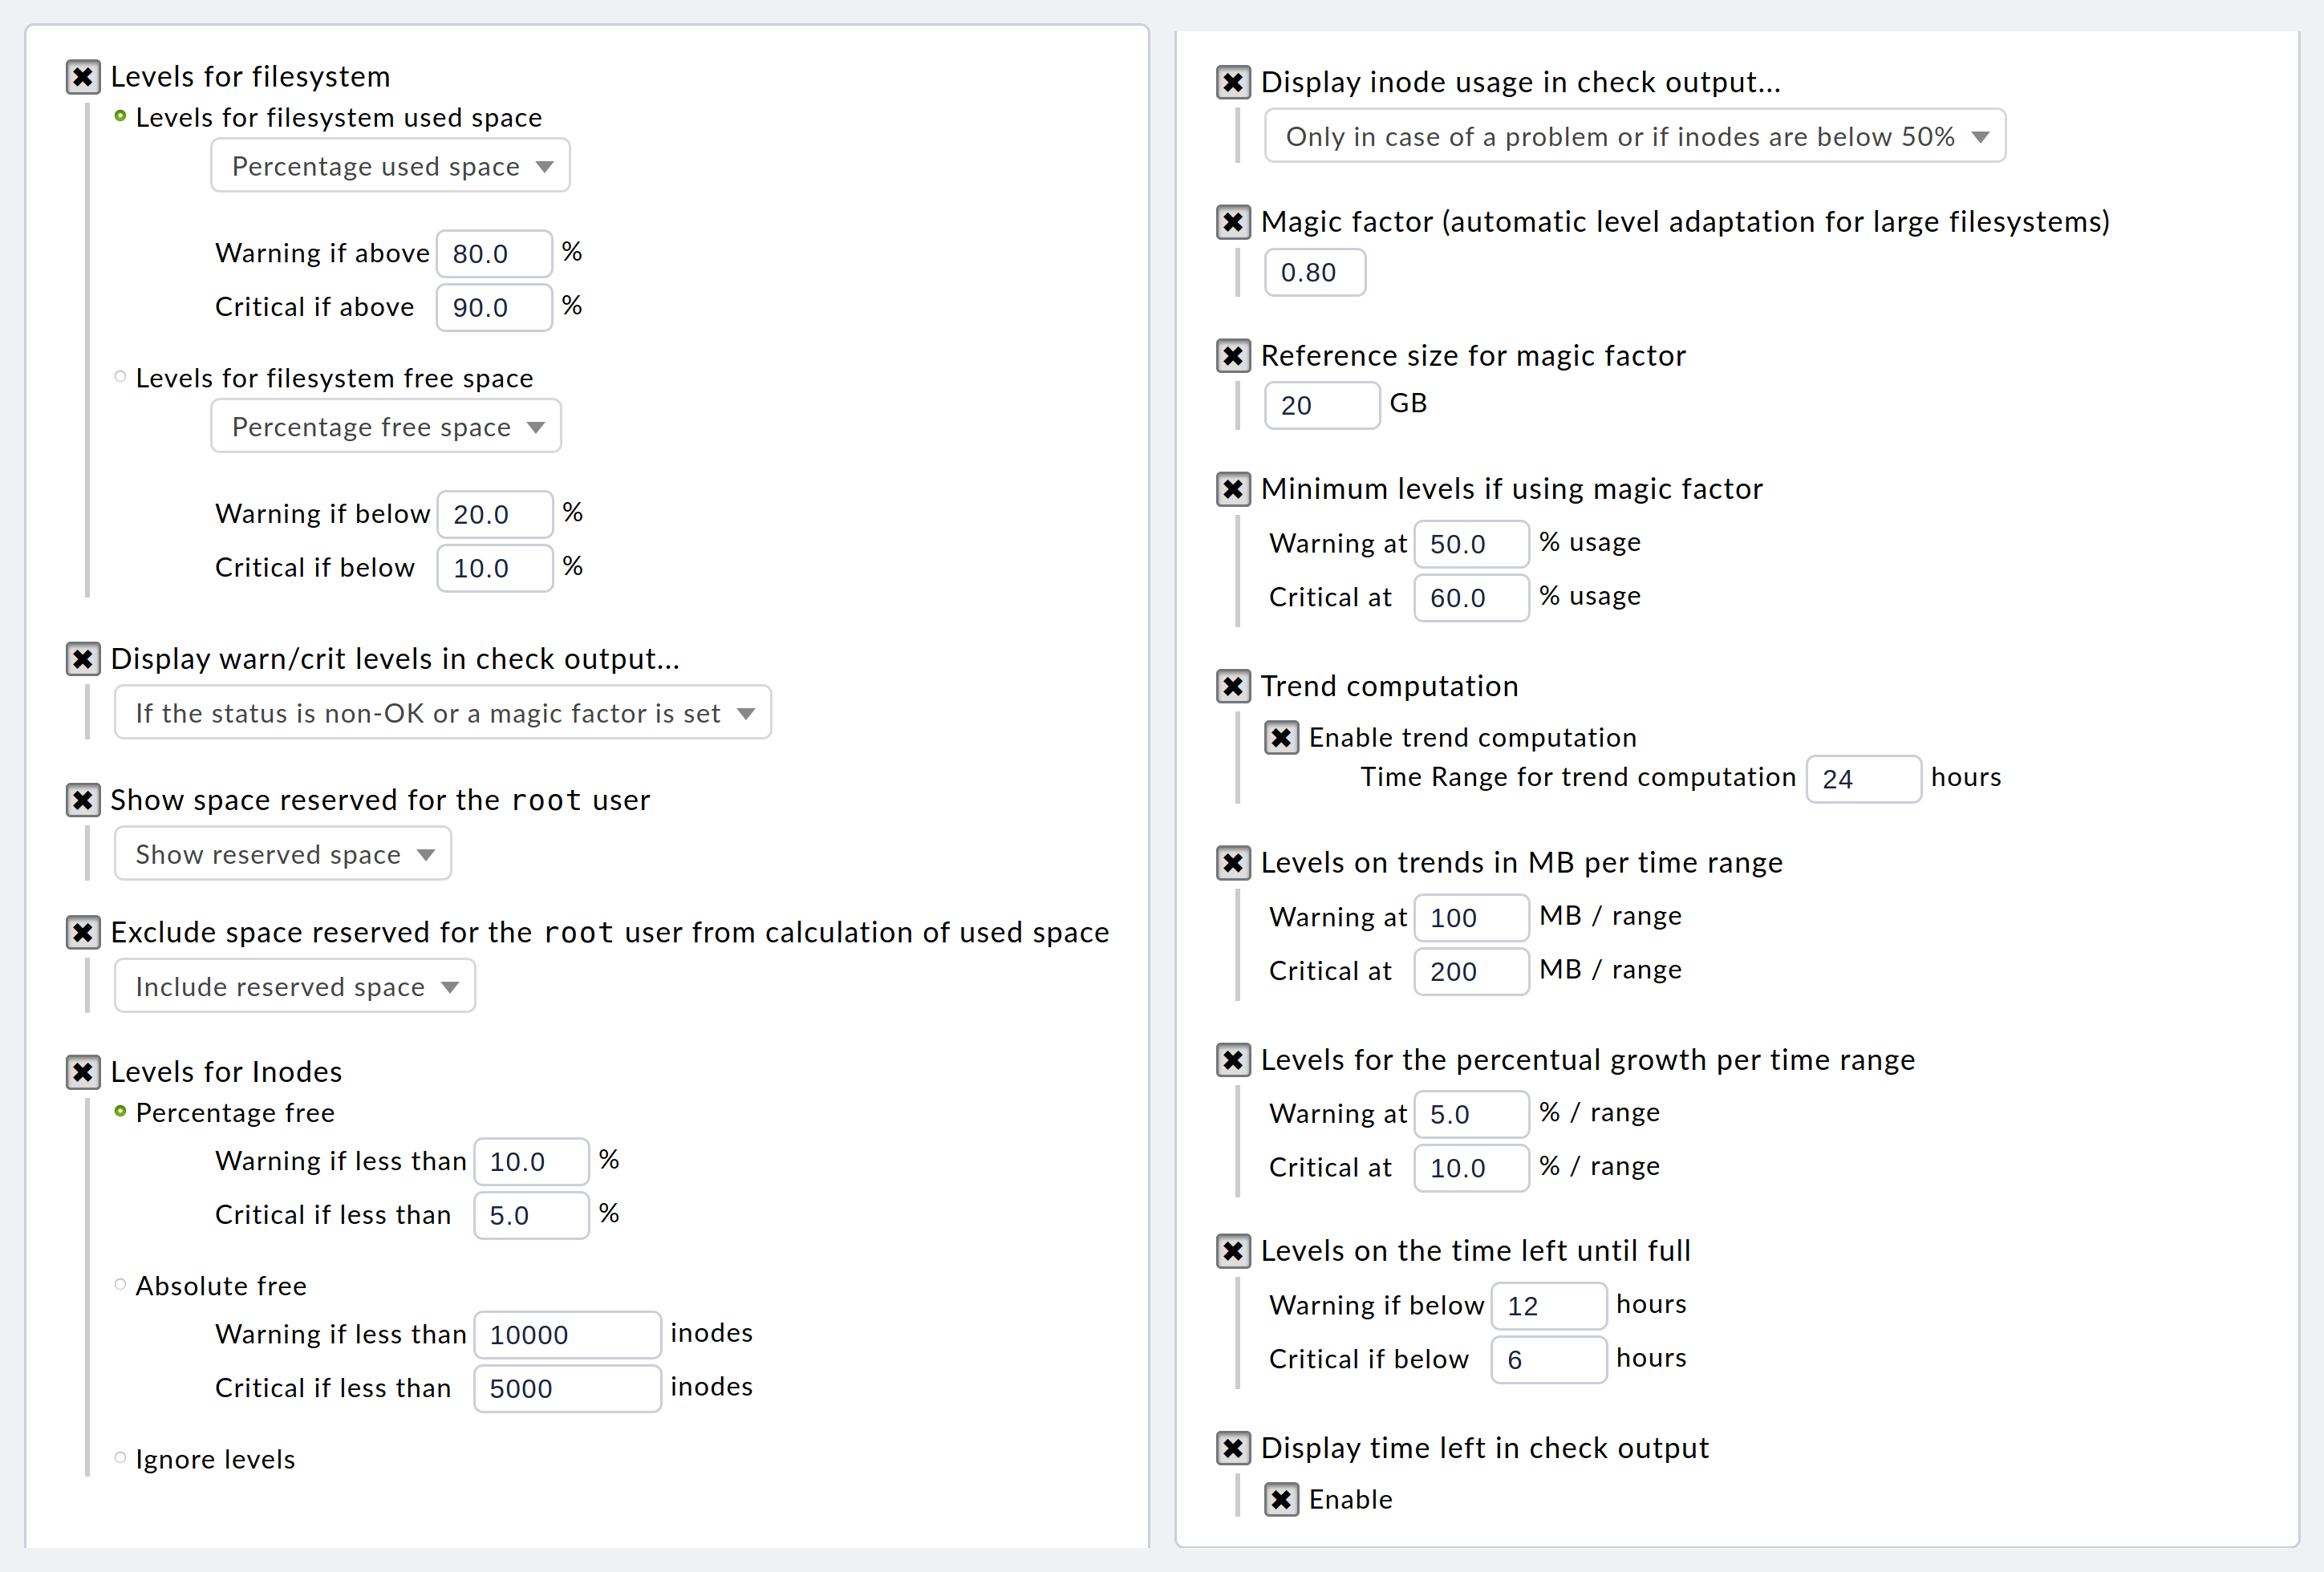
The following example shows a complete set of parameters for the check plug-in that monitors file systems in Checkmk (here in an older version). Due to the large number of parameters, the screenshot has been split into two parts and set in a small font:
The corresponding section in the actual configuration file looks like this (formatted a little more neatly):
{ 'inodes_levels'      : (10.0, 5.0),
  'levels'             : (80.0, 90.0),
  'levels_low'         : (50.0, 60.0),
  'magic'              : 0.8,
  'magic_normsize'     : 20,
  'show_inodes'        : 'onlow',
  'show_levels'        : 'onmagic',
  'show_reserved'      : True,
  'subtract_reserved'  : False,
  'trend_mb'           : (100, 200),
  'trend_perc'         : (5.0, 10.0),
  'trend_perfdata'     : True,
  'trend_range'        : 24,
  'trend_showtimeleft' : True,
  'trend_timeleft'     : (12, 6)},
As can be seen, there are more than 10 different parameters here, each of which follows its own logic.
Some are configured using floating point numbers (0.8), others using integers (24), some using keywords ('onlow'), others using Boolean values (True), and finally some using tuples such as ((5.0, 10.0)).
This example shows just one of over 2,000 plug-ins. In addition, Checkmk recognizes other configurations as check parameters: Just think of time ranges, Event Console rules, user profiles, and much more.
When it comes to the names of file directories, files, or even file contents, you will often find the abbreviation |
5.2. Which configuration file is currently being used?
There is a handy command for finding out which file Setup has just changed: find.
Called with the following parameters, you will find all files (-type f) in ~/etc/ that have been changed within the last minute (-mmin -1):
The basis of the configuration is always the ~/etc/check_mk/ directory.
This is divided into various domains, most of which relate to a specific functionality.
Each domain has a directory ending in .d, from which all files ending in .mk are automatically read in alphanumeric order.
5.3. Setup and configuration files
Within the .d/ configuration directories, there is always a subdirectory called wato, e.g., ~/etc/check_mk/conf.d/wato/.
The Setup usually only reads and writes to this directory.
However, the service responsible for the configuration directory also reads the other files in its 'own' .d directory.
If files are located outside the wato/ directory, they were either created manually at some point in the past with the aim of making changes that are effective but not visible in the Setup, or they were created by other components in Checkmk.
Locked files and folders
Various automation mechanisms that work within Checkmk or access Checkmk from outside (e.g., via REST API) can make configuration changes. In some cases, it is desirable that hosts and folders created in this way are visible and verifiable in the Setup, but it is not desirable that changes are made by 'human' users. In such cases, hosts or folders can be locked.
You can recognize a hosts.mk file of a locked host by the line with the lock attribute:
# Created by WATO
# encoding: utf-8

_lock = True
When opening such a folder in the Setup, the following message will be displayed above the hosts list:

All actions that would require a change to the hosts.mk file are then locked in the GUI.
Incidentally, this does not affect service discovery.
The configured services of a host are stored under ~/var/check_mk/autochecks/.
Folder properties can also be locked.
This is done by an entry in the folder’s .wato file. In the file’s dictionary, the lock key then has the value True:
{'title': 'My folder',
 'attributes': {},
 'num_hosts': 1,
 'lock': True,
 'lock_subfolders': False,
 '__id': '7f2a8906d3c3448fac8a379e2d1cec0e'}
If the value of the lock_subfolders key is set to True, the creation and deletion of subfolders is prevented.
5.4. File content and syntax
Configuration files can be text files that can be viewed in any editor, or binary files that require special tools. Text files follow the Python syntax, but there are differences in how they are handled by Checkmk:
Files that contain variable assignments (
=) are executed like a script, e.g.,hosts.mk.Files that only contain simple values or Python dictionaries are read as variables, e.g.,
.wato.
UTF-8 is always used for the character encoding. If you need to make modifications for any reason, make sure that the modified file can still be parsed by Python.
Binary files have the extension .pb, which stands for Protocol Buffers and is sometimes also called Protobuf.
This format, developed by Google for serializing configuration and messages, can be written and read with low overhead.
However, special tools are required to view it.
The Checkmk package includes protoc, which performs many simple tasks.
For example, the following provides a ‘raw‘ insight into the last status of a stopped CMC:
For a more detailed analysis of Protobuf files, you can use protoscope.
5.5. Verifying configuration files
If you suspect that configuration files may be corrupted (e.g., due to a defective data carrier), you can have them checked.
Checkmk provides the cmk-validate-config program for this purpose, which, unlike cmk-update-config, which is called during a software update, does not make any changes such as migrating data formats.
cmk-validate-config checks both syntax (parentheses, correct assignments, etc.) and partially semantics (data types used and the presence of certain keys). If the program encounters syntax errors, the first damaged file will be displayed:
If the checked files are OK, a list of all examined files will be displayed: