1. Preface
![]() There is already a separate Monitoring Kubernetes article describing the setting up of a monitoring of Kubernetes and its various flavors.
However, since OpenShift in general and in particular its setup work a bit differently, we have decided to create a separate article for describing the setting up of an OpenShift monitoring and respectively the Kubernetes clusters running in it.
In the rest of this article, we will refer to these same clusters — for readability and simplicity — as OpenShift clusters.
Monitoring OpenShift clusters is only possible with one of the Checkmk commercial editions.
There is already a separate Monitoring Kubernetes article describing the setting up of a monitoring of Kubernetes and its various flavors.
However, since OpenShift in general and in particular its setup work a bit differently, we have decided to create a separate article for describing the setting up of an OpenShift monitoring and respectively the Kubernetes clusters running in it.
In the rest of this article, we will refer to these same clusters — for readability and simplicity — as OpenShift clusters.
Monitoring OpenShift clusters is only possible with one of the Checkmk commercial editions.
2. Introduction
Checkmk helps you to monitor your OpenShift clusters. Starting with version 2.3.0, you can use any of our commercial editions to monitor the following objects:
Clusters
Deployments
Nodes
Pods
DaemonSets
StatefulSets
CronJobs
For a complete listing of all of the available check plug-ins for the monitoring of Kubernetes, see our Catalog of check plug-ins.
2.1. Setting up the monitoring environment
Since OpenShift clusters can also undergo major changes very quickly in terms of the number and location of individual components, we recommend creating a separate Checkmk site for monitoring an OpenShift environment. This can then be connected to the central site as usual via the distributed monitoring procedure.
2.2. The process of monitoring OpenShift in Checkmk
Checkmk monitors your OpenShift clusters in two ways:
Checkmk fetches basic information directly from your cluster via the Kubernetes API. This can already be used to retrieve the states of nodes and containers. Most metadata from your pods and deployments is also obtained in this way. For a comprehensive monitoring, however, something is still missing up to this point. The questions of how much load, for example, a particular deployment is generating on the CPU, or how much memory a DaemonSet is currently tying up, cannot be answered with this method.
Since Prometheus is already installed by default in OpenShift clusters, Checkmk can query exactly this Prometheus instance within your OpenShift environment and prepare the resulting data for you in the usual Checkmk manner. For a fully comprehensive monitoring of your OpenShift environment, we strongly recommend setting up this connection. Additionally, using the Kubernetes dashboards is only useful if the appropriate workload data is available.
3. Creating prerequisites in the cluster
To be able to monitor the OpenShift environment in Checkmk, first create the prerequisites in your cluster.
3.1. Create a namespace and service account
First, you need to set up a namespace and service account for Checkmk in your OpenShift cluster.
The quickest way to do this is via the OpenShift CLI (oc for short).
In the following example, we will name this namespace checkmk-monitoring.
If you want or need to choose a different name, you will also need to make this change when creating the service account.
The service account with its associated role and the so-called RoleBinding can be created by specifying our ready-made YAML file published on GitHub. Check its contents and then run the following command:
Alternatively, you can first download this YAML file, customize it according to your needs, and then apply oc apply -f to this local copy of the file.
3.2. Obtain API endpoints, token and certificate
With the oc command line tool you can now also read out all of the information from your cluster, which you will usually have to specify to set up the special agent.
If you have changed the service account name or namespace, you must edit this information as described for the following commands.
Retrieve the Kubernetes API endpoint
The Kubernetes API endpoint is displayed by oc with the following command:
This address, including the specified port, will later be included in the API server connection > Endpoint field in the Kubernetes rule.
Retrieve the Prometheus API endpoint
Obtaining the address from the Prometheus instance’s API endpoint in your cluster may be easier via OpenShift’s GUI. In the administrator role, you can find a more or less long list via Networking > Routes. Here you should also find a route that probably has the word Prometheus in its name. This also simply depends on the configuration of your OpenShift cluster. Under Location you will then find the very URL which you will later require for the Prometheus API endpoint field.
You may also be able to get the FQDN on the command line with the following command.
You will then only need to later prefix the protocol to the prometheus-k8s-openshift-monitoring.apps.myopenshift.example.com string in the Prometheus API endpoint field within the Kubernetes rule.
Retrieve the token
The following command can be used to read out the token, which is usually the one you will later need to specify for the special agent in Checkmk:
Leave the shell open with this information or copy the token to a location that you can access during the following setup in Checkmk.
Retrieve the certificate
The following command can be used to retrieve the certificate which you will later need to specify under Global settings in Checkmk.
Leave the shell open with this information, or copy the certificate — including the BEGIN CERTIFICATE and END CERTIFICATE lines — to a location that you can access during the following setup in Checkmk.
If the output here is empty, the same tip applies as in the preceding Retrieve the token section.
4. Setting up the monitoring in Checkmk
Next, in the Checkmk GUI, we move on to setting up the special agent and a rule for automatically creating hosts for your Kubernetes objects. However, to set up the special agent, first there are a few prerequisites that will need to be met:
4.1. Storing the password (token) in Checkmk
It is best to store the service account’s password (token) in the Checkmk password store. This is the safest option, since you can separate the storage and use of the password in an organized way. Alternatively, enter the password directly in plain text when creating the rule (see below).
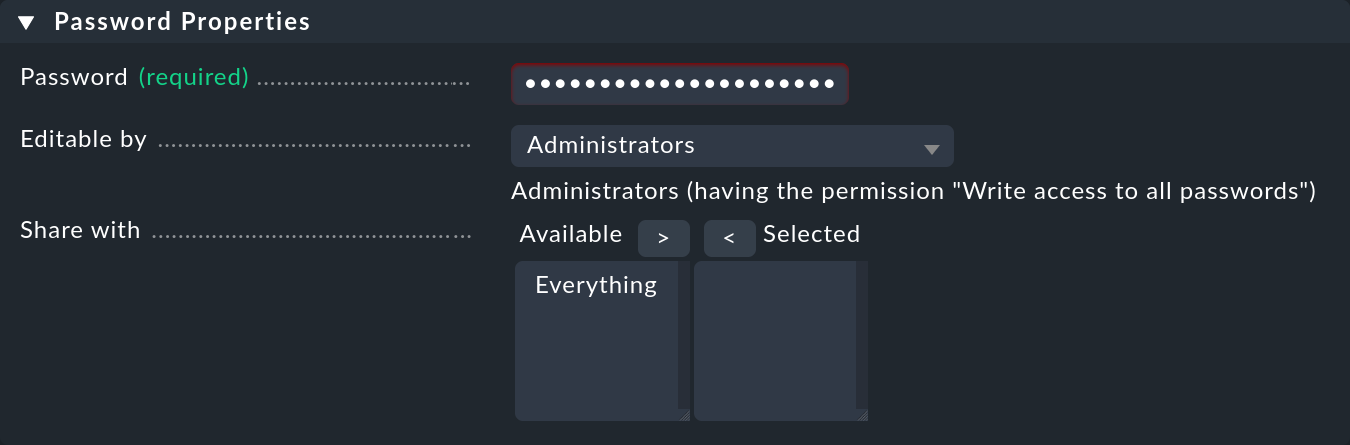
To add the password to the Checkmk password store, navigate to Setup > General > Passwords > Add password.
We use My OpenShift Token as the ID and title in our example:
4.2. Importing a service account’s CA certificate into Checkmk
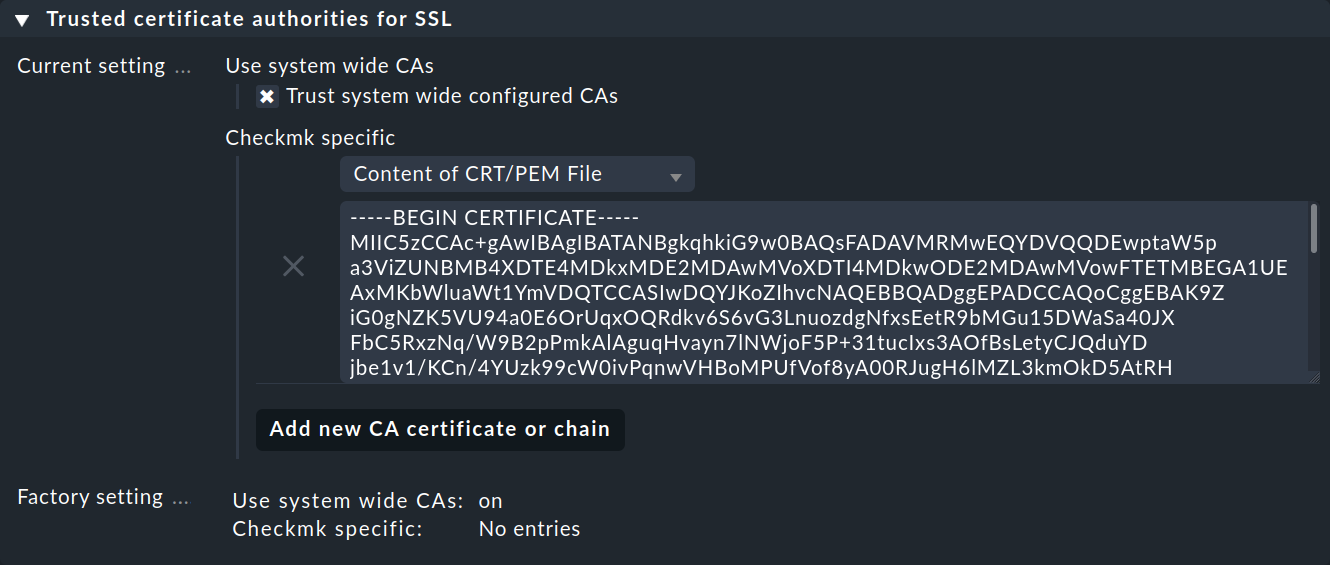
In order for Checkmk to trust the service account’s certificate chain, you will need to store it in Checkmk.
Copy everything here — including the lines containing BEGIN CERTIFICATE and END CERTIFICATE — and add the certificate in the Setup menu under Setup > General > Global settings > Site management > Trusted certificate authorities for SSL:
4.3. Creating the piggyback host
Create a new host in Checkmk in the usual way and name it myopenshiftclusterhost for example.
As the title and host name suggest, this host is used to collect the piggyback data and also to map all services and metrics at the cluster level.
Since this host receives data exclusively through the special agent, in the host’s properties be sure to set the IP address family option to No IP.
Confirm this whole configuration by pressing the Save & view folder button.

4.4. Setting up dynamic host management
To ensure separation between objects in different Kubernetes clusters, it is usually convenient to create a folder per cluster via Setup > Hosts > Add folder, in which the dynamic host management can create all of a cluster’s hosts automatically. However, creating and using such a folder is optional.
Next, set up a connection for the incoming piggyback data. To do this, navigate to Setup > Hosts > Dynamic host management > Add connection. First enter a title and then under Connection Properties click show more.
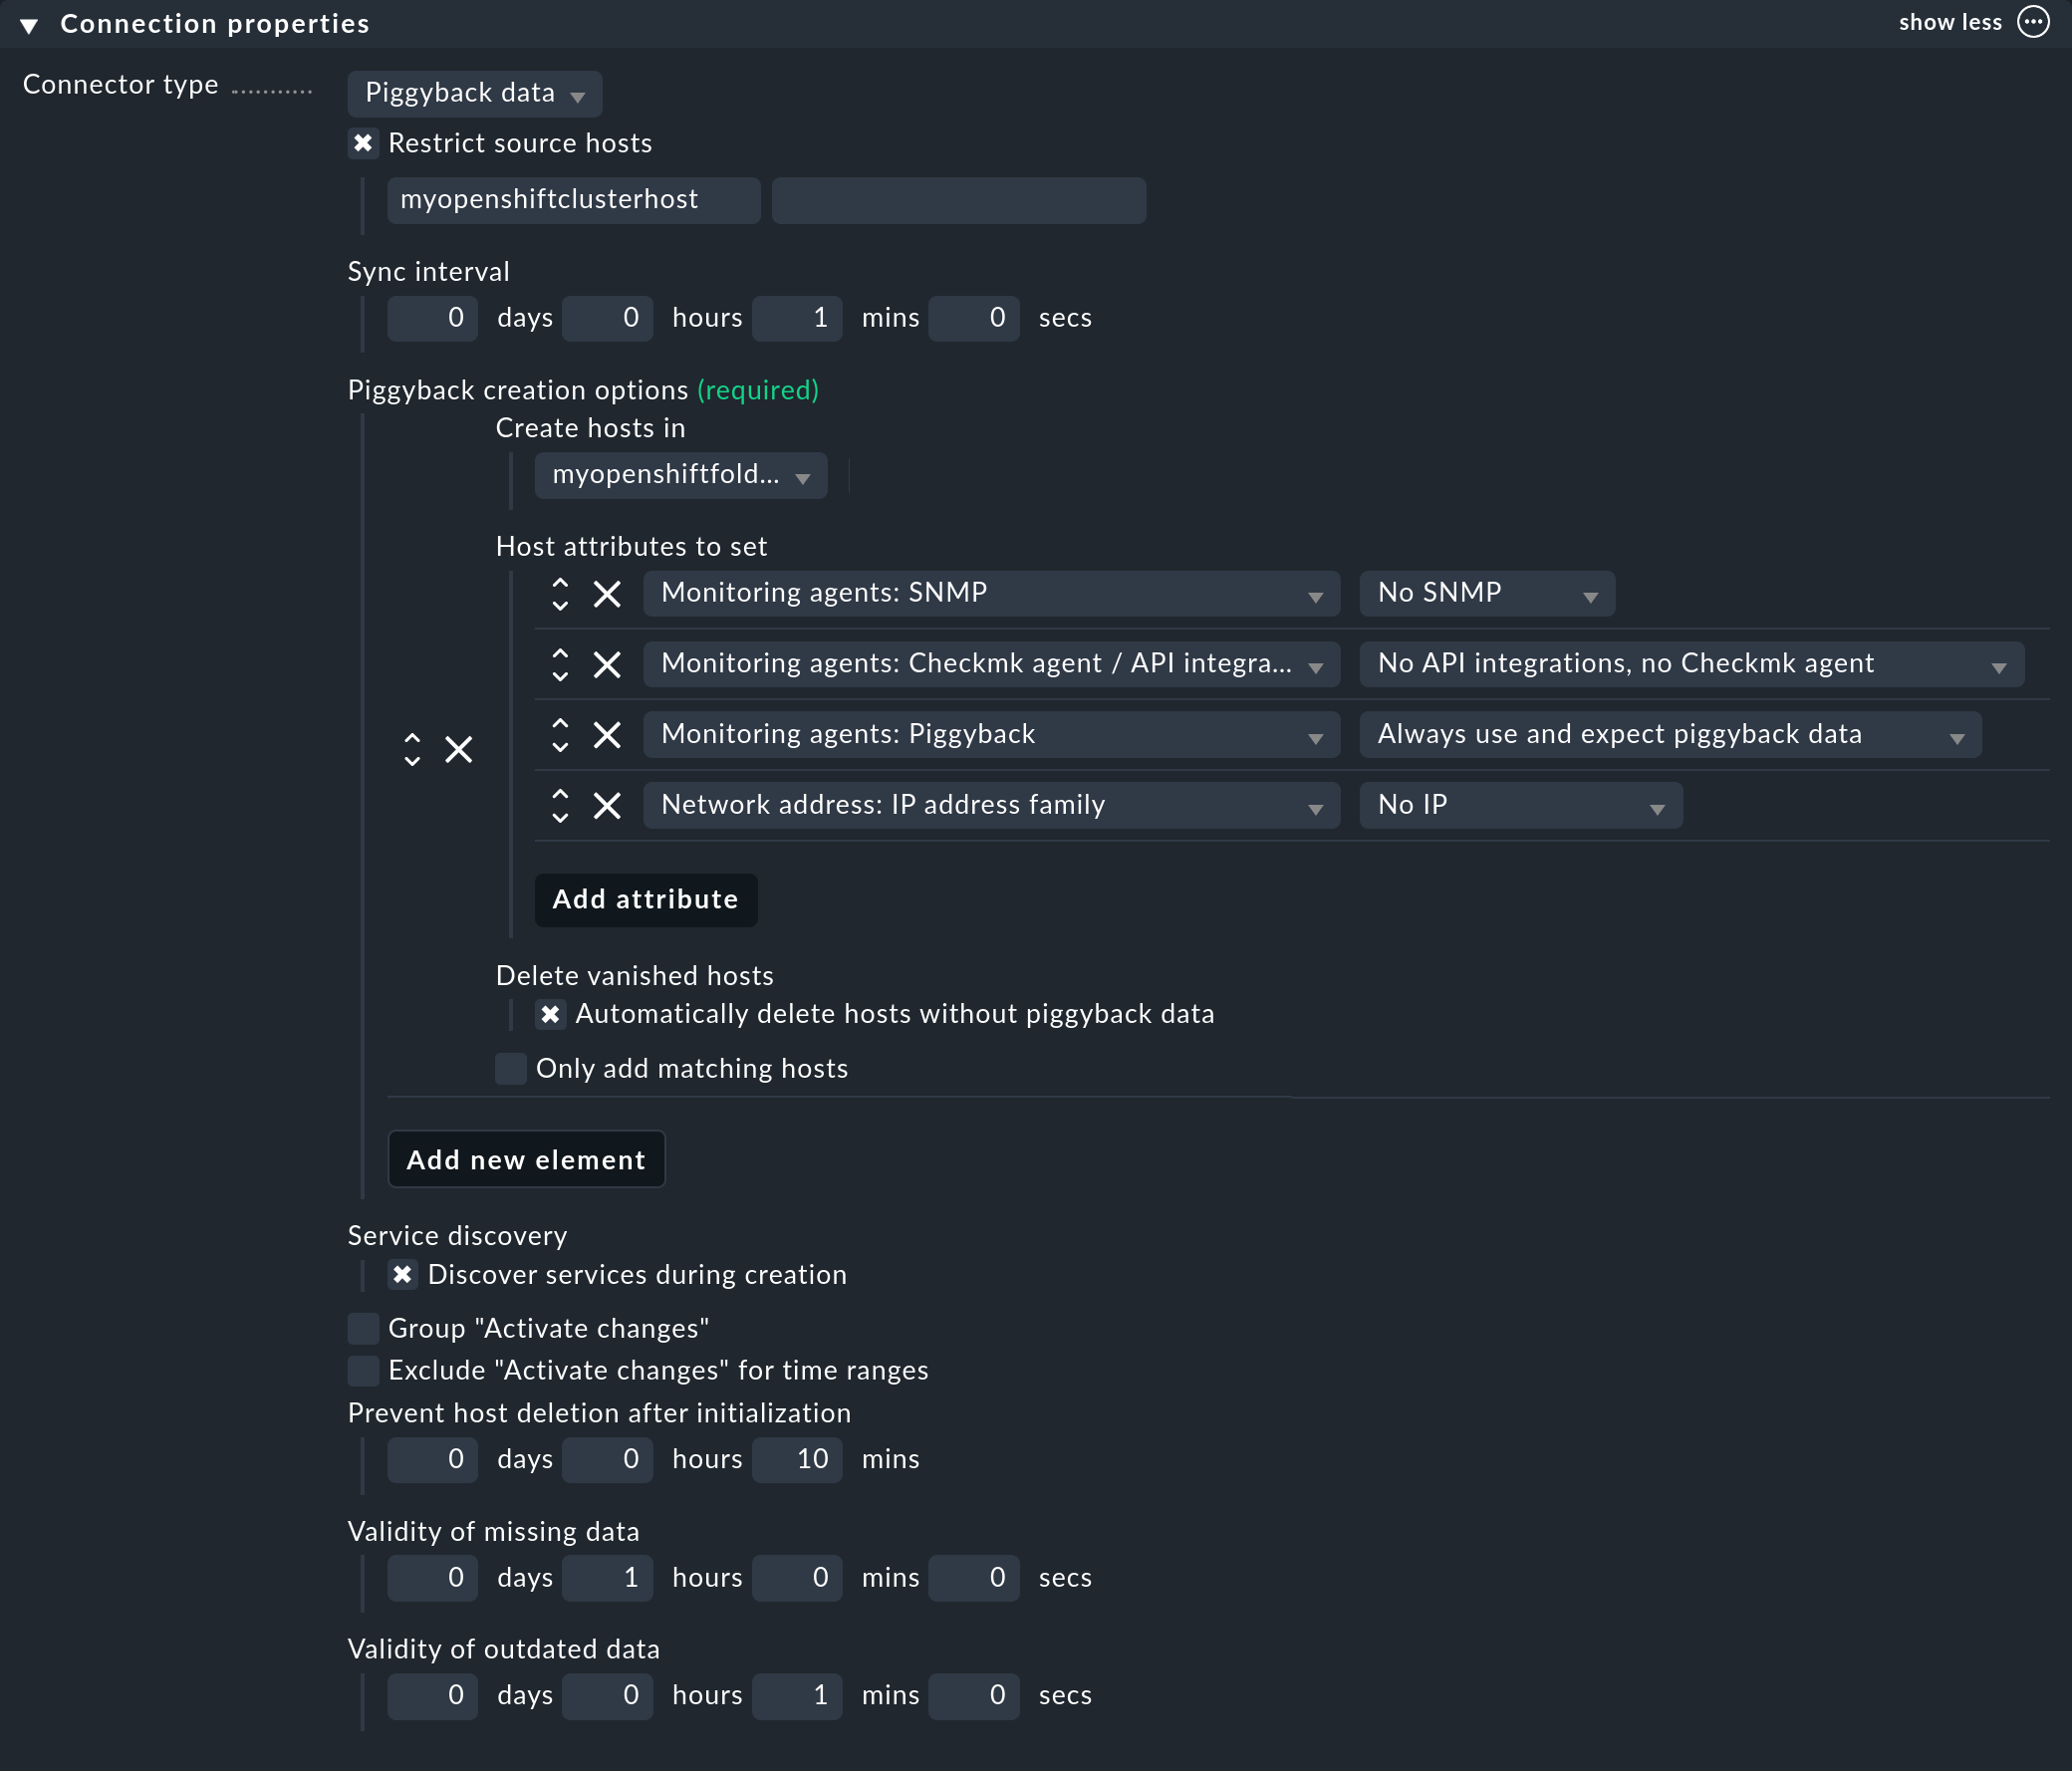
The next very important step is to enter the previously created piggyback host under Restrict source hosts.
Then, under Piggyback creation options click Add new element and under Create hosts in select the previously created folder.
You can leave the default attributes under Host attributes to set as they are. These ensure that Checkmk only accepts the piggyback data from the automatically created hosts and does not attempt to ping these or access them via SNMP, for example.
In an OpenShift environment where monitorable and monitored objects continuously come and go, it is usually recommended to also enable the Automatically delete hosts without piggyback data option. What exactly this option does and under which circumstances hosts are then actually deleted is explained in the automatic deletion of hosts chapter in the article on dynamic host management.
Finally, enable the Discover services during creation option.
The Connection Properties section of this new connection might look like the following:
4.5. Customizing the periodic service discovery
By default, Checkmk performs a service discovery every two hours and displays the result from this discovery in the Check_MK Discovery service.
You can find this setting in the Periodic service discovery rule set.
In the context of OpenShift, we recommend creating a rule with the label cmk/kubernetes:yes for all hosts.
This is because every host representing Kubernetes objects automatically receives this label from Checkmk.
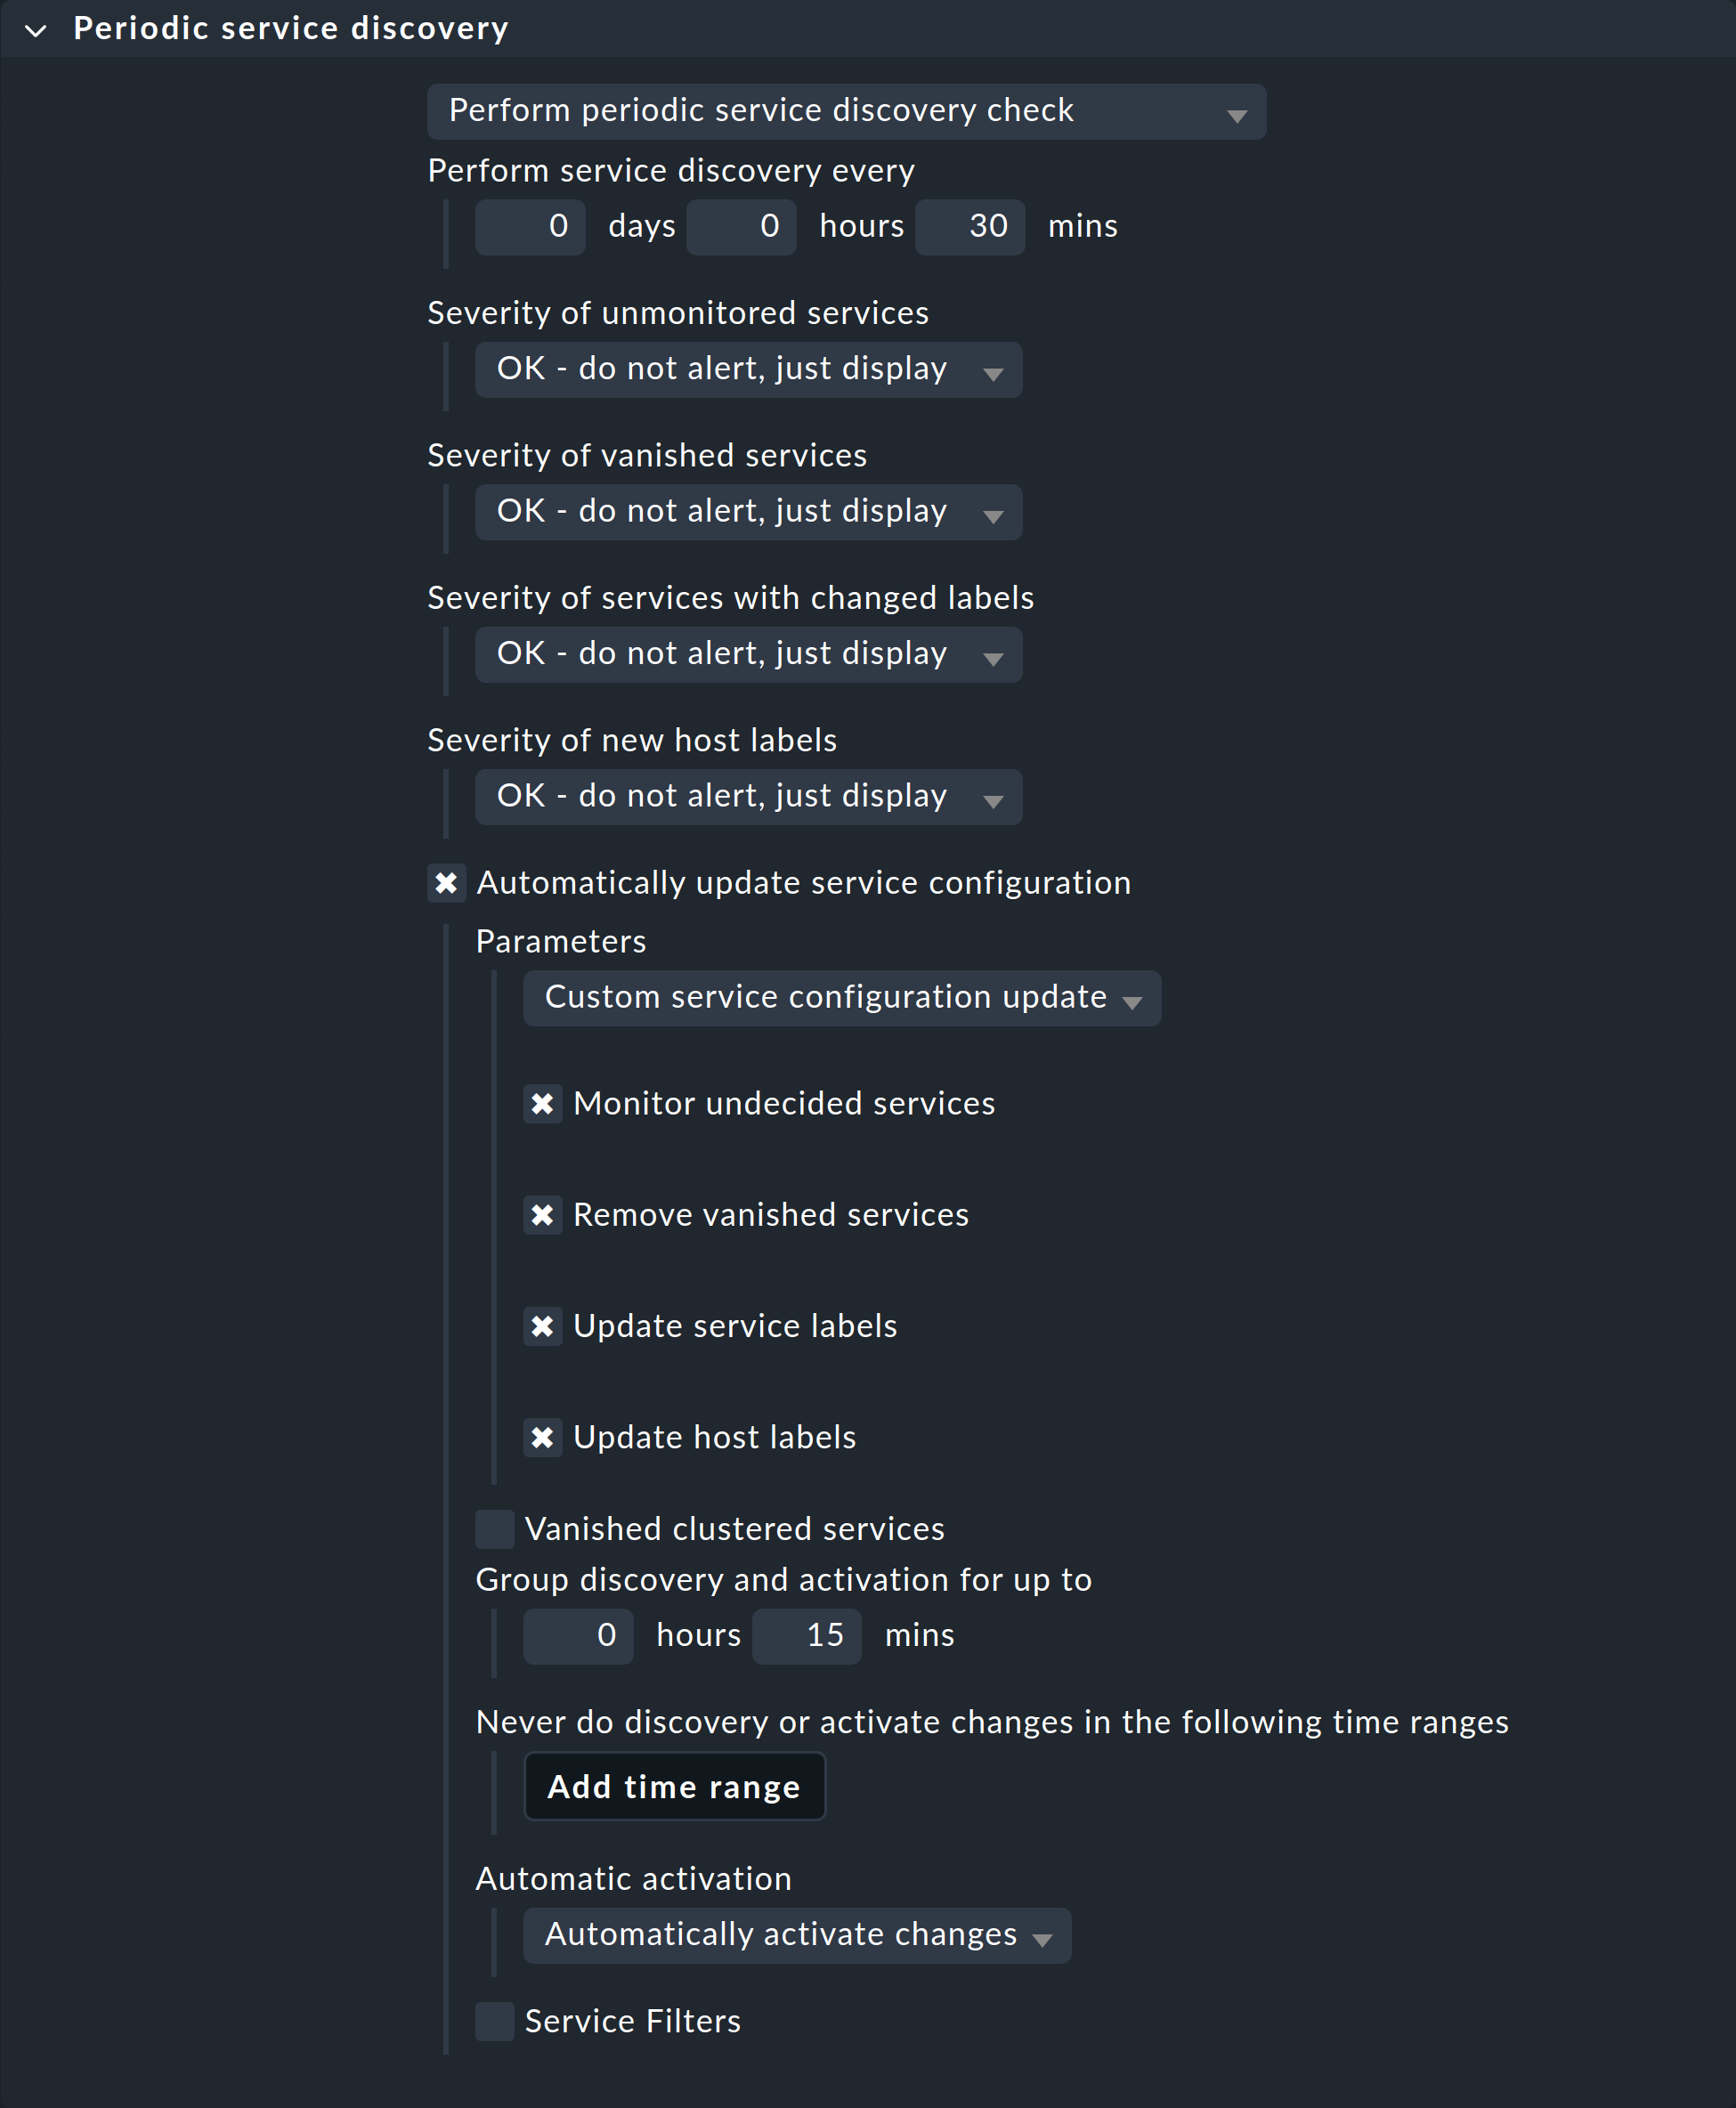
In this case you should choose a shorter interval than two hours for the service discovery, and also activate the Automatically update service configuration option.
The settings in the below screenshot are only examples.
You will need to decide what makes sense for your clusters on a case-by-case basis.
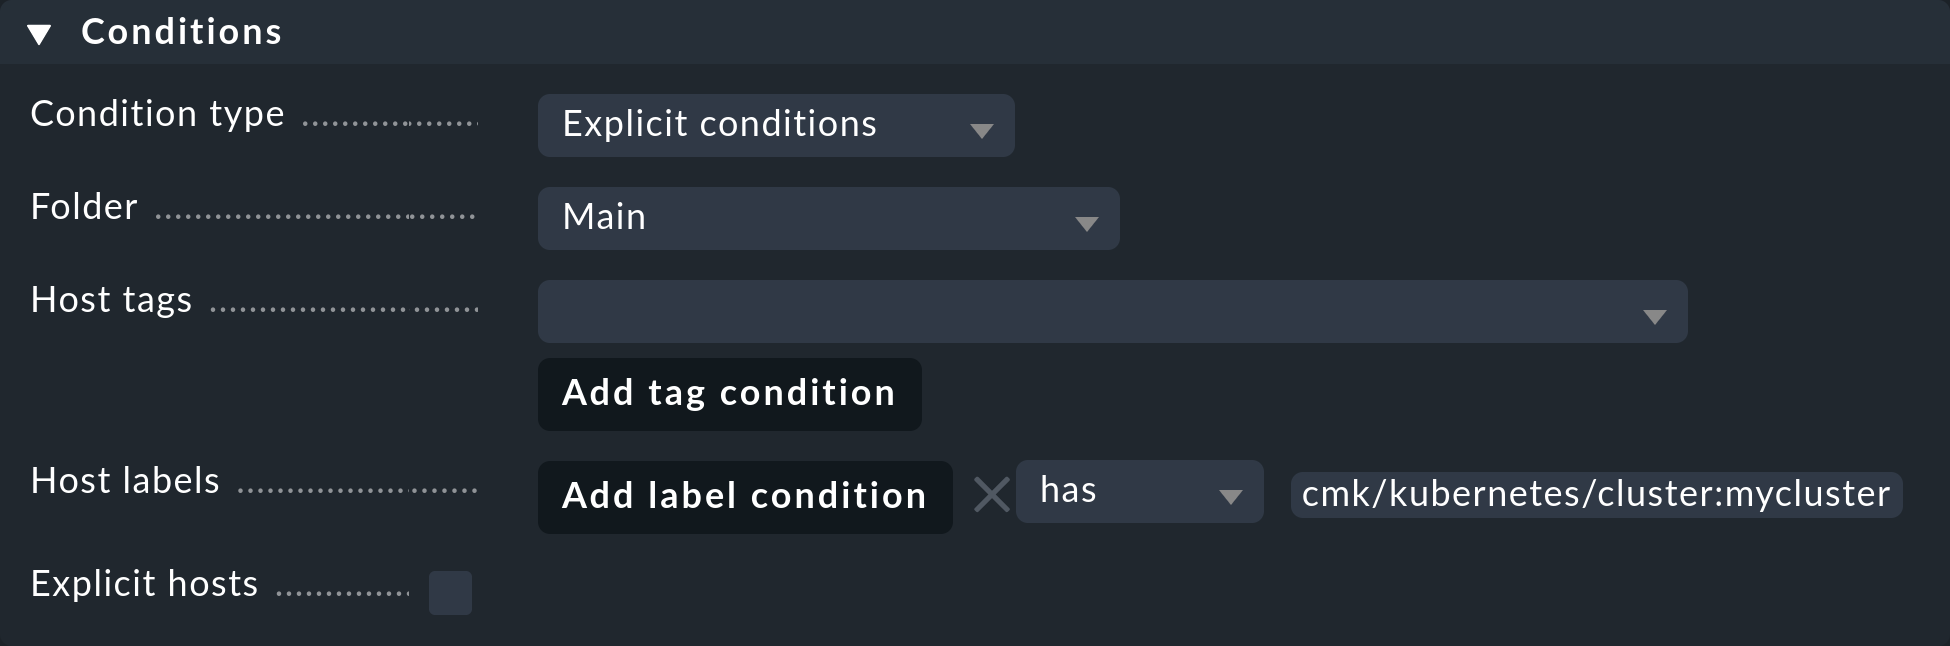
To restrict this rule to all hosts in your cluster, under Host labels simply enter cmk/kubernetes:yes in the Conditions.
However, if you also want to create different rules for different clusters, just use the respective cluster-specific label here.
These labels are always in the form cmk/kubernetes/cluster:mycluster.
4.6. Setting up the special agent
Now that all prerequisites have been created in the cluster and in Checkmk, you can turn your attention to the special agent configuration. This can be found via Setup > Agents > VM, cloud, container > Kubernetes. Create a new rule with Add rule.
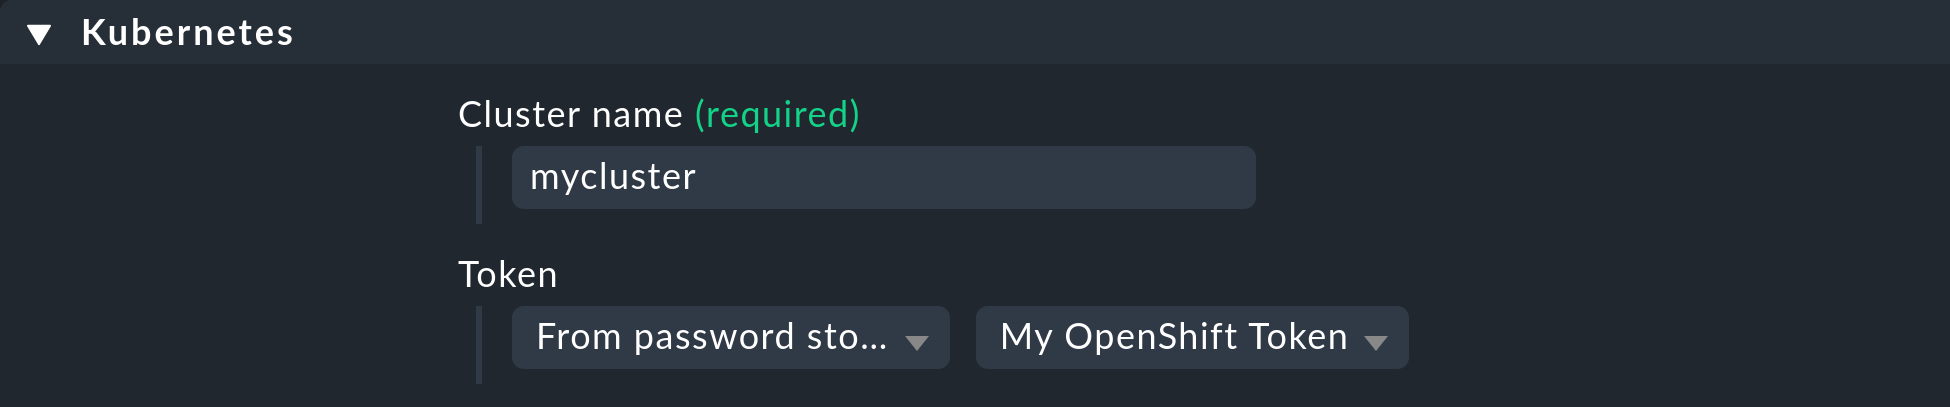
First of all, you must assign a name for the cluster to be monitored.
This name can be specified freely as desired.
It is used to assign a unique name to all objects that originate from this specific cluster.
For example, if you enter mycluster here, the names of the hosts for all of the pods in this cluster will later begin with pod_mycluster.
The next part of the host name will then always be the namespace in which this Kubernetes object exists.
For example, the host name of a pod could then be pod_mycluster_kube-system_svclb-traefik-8bgw7.
Under Token, now select the previously created entry from the Checkmk password store.
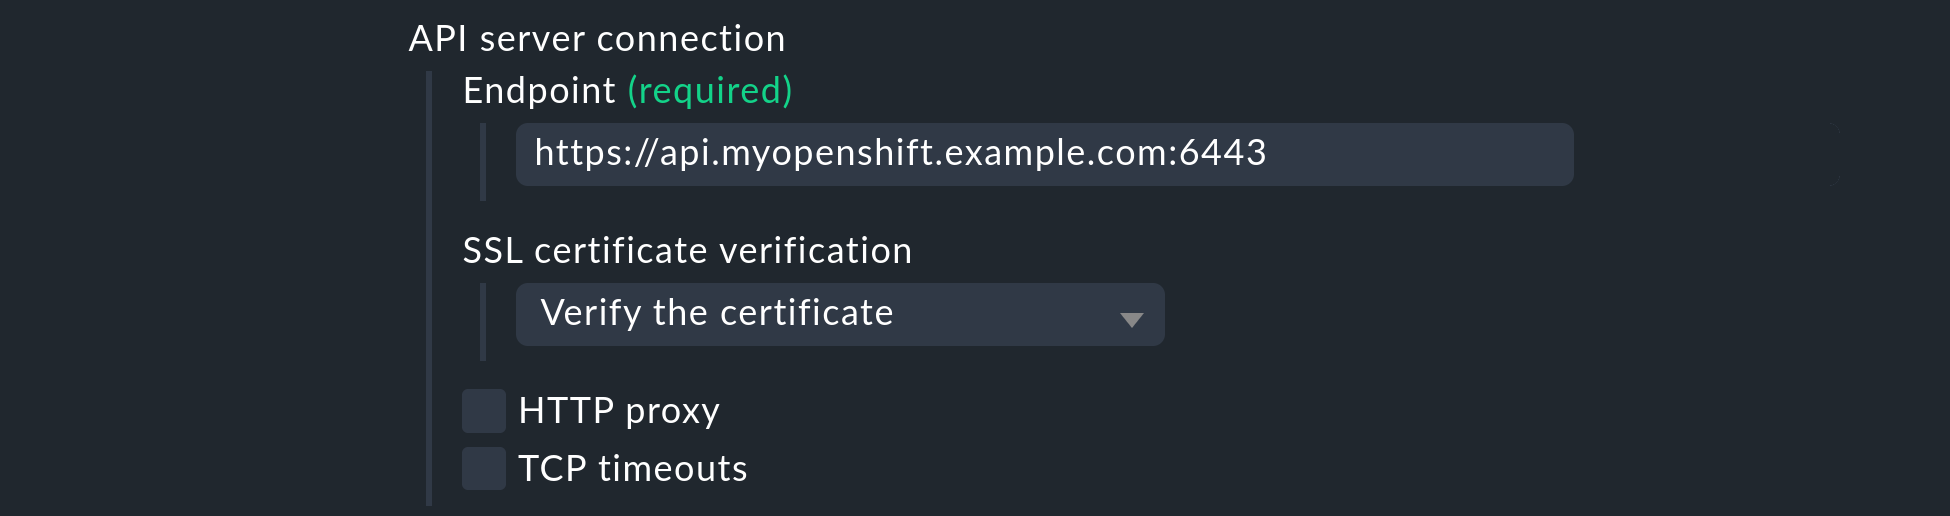
Under API server connection > Endpoint, Checkmk now requires you to enter the URL through which your Kubernetes API server can be contacted. The port is only required if the service is not provided via a virtual host. Here, enter the address that you determined in the Retrieve the Kubernetes API endpoint section.
If you have so far followed these instructions step by step and have — as described above — deposited your cluster’s CA certificate in Checkmk, then under SSL certificate verification select Verify the certificate.
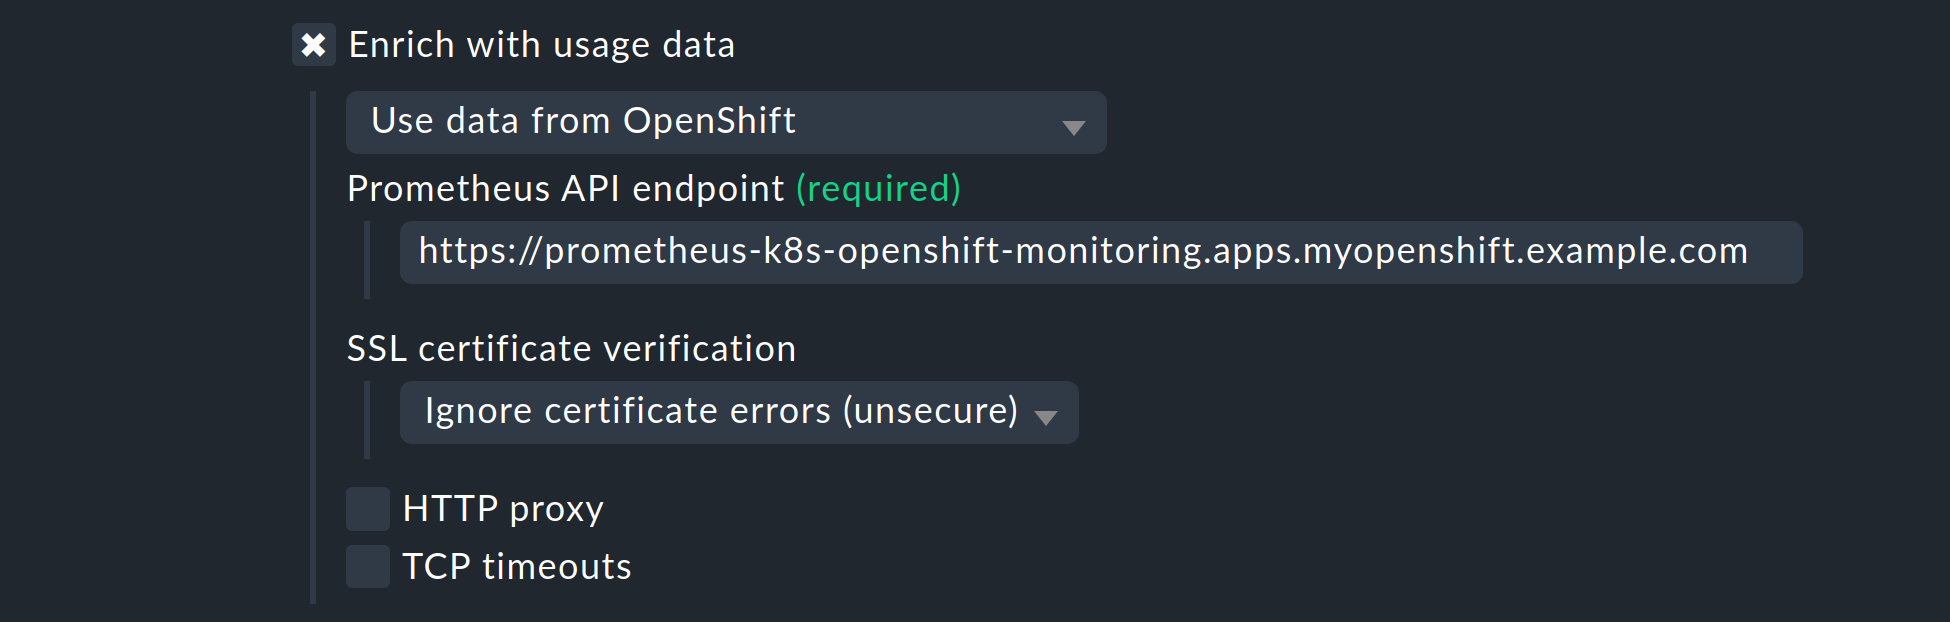
Enable the Enrich with usage data option, select Use data from OpenShift in the following menu, and enter the Prometheus API endpoint that you determined in the Retrieve the Prometheus API endpoint section.
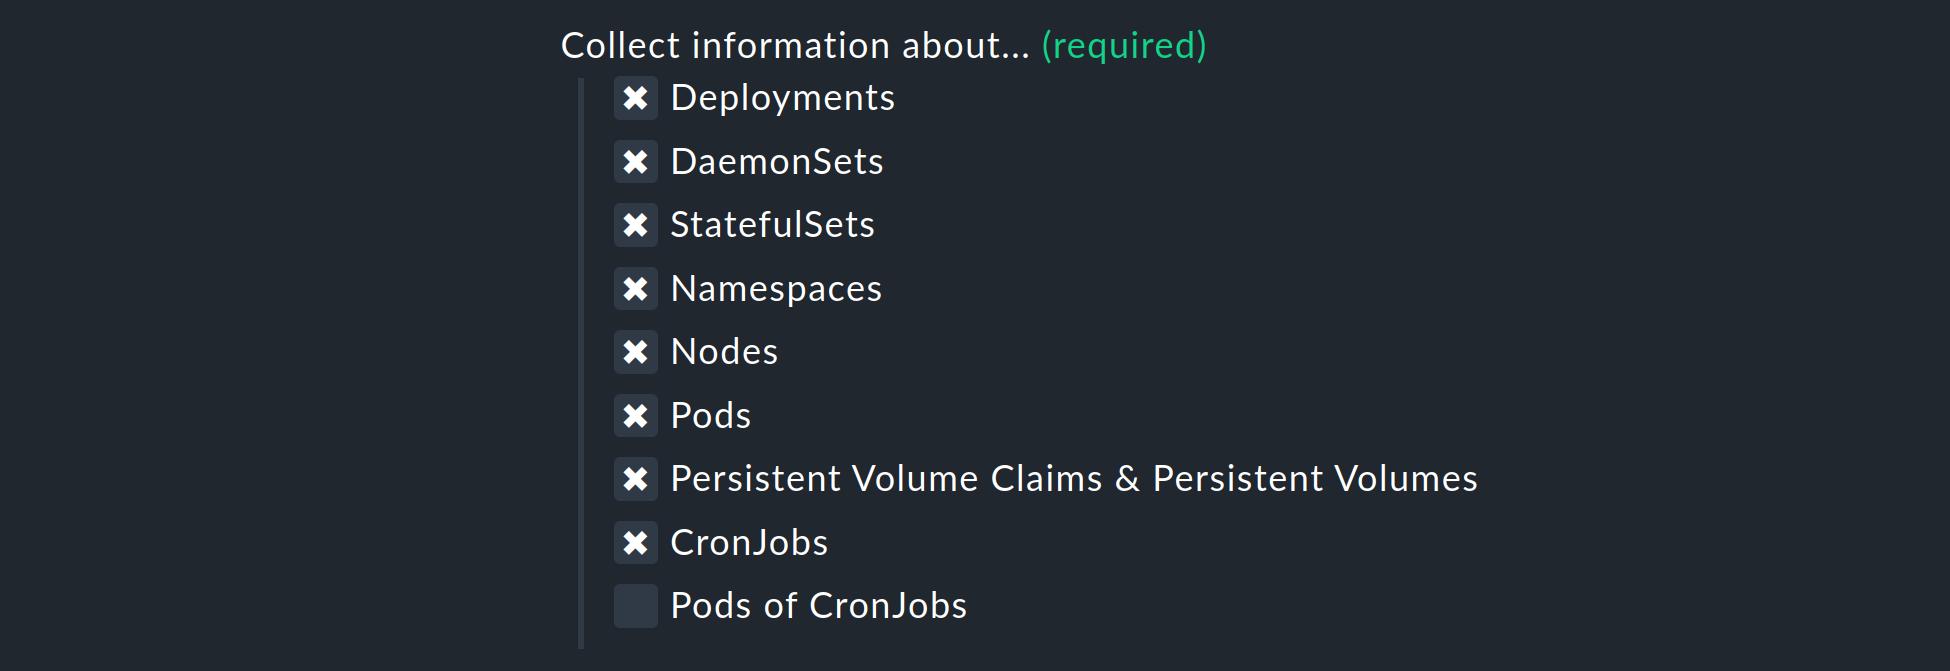
The list under Collect information about… allows you to select which objects within your cluster should be monitored. This list covers the most relevant objects. If you also decide to monitor the Pods of CronJobs, please refer to the inline help for this option.
The next two selections allow you to further narrow down the objects to be monitored. If you are only interested in the objects from certain namespaces, set this accordingly under Monitor namespaces. Here you can either enter individual namespaces to be monitored or explicitly exclude individual namespaces from monitoring.
The Cluster resource aggregation option allows you to designate nodes that do not provide resources for your cluster’s workload.
These nodes should be excluded from the calculation of available resources.
Otherwise, there is a risk that capacity bottlenecks will not be detected.
We therefore by default exclude the control-plane and infra nodes from the calculation.
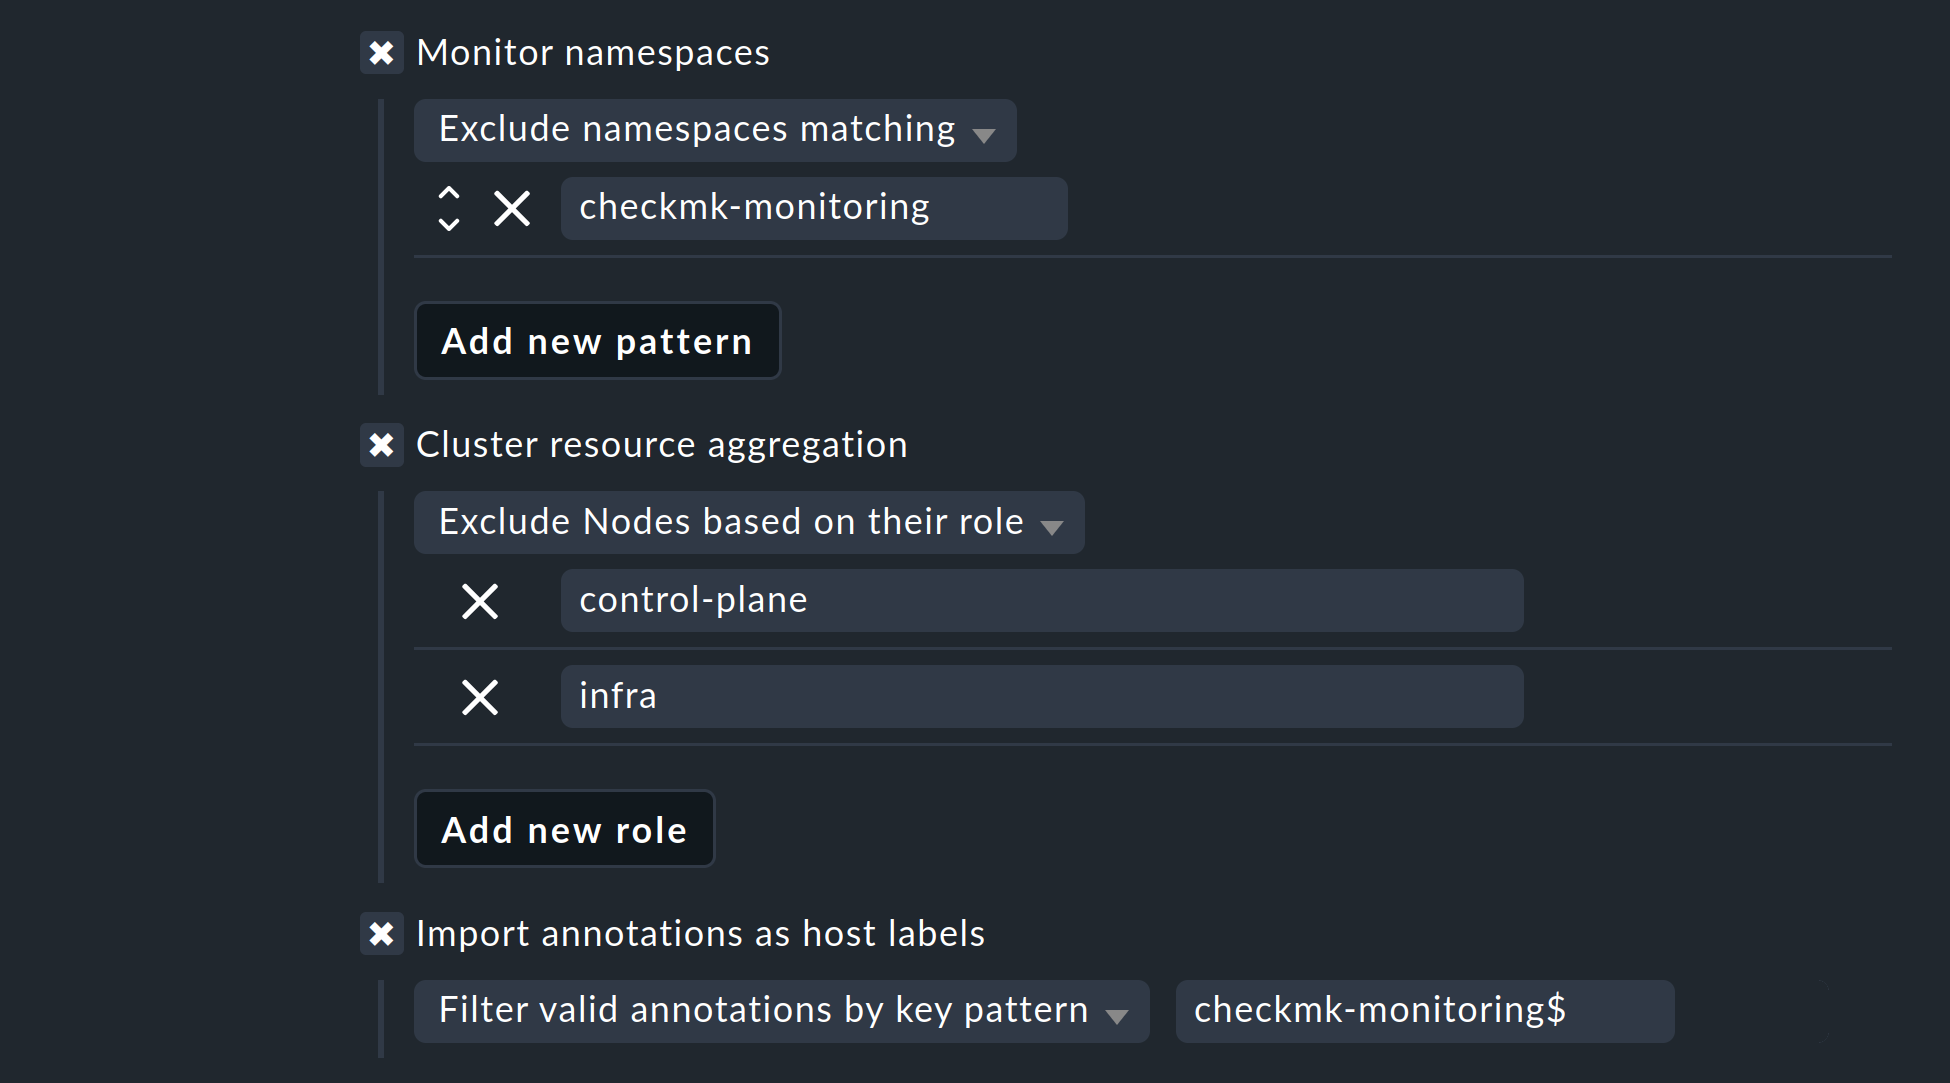
As a final option, you can import so-called annotations from Kubernetes. In Checkmk, these annotations become host labels and can thus be further used as conditions in rules. Use regular expressions to specify which annotations should be imported. Consult the detailed inline help again at this point.
Note: The Import all valid annotations option is provided here only for completeness. We do not recommend importing all annotations at once, because this can create a very large mountain of useless labels in Checkmk.
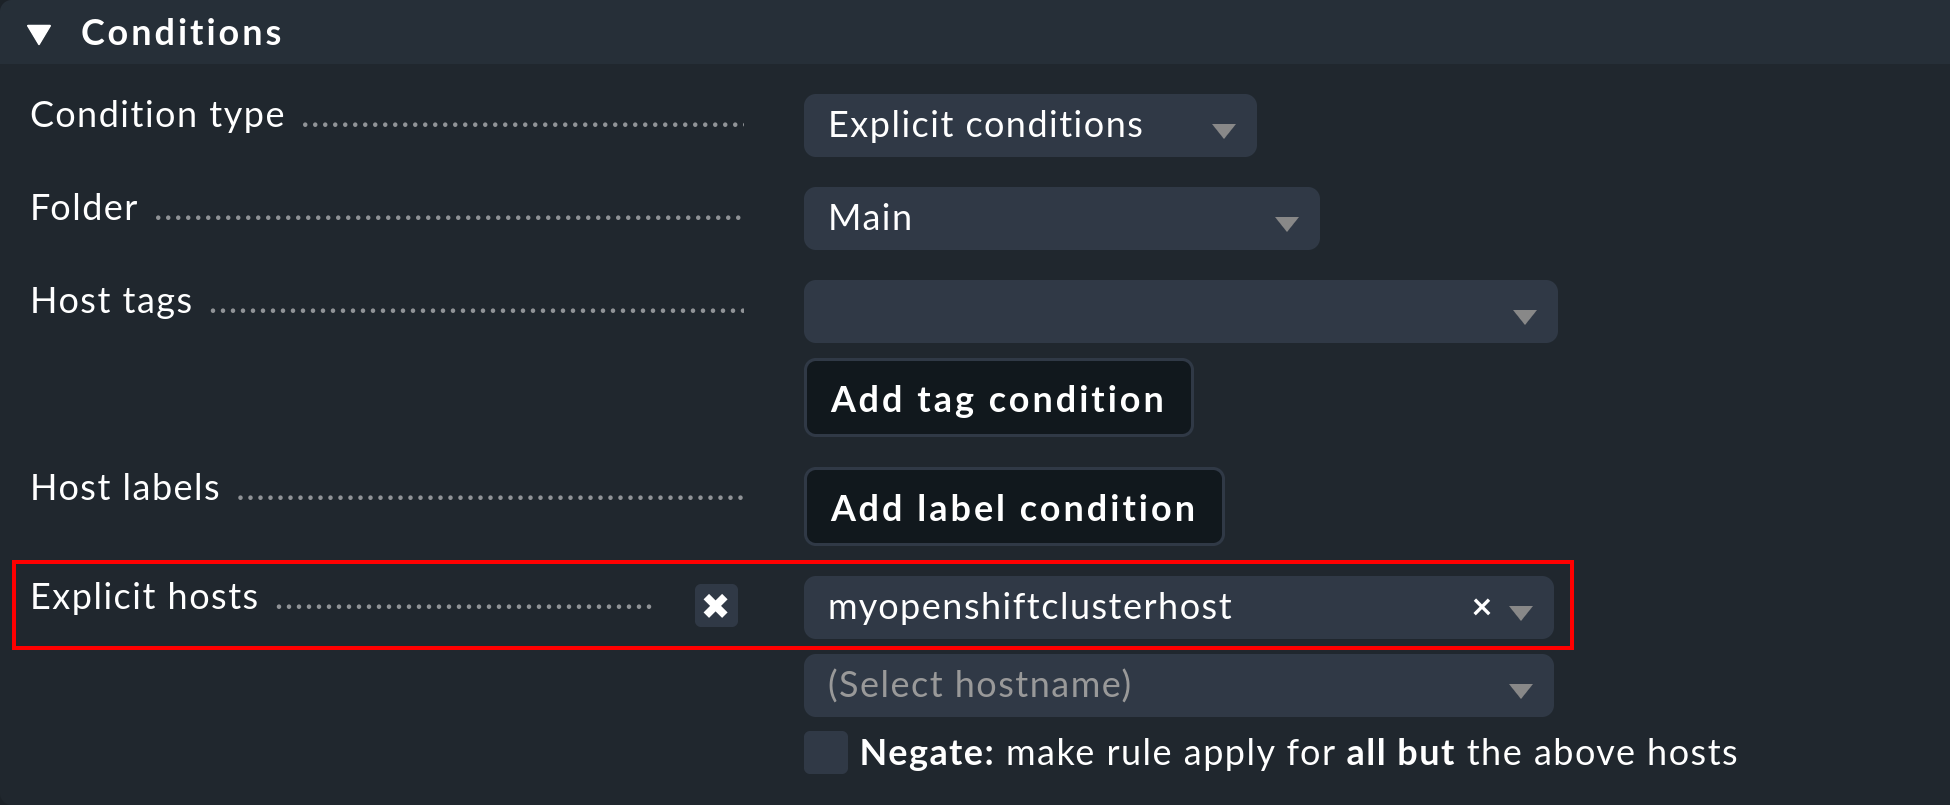
Important: Under Conditions > Explicit hosts you must now enter the previously created host:
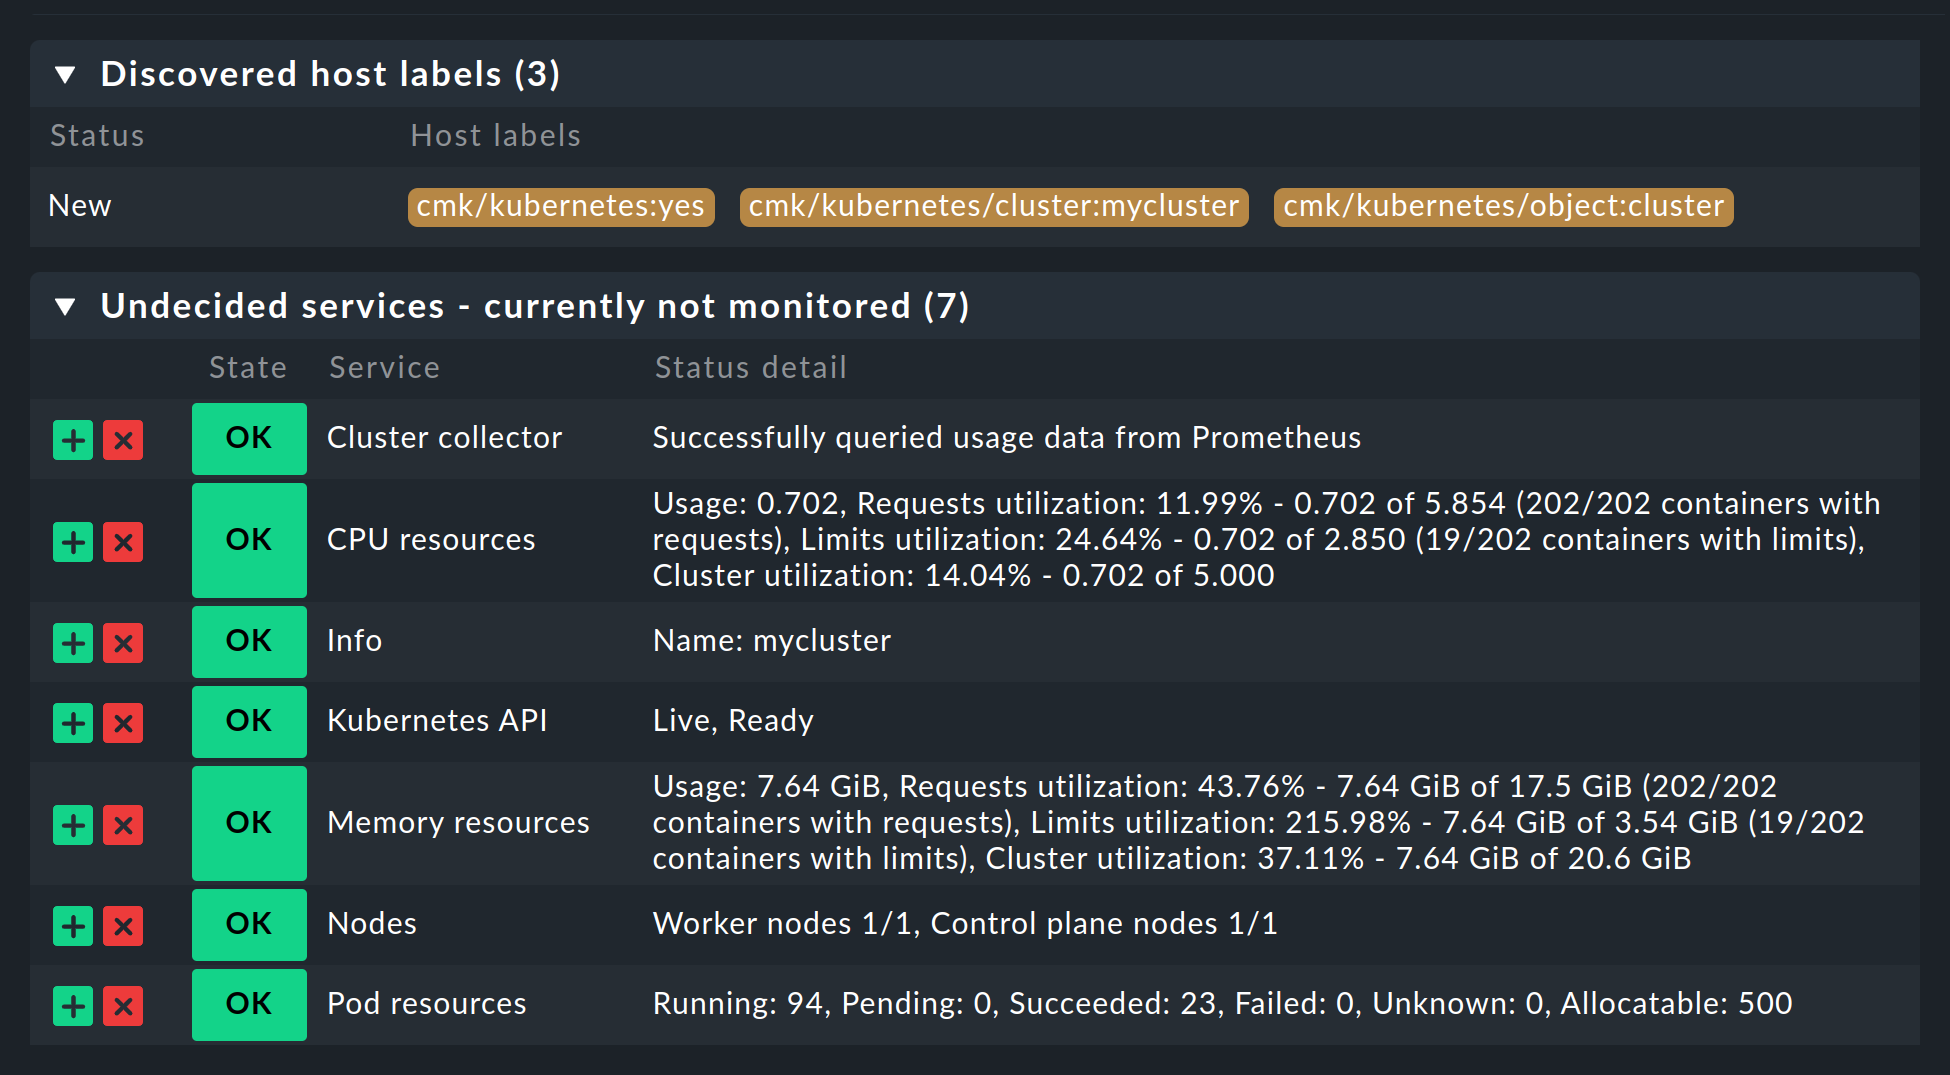
Then save the rule and perform a service discovery for this host. The first cluster-level services will appear right away here:
Now activate all of the changes you have made and let the dynamic host management do the work from now on. This will generate all of the hosts for your Kubernetes objects within a short period of time.
5. Labels for Kubernetes objects
Checkmk automatically generates labels for objects such as clusters, deployments, or namespaces during a service discovery.
All labels for these objects that Checkmk automatically generates start with cmk/kubernetes/.
For example, a pod will always get a label from the node (cmk/kubernetes/node:mynode), a label that identifies the object as a pod (cmk/kubernetes/object:pod) and a label for the namespace (cmk/kubernetes/namespace:mynamespace).
This makes it very easy to create filters and rules for all objects of the same type or in the same namespace.
6. Dashboards and views
6.1. Kubernetes dashboards
![]() The Checkmk commercial editions are supplied with six built-in dashboards for Kubernetes.
In order to make sense of these dashboards, it is necessary to have our Cluster Collector installed and configured.
Specifically, these dashboards are called:
The Checkmk commercial editions are supplied with six built-in dashboards for Kubernetes.
In order to make sense of these dashboards, it is necessary to have our Cluster Collector installed and configured.
Specifically, these dashboards are called:
Kubernetes (Overview)
Kubernetes Cluster
Kubernetes DaemonSet
Kubernetes Deployment
Kubernetes Namespace
Kubernetes StatefulSet
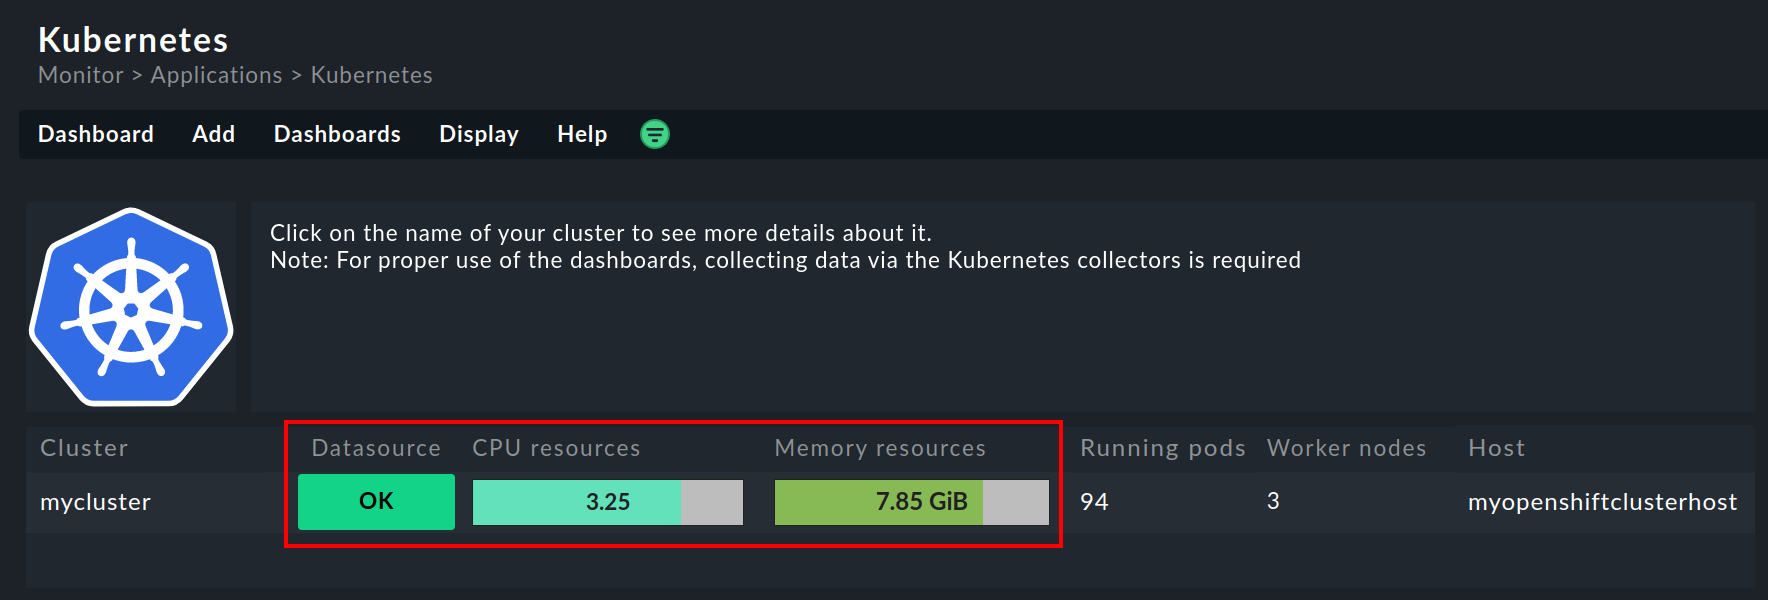
The entry point is always the Kubernetes dashboard, which you can access via Monitor > Applications > Kubernetes:
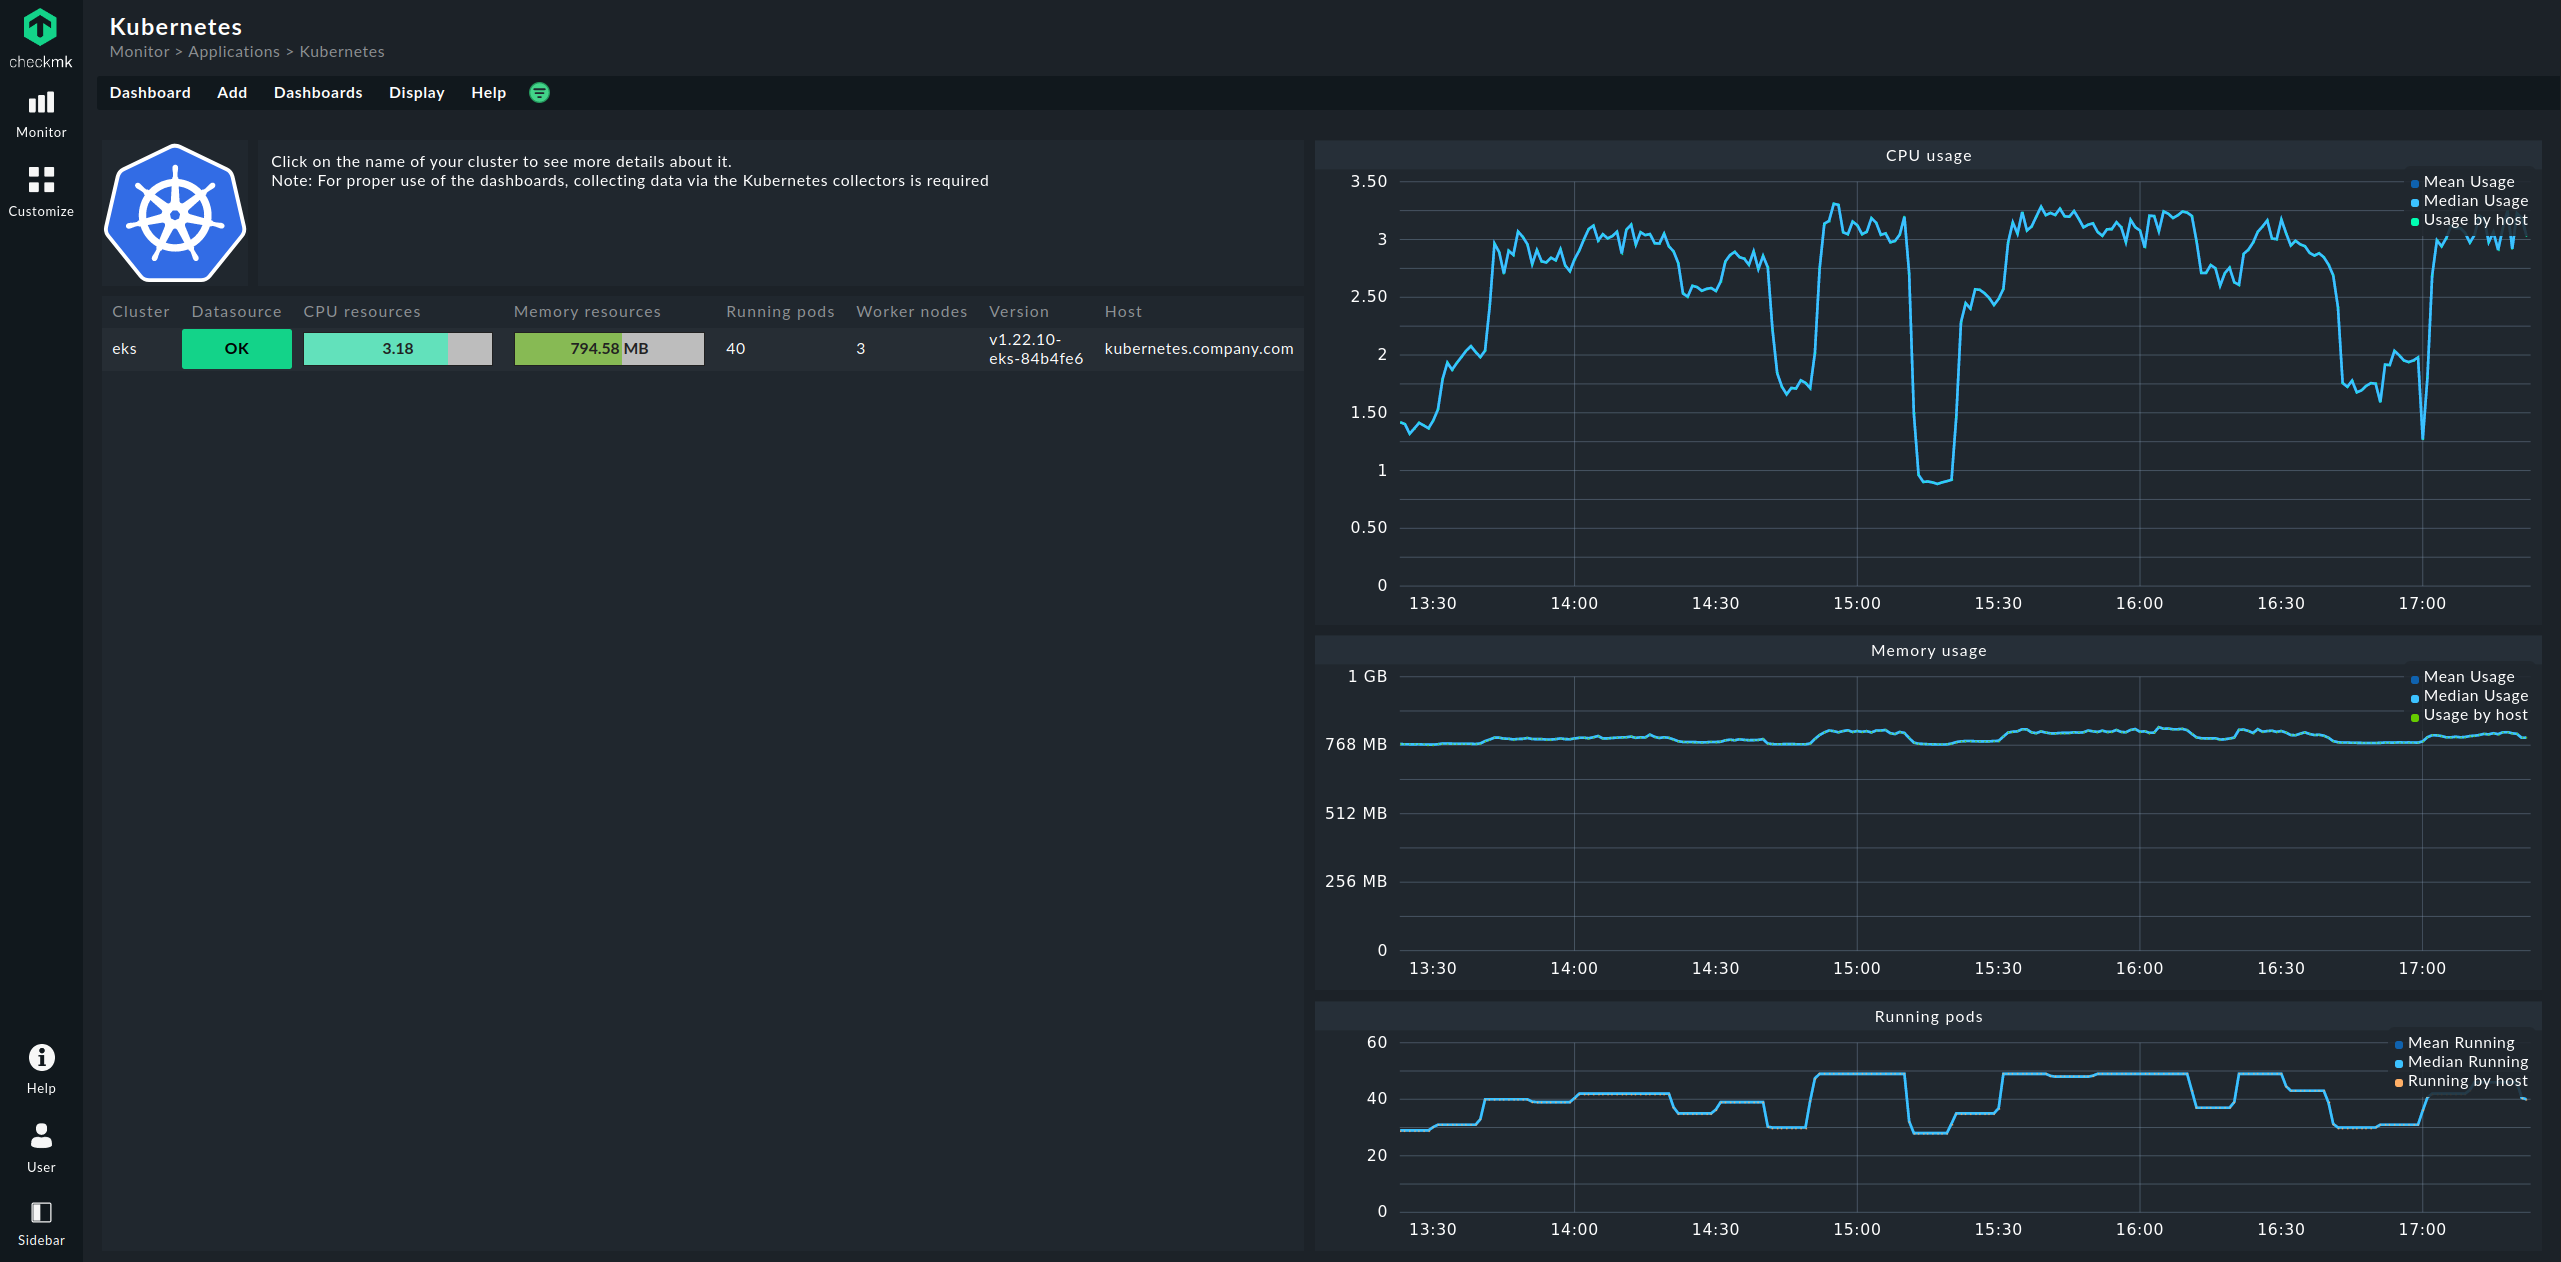
In the Kubernetes dashboard, all of your monitored clusters are listed on the left side. This listing of clusters is also your entry point for drilling deeper into the dashboards. Clicking on the name of a cluster will take you to the Kubernetes Cluster dashboard for the selected cluster. In the Kubernetes Cluster dashboard, clicking on the respective name then takes you to the other context-dependent dashboards:
6.2. The HW/SW inventory
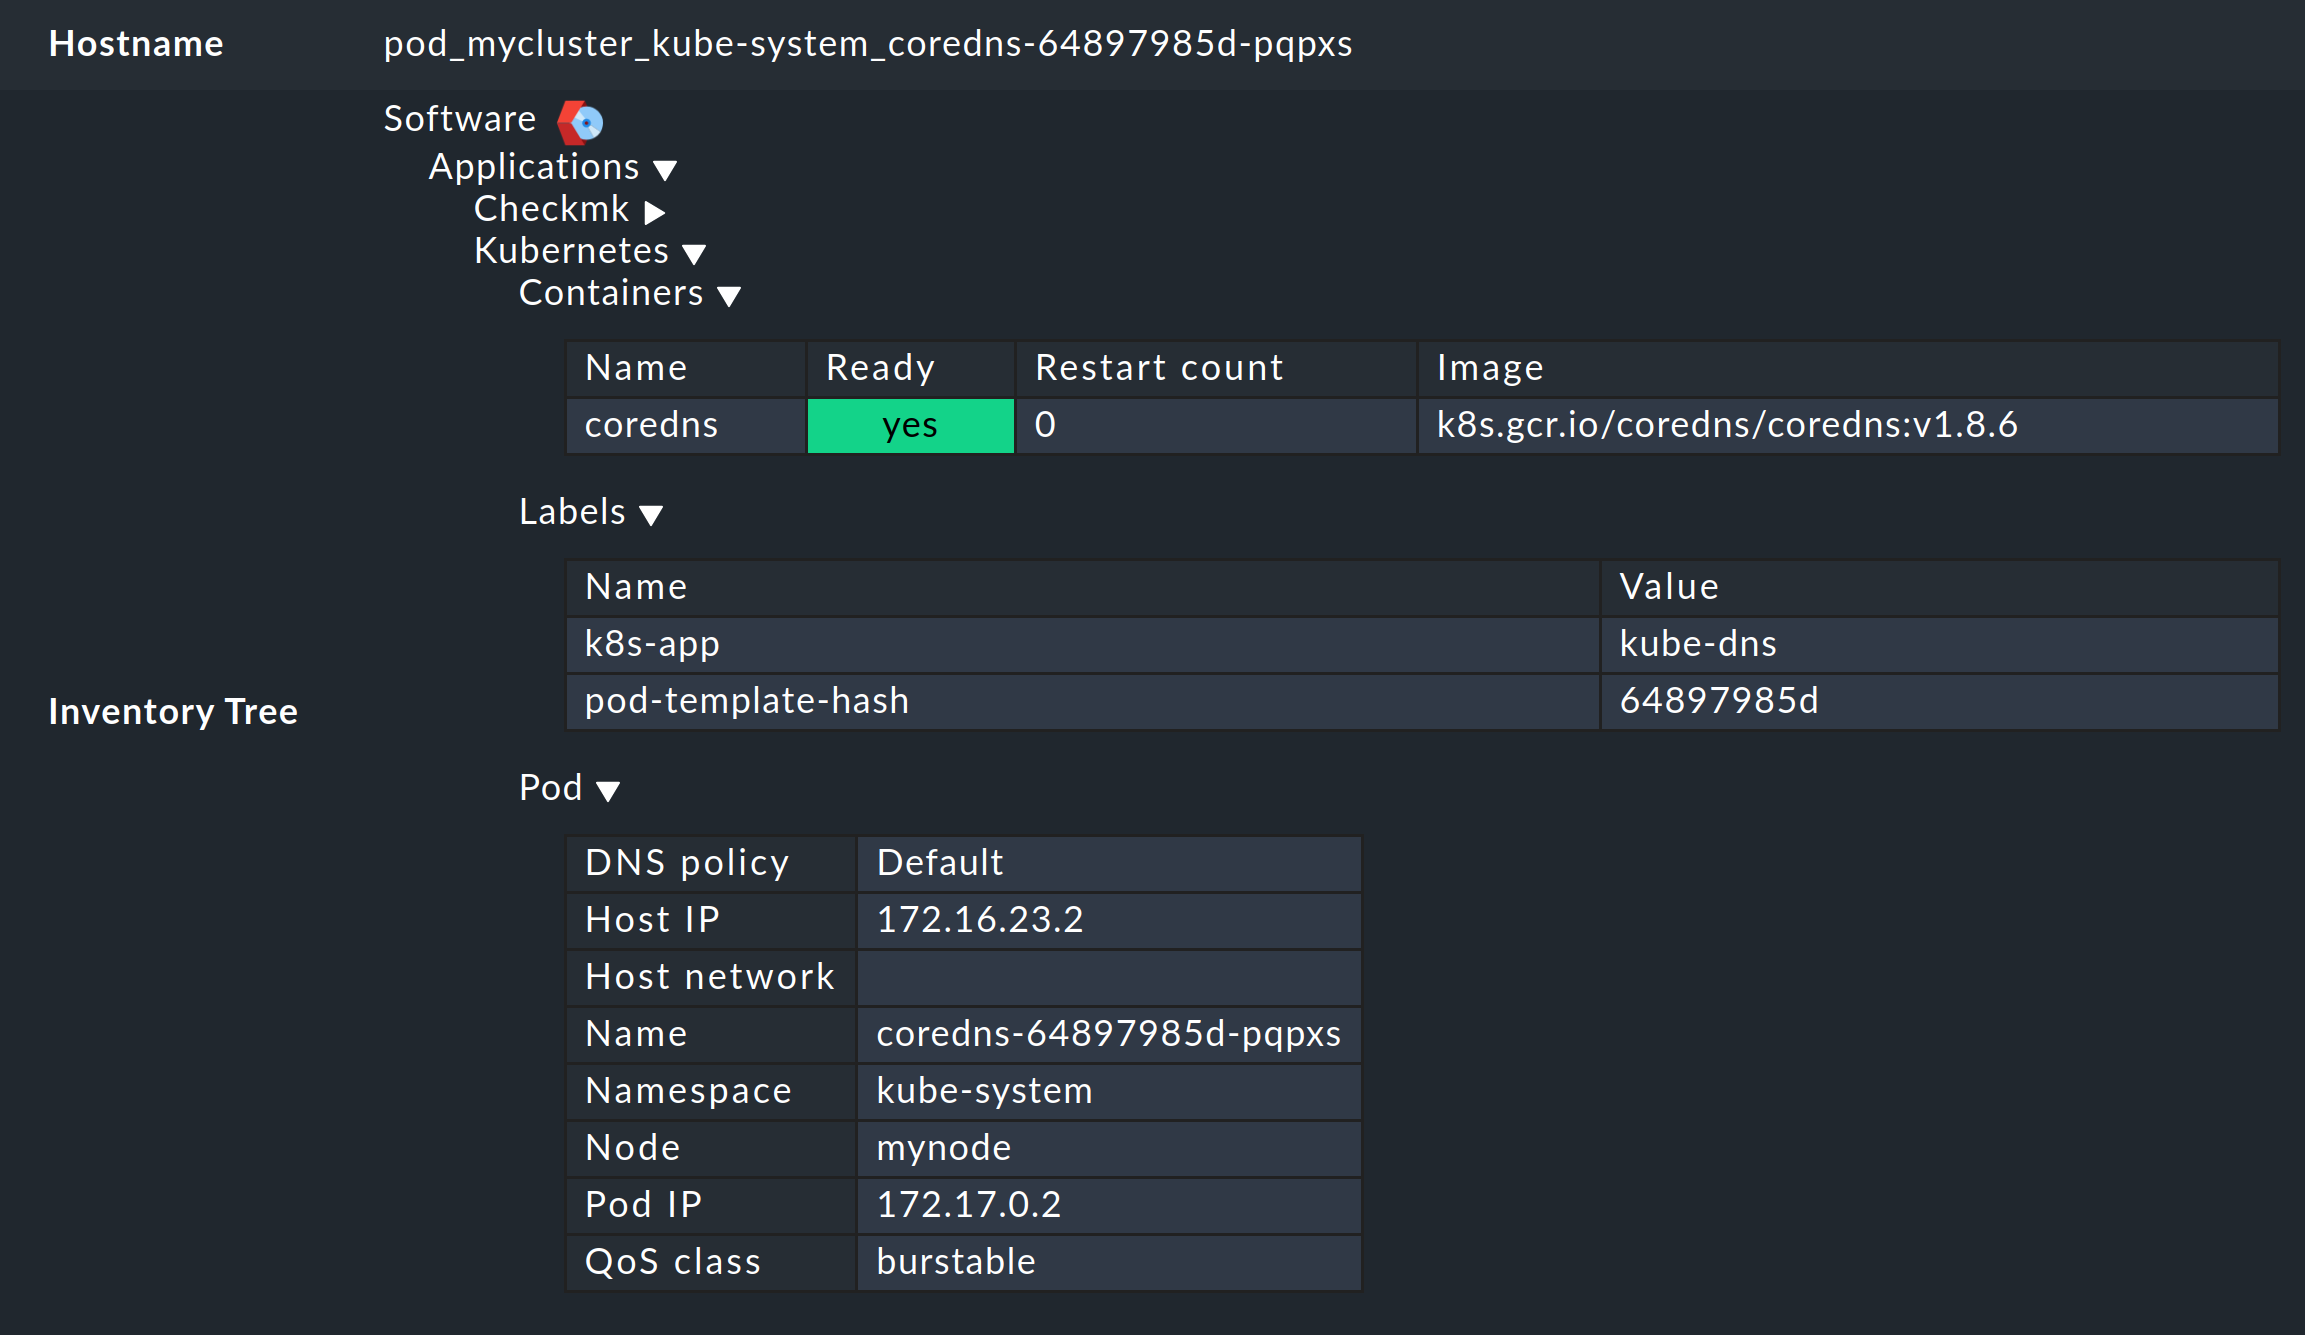
Monitoring OpenShift with Checkmk also supports HW/SW inventory. For example, in the cluster dashboard above, clicking on the cluster’s ID name (here: mycluster) will take you to the cluster’s inventory.
In the same way, i.e. in the other dashboards via the boxes with the ID names of the objects, the inventory for each respective object can be displayed. The following example shows the HW/SW inventory for a pod:
7. Checking the installation
In the Checkmk GUI you can verify that an installation and configuration have been successful.
The most important services here are definitely the Kubernetes API and Cluster collector. These must be present on the cluster host you have created and should also display specific, real information.
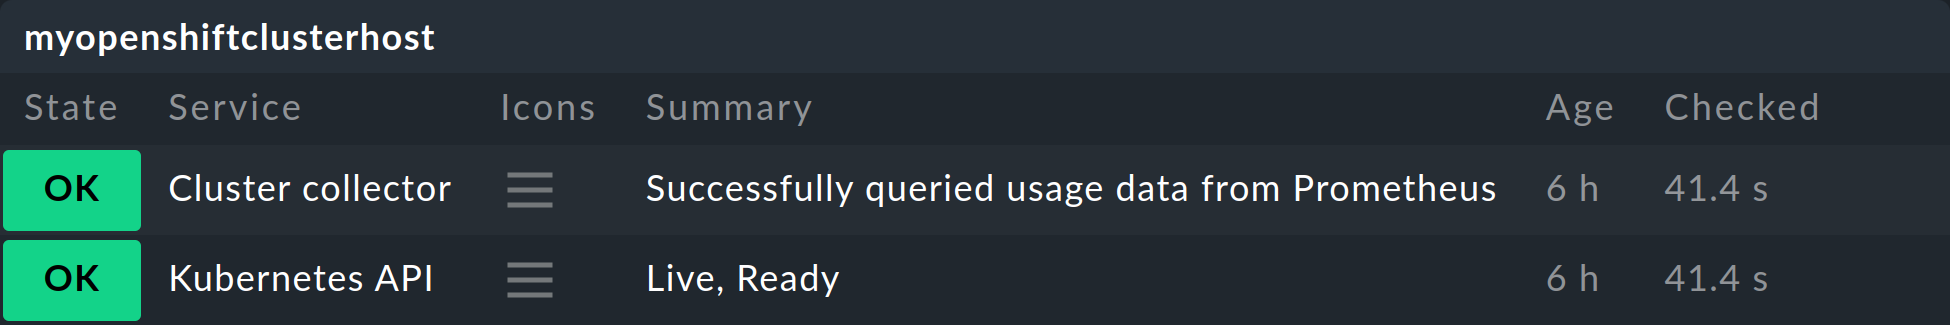
Under Summary the Kubernetes API service should normally report Live, Ready, and if the Cluster collector is set up, it will ideally show Successfully queried usage data from Prometheus.
In the Kubernetes dashboard, you can determine very early on if the Cluster collector is running and collecting data in a cluster. If set up correctly, the Kubernetes dashboard should look something like this:
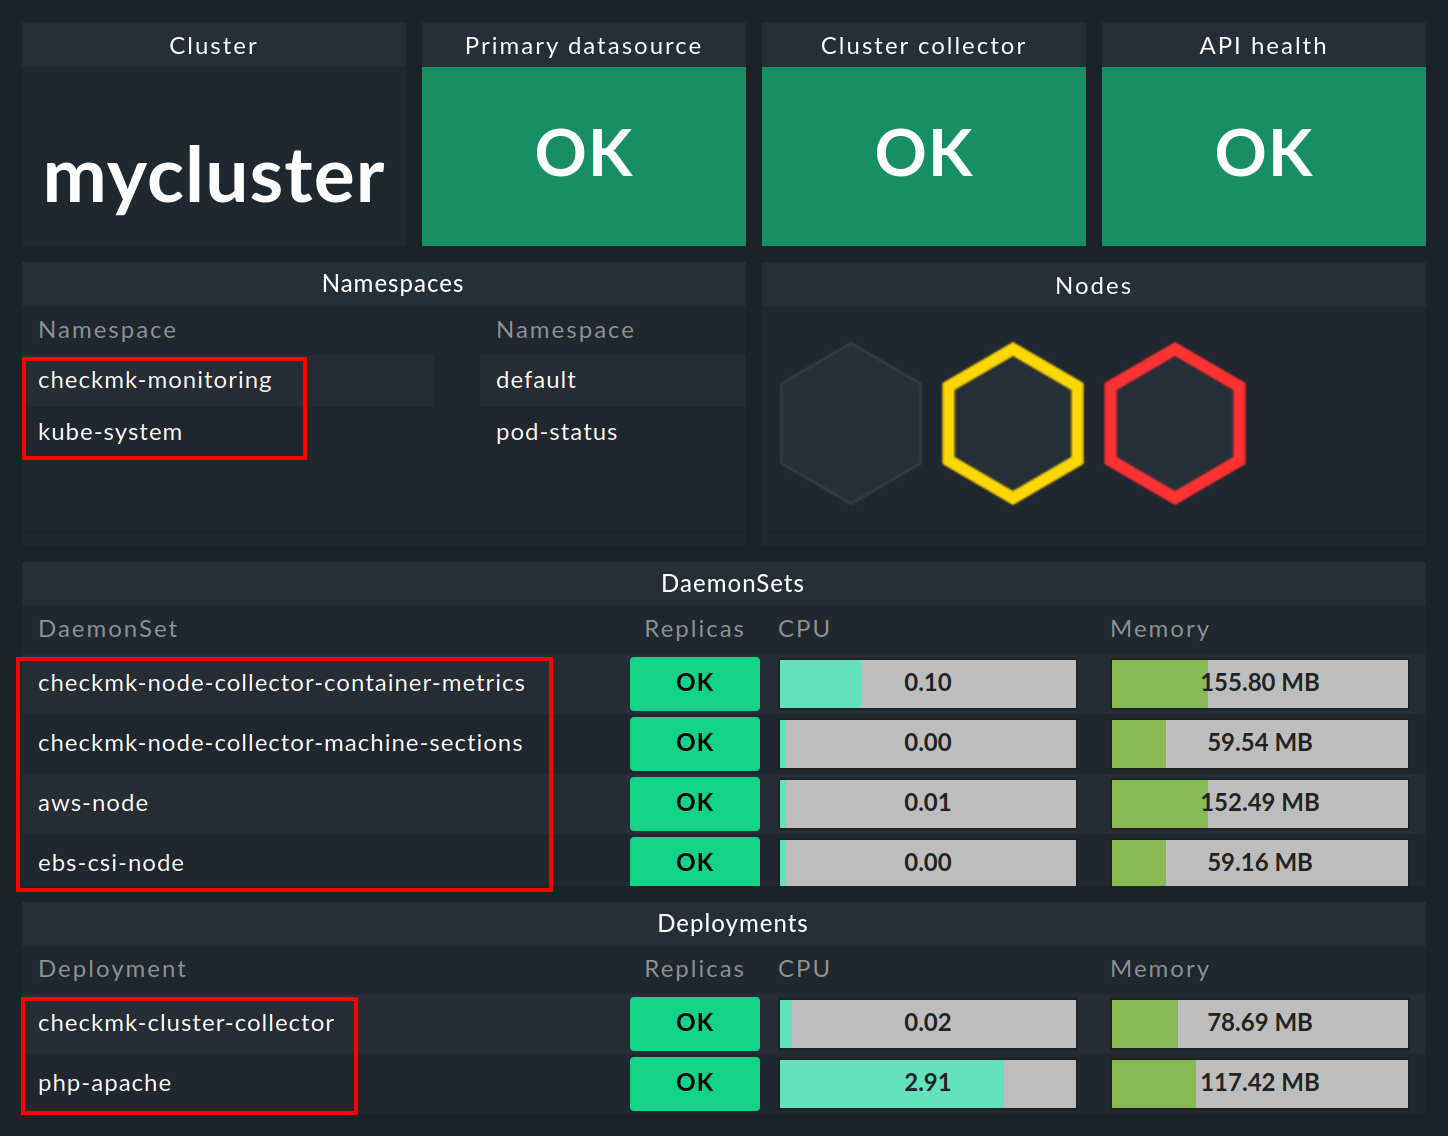
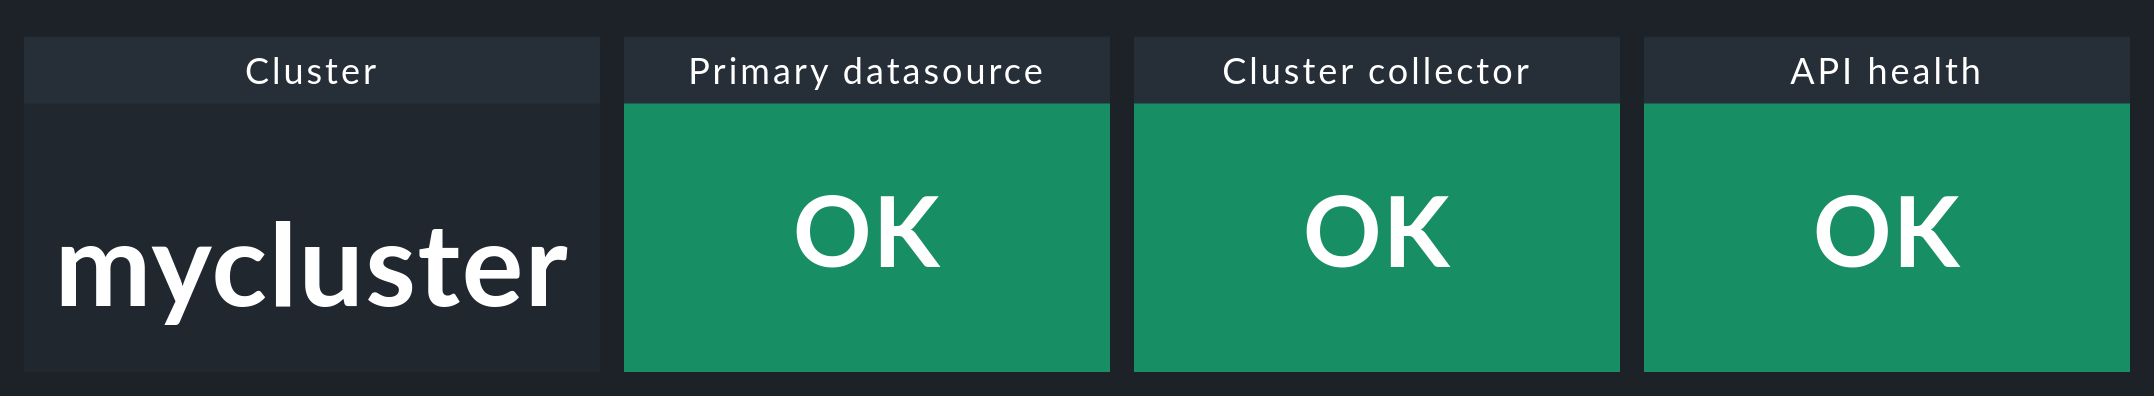
If you now click on the cluster name here, you will land in the Kubernetes Cluster dashboard for the respective cluster. Here the three boxes Primary datasource, Cluster collector and API health should be green and show OK.
8. Removing monitoring components from OpenShift
8.1. Deleting the service account
If you have used our default YAML file to create the service account, you can also delete it as follows: