

1. Introduction
 Until now,
  Checkmk Ultimate
has stored metrics in Round Robin Databases (RRDs for short), event information in SQLite files, and inventory data in JSON files.
What they all have in common is that they are relatively simple, file-based formats whose size and performance are highly predictable, and which offer sufficient flexibility for core tasks.
Checkmk Ultimate
has stored metrics in Round Robin Databases (RRDs for short), event information in SQLite files, and inventory data in JSON files.
What they all have in common is that they are relatively simple, file-based formats whose size and performance are highly predictable, and which offer sufficient flexibility for core tasks.
However, RRDs in particular no longer meet all the requirements of a modern monitoring system with many dynamic objects. While querying a metric over a defined time period is easily possible, more complex queries—such as identifying time periods during which multiple metrics exhibited anomalies—require extracting large volumes of data and processing them separately. Furthermore, the approach taken in Checkmk 2.4.0—making OpenTelemetry data available in Checkmk via a special agent using 'traditional' methods—came with a certain overhead in terms of conversion and copying operations.
For these reasons, Checkmk Ultimate 2.5.0 decided to initially use a column-based database as the metric backend for OpenTelemetry data. We chose ClickHouse here because its data transfer from the OpenTelemetry Collector to the database is very efficient. Column-based databases deliver excellent performance when many values of a metric need to be read—a typical use case for this is, for example, generating graphs from metrics.
Currently, the metric backend is used only for OpenTelemetry metrics. For future versions, we reserve the right to use the metric backend for additional monitoring data in addition to RRDs. Where RRDs satisfactorily fulfill their purpose, Checkmk will continue to use them in the future.
2. Setup
Note that any processing of OpenTelemetry metrics requires an enabled metric backend. Only the forwarding of OpenTelemetry logs to the Event Console does not require this.
You can enable this in the global settings (Setup > General > Global settings > Site management > Metric backend). Unless otherwise specified, Checkmk uses three seemingly random high-numbered ports—for data collection by the OpenTelemetry Collector, data querying, and a web GUI acting as an SQL console. The ports used are derived from the site’s name, so they are always the same three ports for Checkmk sites with the same name.
You can do without the web GUI as an SQL console. However, this can be helpful during testing, so we recommend keeping it at least until you have completed all tests.
2.1. Distributed monitoring
Currently, no forwarding mechanisms are planned in distributed monitoring. Therefore, if you send OpenTelemetry metrics to OpenTelemetry Collectors and thus to metric backends of remote sites, these metrics can only be viewed there as a siloed solution.
For upcoming versions of Checkmk, we are therefore evaluating the possibility of creating a central site for the metric backend enabling the use of a distributed ClickHouse cluster. Details will be available in the road map documentation in due course.
In Checkmk 2.5.0, the most pragmatic approach is likely to be using the OpenTelemetry Collector and metric backend solely on the central site. If this approach is not feasible due to network segmentation, you can also run OpenTelemetry Collectors and metric backends as a standalone solution on remote sites. Note that in this case, only data that passes through the special agent can be used in distributed monitoring. The use of custom graphs is only possible at their source.
2.2. Troubleshooting
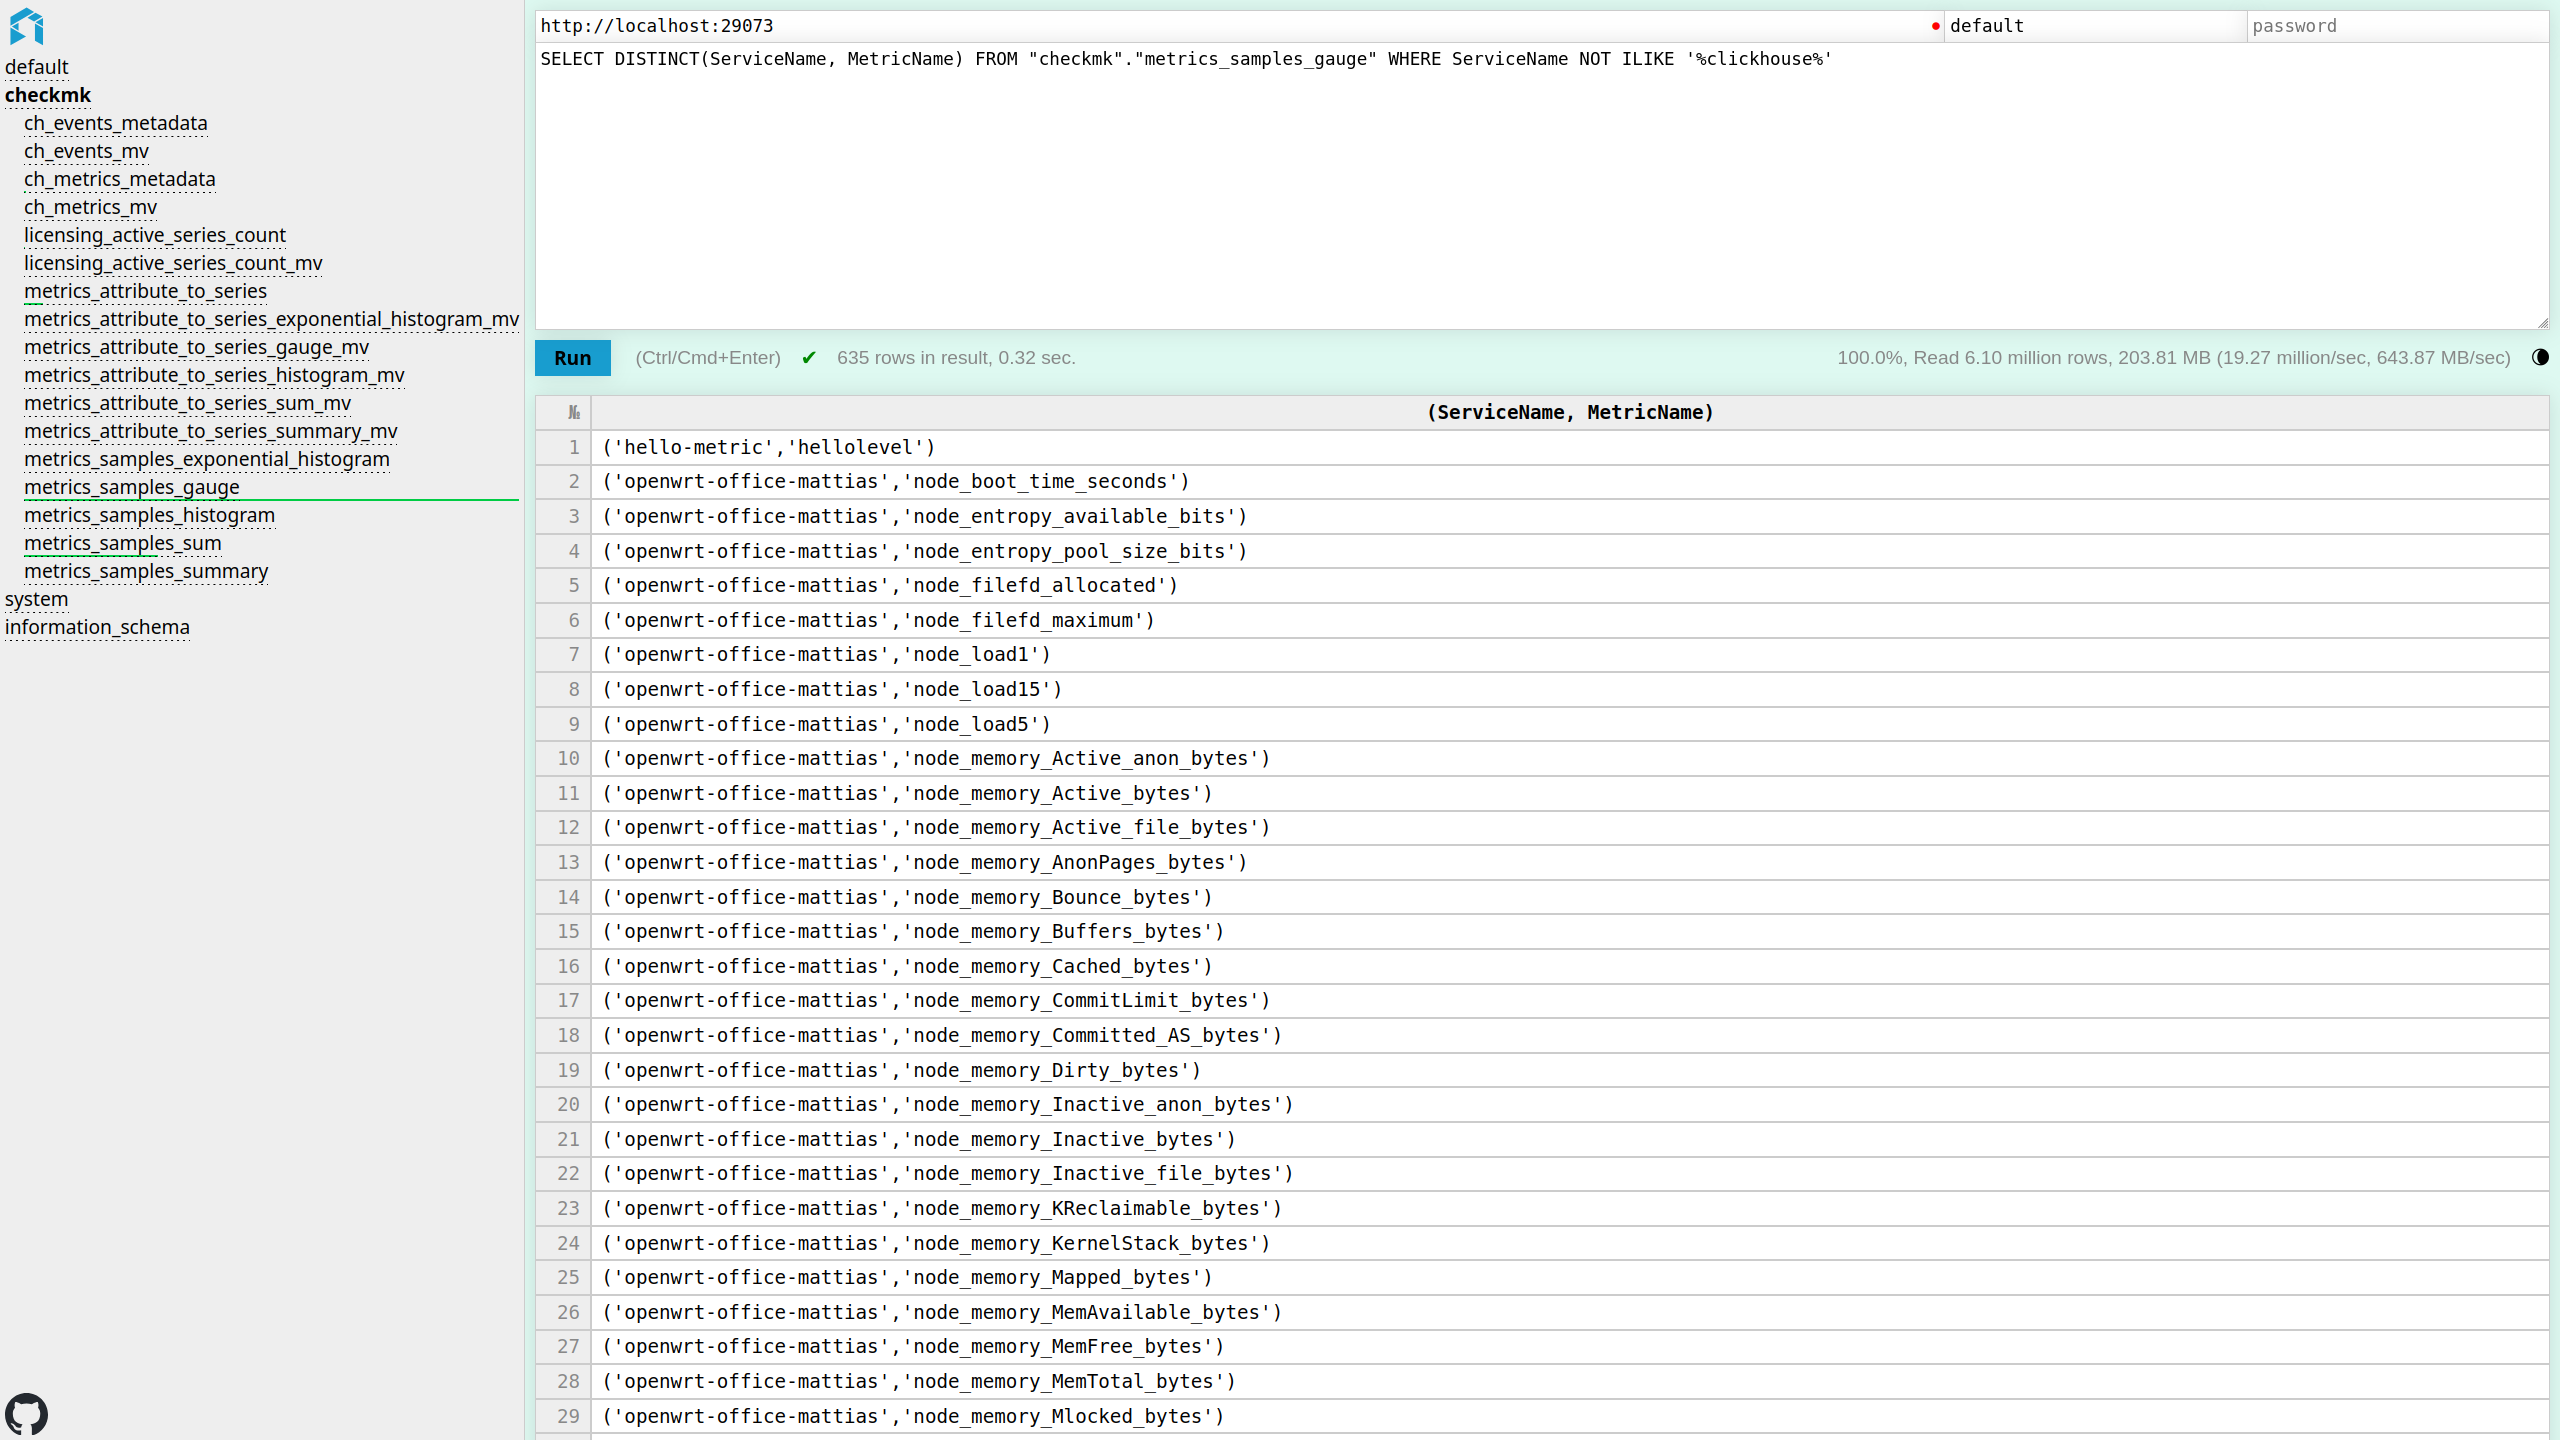
You can confirm whether data is being received and stored with the expected metadata in the ClickHouse SQL console.
The checkmk.metrics_samples_* tables are usually the ones you want to explore.
3. Basics for calculating licensing
3.1. Custom Metrics
A Custom Metric corresponds to a time series of data identified by Service Name, Metric Name (in the terminology of the metric backend or the OpenTelemetry Collector), and other attributes. You can view the current number of Custom Metrics at any time via the OMD mysite metric backend service in your Checkmk site’s self-monitoring.
The billing-relevant number of Custom Metrics is determined every 20 minutes. Only Custom Metrics that have received updates within this 20-minute interval are included in the count. Once a day, an average of these numbers is calculated across all 20-minute intervals over the past 24 hours. From this, the monthly average is calculated at the end of the month.
3.2. Frequency of incoming data
The frequency of incoming data for Checkmk Ultimate is currently limited only by your hardware, settings such as the connector’s storage limit, and the network connection of the Checkmk server.
3.3. Retention period
The retention period for telemetry data is limited to 14 days. This value cannot currently be configured in Checkmk. If changes are made to configuration files, we reserve the right not to provide support.