

1. Introduction
Whether you use  Checkmk Community with the Nagios core or one of the commercial editions with Checkmk Micro Core (CMC):
In both cases, with the correct settings for the monitoring core and core-related processes, you can minimize memory requirements, avoid load spikes and thus make optimal use of your existing hardware.
The Checkmk out-of-the-box settings work very well for the vast majority of Checkmk installations. A server with four cores, eight gigabytes of RAM and more than 20,000 services is not unusual. However, we (particularly the support staff at Checkmk) have also encountered installations where a few slow-responding hosts and other factors led to performance issues even with fewer than 5,000 services on 16 GB of RAM.
In such cases, tuning the monitoring core is strongly recommended—and usually leads to success very quickly. But even in cases where Checkmk runs like a dream, this article helps to free up resources that you can devote to other tasks. This could, for example, involve running a test site on the same machine alongside a production site.
The configuration options presented here also take into account the extent to which the GUI is used and whether other applications need to run on the same machine alongside Checkmk: In such situations, it is often desirable to cushion load spikes even after a restart, allowing Checkmk a little more time until all services have returned to a stable state. Conversely, for sites with which there is little direct interaction, it can be helpful to ensure that all services are up to date again quickly following a short, high-load period.
2. Exploring other tuning options first
A very good overview of all tuning options (including those presented in this article) is provided by the Performance tuning and more—Checkmk under the hood presentation from the Checkmk conference #11, which you can watch on YouTube.
2.1. Apache and other site services
Read the article on site services to find out which services you might be able to do without, and how to optimally configure the Apache site to suit the utilization behavior on your Checkmk server. If you have come across this article because of acute performance issues, reduce the number of Apache processes to the absolute minimum before applying the measures outlined here. You can then increase this back to a reasonable level later on—once sufficient RAM and CPU resources have been freed up.
2.2. Agent execution duration
One area you should address before optimizing the monitoring core and core-related processes is the execution duration of agents. Between making contact with the agent and receiving the complete agent output, a process simply waits. In Checkmk Community, this is a single Python process that retrieves the agent output and then processes it. This usually requires 80 to 100 MB of resident memory. In the commercial editions, this is a so-called Fetcher, which does nothing other than pass on agent outputs. These, too, generally require 30 to 60 MB of resident memory.
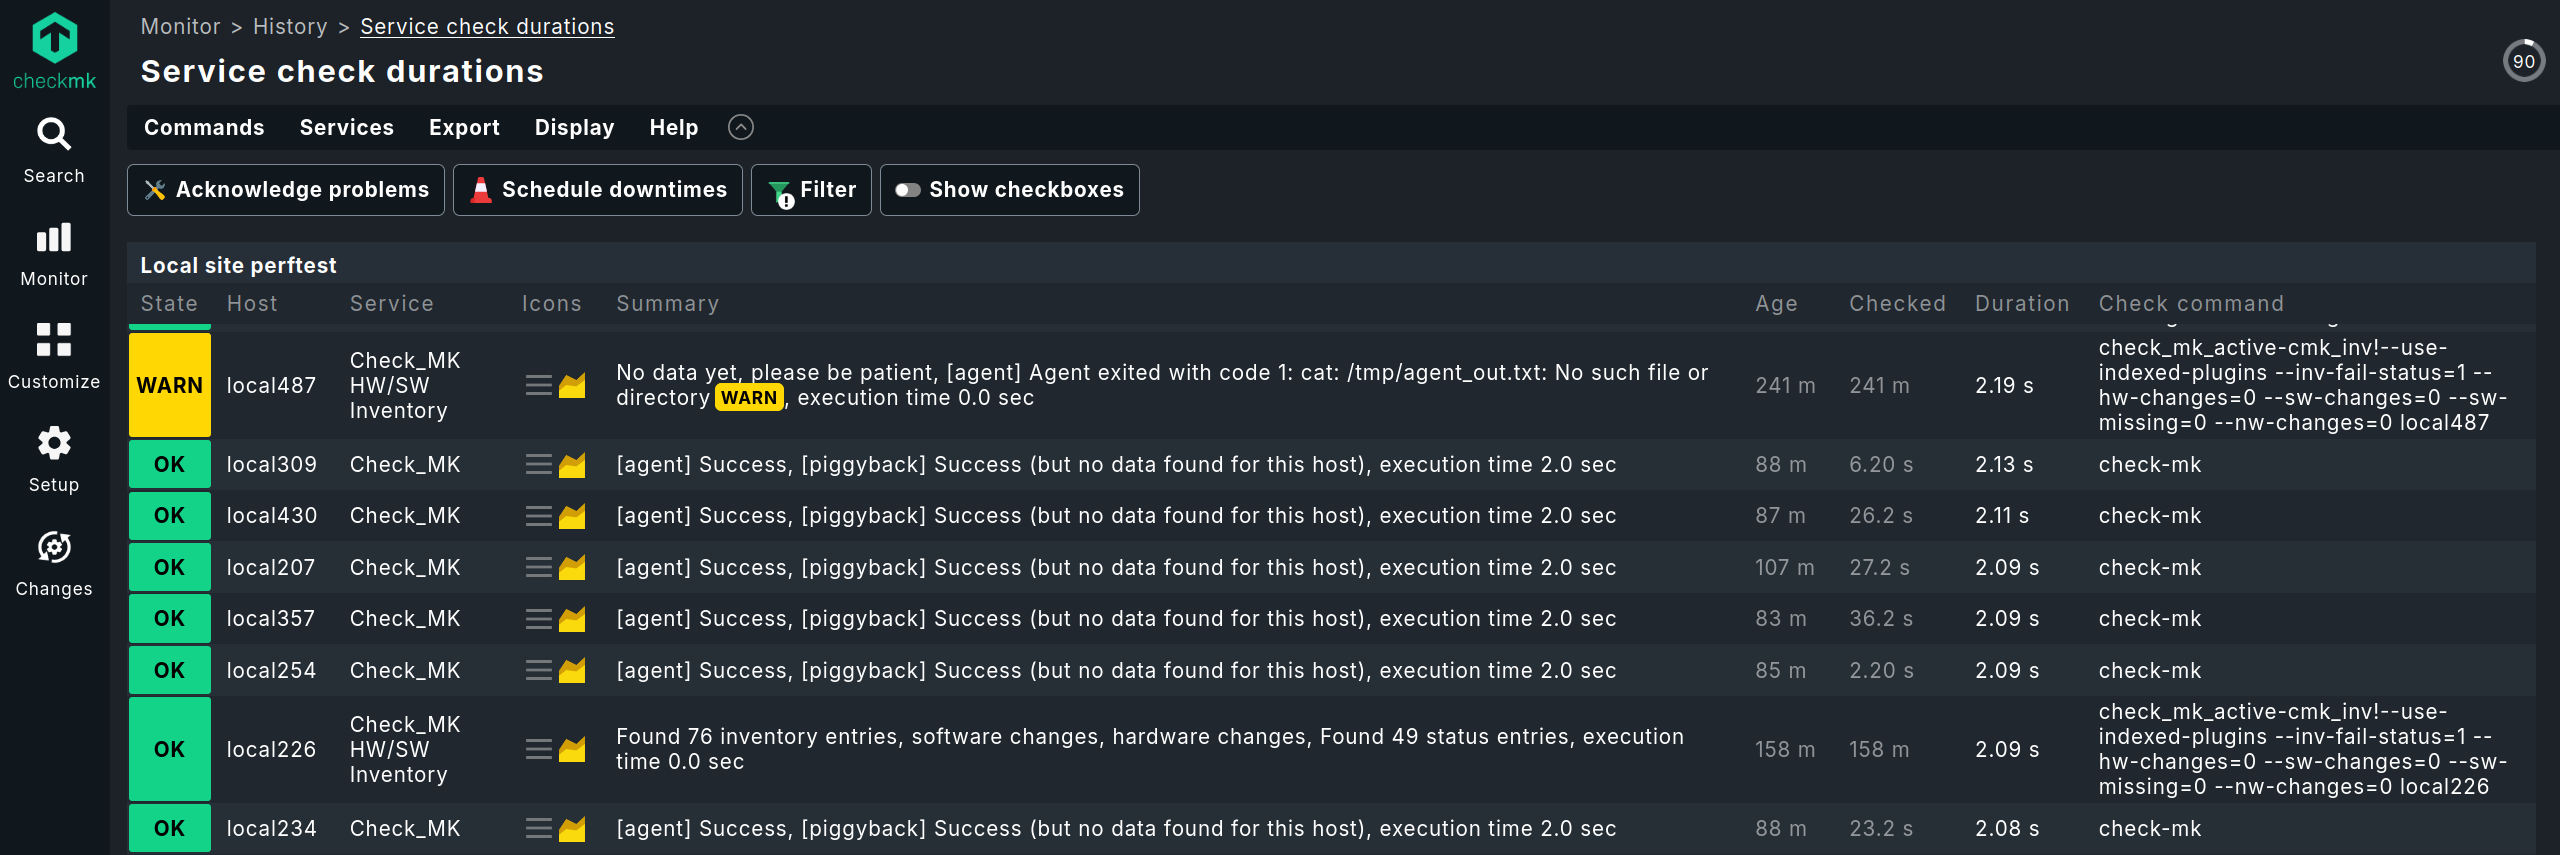
To optimize performance, first determine the number of hosts monitored by regular agents, special agents and SNMP, and their average execution time. To help with this, take a look at the monitoring of 'typical' hosts—the Check_MK service is of particular interest here. A top list is provided by Monitor > History > Service check durations; a complete list can be obtained via Livestatus.
You can also retrieve performance data for the collection of agent data using Livestatus.
The services table contains a perf_data column, which lists the execution times for various processes.
Filter for active checks (retrieving data via the fetcher is included in this category).
In the perf_data column, the sum of user_time and system_time represents the CPU time.
The final value--cmk_time_agent or cmk_time_smtp--is the time taken to retrieve agent data.
The following example shows how to retrieve this data for the most recent check:
If you also wish to determine the execution time of active checks at a later stage, replace the filter description = Check_MK with active_checks_enabled = 1.
The following table shows the waiting time for agent outputs and the duration of subsequent processing in a fictitious environment (using rather pessimistic assumptions regarding CPU time), totaled for a one-minute check interval. In practice, the assumed figures usually result in 3,000 to 5,000 services.
| Number | Check | Waiting time | Total | CPU time | Total |
|---|---|---|---|---|---|
100 |
Hosts monitored with Checkmk agent (normal speed) |
2 s |
200 s |
0.3 s |
30 s |
10 |
Hosts monitored with Checkmk agent (slow) |
15 s |
150 s |
2 s |
20 s |
20 |
SNMP devices (older hardware, not even particularly slow) |
10 s |
200 s |
1 s |
20 s |
5 |
Hosts without an agent, monitored only with a special agent |
5 s |
25 s |
2 s |
10 s |
2 |
Very resource-intensive special agents (e.g. cloud services) |
25 s |
50 s |
5 s |
10 s |
Total |
625 s |
90 s |
We will refer back to this table several times later in this article—when calculating Checkers, Fetchers and concurrent Nagios checks.
As there are only 60 seconds in a minute, the table shows that at least 11 parallel processes are required which are simply waiting. Between 330 and 1100 MB of RAM are occupied during this time, but are not being put to good use. It is clear that simply optimizing the slowest hosts can have a positive impact on the performance of your Checkmk site.
We will not go into CPU time at this stage. However, as other processes and the overhead involved in creating processes have not yet been taken into account, a rough estimate suggests that two CPU cores will not be sufficient here. Operations should run satisfactorily on three cores, and with four cores there should still be scope for adding further hosts.
Possible measures for optimizing waiting times include:
Asynchronous execution of plug-ins
Identify particularly slow agent plug-ins and switch them to asynchronous execution.
Increasing check intervals
For some SNMP devices and many APIs accessed via special agents, the actual update interval is longer than the regular check interval. In such cases, the check interval can be increased without compromising visibility.
Switching to push mode
 In Checkmk Ultimate, the push mode is available for agents.
If this is used, the agent first executes its plug-ins and then transfers the entire agent output to the server.
There, it is stored in the temporary file system, from where it is read in fractions of a second.
Effectively, the waiting time in the table above can then be set to 0.
In editions without push mode, you can implement optimizations yourself by first writing the agent output to a file at the desired interval via a cronjob and then transferring it to the Checkmk server.
There, you can read the agent output using an data source program, which simply cats the file contents.
The simplest possible script to save the agent output and upload it to the server might look like this:
#!/bin/bash
cmk-agent-ctl dump > /tmp/${HOSTNAME}.txt
scp /tmp/${HOSTNAME}.txt mysite@myserver.test:/tmp/communitypush/
3. Tuning the Checkmk Micro Core (CMC)
We have dedicated a separate article to the concepts of the CMC in  Checkmk Pro and Checkmk Ultimate; in this article, you can read about architectural decisions such as the high degree of modularization based on tasks, such as data retrieval and evaluation.
First, take a look at the Checkmk configuration analysis:
This static analysis immediately highlights any settings that deviate significantly from our recommendations, which could lead to problems in the future.
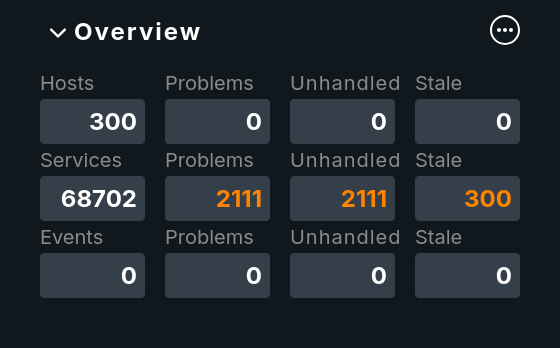
To keep track of how the current performance settings are affecting day-to-day operations, you should have the Overview snap-in enabled in the Checkmk GUI. Of particular interest here are Stale services. These services with stale data can indicate two things: Either an agent plug-in is not providing (analyzable) data, or Checkmk is unable to keep up with retrieving or analyzing monitoring data. Clicking on the number of Stale services takes you directly to a list that helps you assess which type is involved in each individual case.
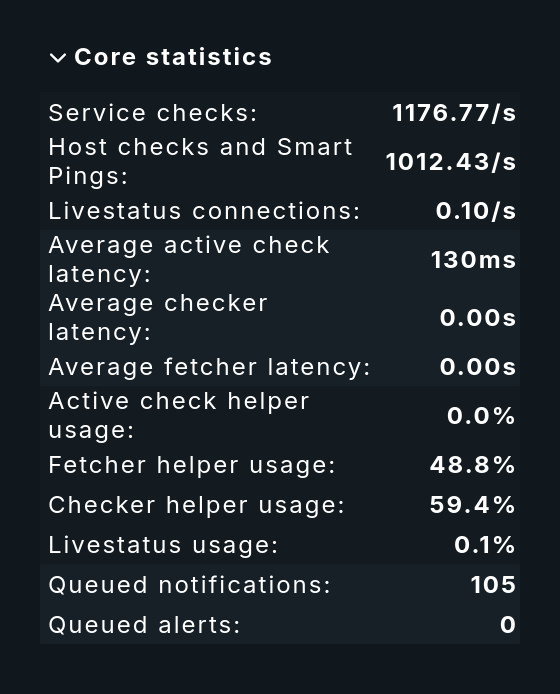
Another useful snap-in is Core statistics: It displays check rates, latencies and the usage of relevant processes.
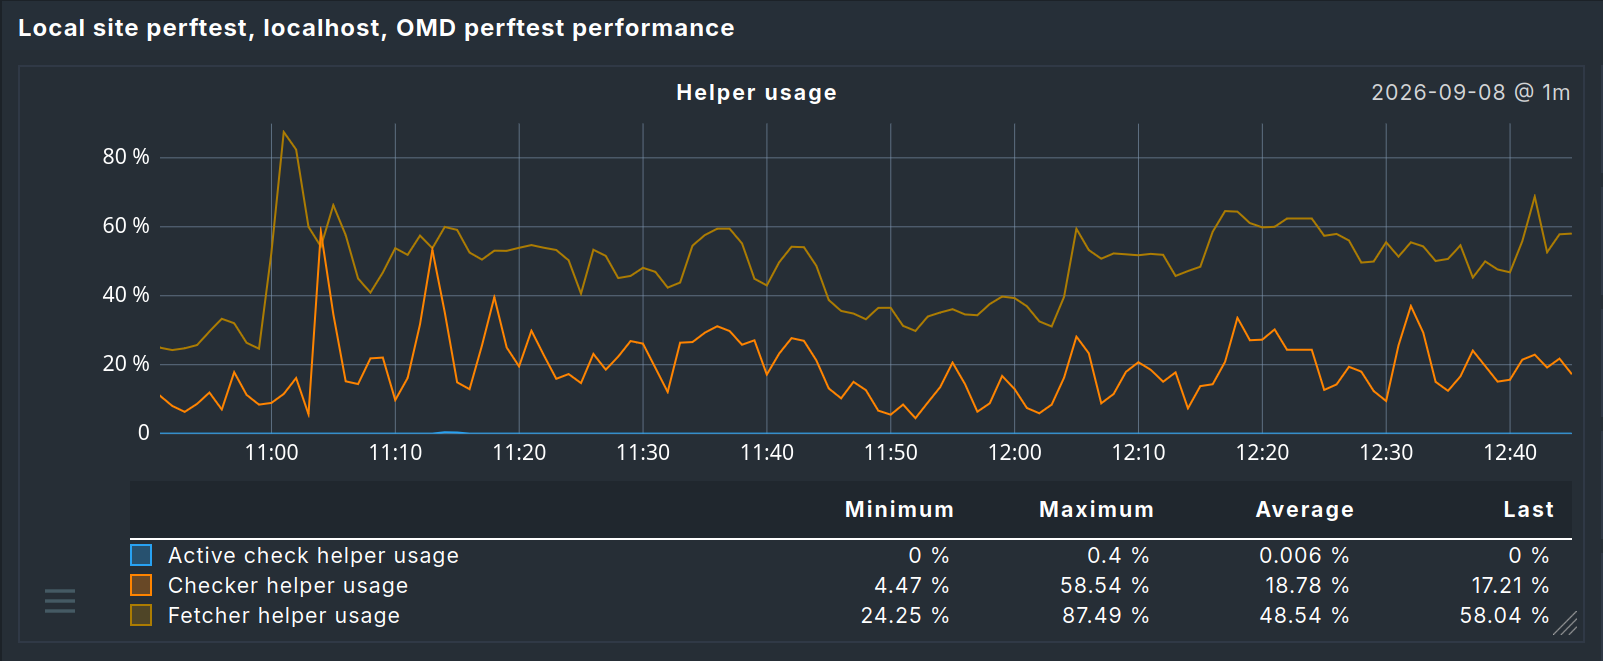
If you would like to see how these performance figures change over time, take a look at the metrics for the OMD mysite performance service. Here, particularly in the Helper usage metric, you can quickly see how changes you have made affect performance and usage.
You can configure the settings described in the following sections under Setup > Global settings in the Monitoring core section.
3.1. Number of checkers
Checkers are the auxiliary processes that process monitoring data before it is written to the monitoring core. Their task is, in practical terms, almost entirely CPU-intensive: The data to be processed is usually already in working memory, which is why no process waiting for I/O needs to be swapped out.
The usage of the checkers depends very heavily on the complexity of the check plug-ins being run and the volume of data being processed at any given time. It is therefore difficult to specify exact calculation methods. Ideally, you will have created a list of CPU times per Livestatus and totaled these. In this case, you simply need to divide the result by 60 (the regular check interval) and initially double it roughly.
If you have not carried out the calculations but would rather estimate and optimize: On current hardware, a checker can usually handle an average number of checks ranging from the four-digit to well into the five-digit range. A rough calculation of the number of checkers can therefore initially assume one checker per 5,000 services.
 |
Do not use fewer than two checkers, and never exceed the number of physical cores. |
As checkers must store their configuration in working memory and the process size can therefore amount to several hundred megabytes, you should monitor the usage and promptly reduce the number of checkers back to a level where usage is around 50 %. Based on this usage, whilst monitoring latencies (particularly after a restart of the Checkmk site) and load peaks, you can further reduce the number of checkers (or include further services in the monitoring) until usage is around 80 %.
|
You have probably already guessed: The usage of the Checkers and the Fetchers described below must somehow be in balance. If too many fetchers are configured but too few checkers are active, a bottleneck arises when processing retrieved monitoring data after restarts, and RAM is unnecessarily tied up by fetchers and monitoring data. Conversely, too many checkers simply sit idle and tie up valuable working memory. You should therefore aim for similar utilization rates. |
3.2. Number of fetchers
Fetchers are the auxiliary processes that retrieve agent output, launch special agents and query SNMP devices. Determining their number is somewhat more complex than that for checkers. It is not possible to make general statements about the number, as the requirements of different monitoring environments vary too greatly.
In the context of Agent execution table, we have already indicated that you can determine the number of fetchers required quite accurately based on the waiting time for agents. In addition to this rather theoretical approach, you can also identify the current usage and optimize the number of fetchers to suit the current usage situation.
In practice, you will want to combine both approaches: calculation and optimization.
For an initial Setup, you should aim for around 50 % fetcher usage. In the example shown above, with eleven fetchers required but only 13 available, you would be well over 80 % usage. It would therefore make sense to start by increasing the number of fetchers to around 20. The snap-in mentioned above Core statistics provides you with real-world feedback. If your calculations indicate only a very small number of required fetchers, do not go below three.
The following also applies to fetchers in the long term: Based on this usage, you can further reduce the number of fetchers (or include additional services in the monitoring) whilst observing latencies (particularly after a restart of the Checkmk site), behavior during network issues and load peaks. However, fetchers are more sensitive to external factors than checkers: If network latencies increase or packet loss occurs, the fetcher usage will rise significantly. You should therefore only aim for an upper level of 75 %–80 % if you have a very reliable network.
3.3. Active checks
The auxiliary processes listed under Active check helpers are responsible for running active checks.
The default setting for active checks in the CMC is a maximum of five running simultaneously.
To help you estimate this, have another look at the list of results under Monitor > History > Service check durations.
Here you will see that the inventory check (which runs once a day by default) can sometimes take up to a minute, a check_cert often completes in a few hundred milliseconds, and the values for check_httpv2--depending on the performance of the endpoint being checked—vary considerably.
Ultimately, you can perform a calculation as above--with five Active check helpers, 300 seconds are available per interval.
Alternatively, you can first take a look at the OMD mysite performance service, specifically the Helper usage metric and the Active check helper usage graph line there.
As with the fetchers, the following applies when calculating this figure: Do not go below three, and in larger environments, aim for an initial usage of around 50 %, which you can then gradually increase later.
3.4. Behavior during restarts
A distinctive feature of the CMC is that changes to the configuration do not require the entire monitoring core to be restarted. The CMC can load a new configuration whilst the system is running and resume operation within fractions of a second. The settings for a full restart of the core are therefore more relevant during server updates and reboots.
Here, the default settings specify a 150-millisecond wait time between active checks and 1,200 milliseconds between retrieving agent output. This is far more generous than the default value the fetcher would otherwise allow. The reason for this is the expectation that other services will also be starting up whilst the server is restarting. For generously sized servers with many hosts under monitoring, this may mean that, although the load is low just a few minutes after the restart, Checkmk is still far from having updated all services.
Provided that the number of fetchers and checkers has already been optimized, you can significantly reduce these intervals in such situations.
4. Tuning the Nagios Core
 The Nagios core used by Checkmk Community is quite robust, but has some drawbacks when running active checks.
Nagios launches a child process every time an active check is run.
These child processes are started sequentially, whilst the actual execution can take place in parallel.
The key to tuning Nagios therefore lies in optimally controlling the number and spacing of these forks.
You can configure the settings explained in the following sections in the file ~/etc/nagios/nagios.d/timing.cfg.
In this file and in ~/etc/nagios/nagios.d/tuning.cfg, you will also find further—less relevant—configuration options.
After each change, it is necessary to rebuild the configuration using cmk -R and restart the kernel.
However, it may also be necessary to change parameters in the Linux kernel. The reason for this is that Nagios requests a lot of memory that it never actually uses. In principle, Linux allows all running processes to request a total amount of memory that exceeds the available memory. However, the kernel’s default setting here is very conservative. The following section, Kernel Tuning, explains how to make these adjustments.
4.1. Avoiding forks
Before you optimize forks, you should avoid them wherever possible. Bear in mind that calling the Check_MK service, which retrieves the agent’s output—and then passes dozens of check results as passive checks directly to the monitoring core—generates the same overhead in terms of process creation and result transfer as a simple active check that monitors exactly one network service. It therefore makes sense to reduce the number of active checks wherever possible. Possible examples include:
If you want to monitor MySQL or MariaDB databases, rather than opening the database port via the firewall for the Checkmk server and using an active check, it is better to install an agent plug-in.
Do you want to ensure that SMTP sending is working, because the SASL authentication daemon on your mail servers crashes from time to time? Of course,
check_smtpis quick to configure, but running this active check locally on the monitored hosts using MRPE as an agent plug-in offers better performance.When you have the choice between an active check to retrieve data for hosts or a special agent that generates piggyback data for many hosts? If data for dozens of hosts is retrieved with a single launch of a Python interpreter, the decision should clearly favor the special agent—even if the active checks are implemented in a more efficient programming language.
4.2. Maximum number of concurrent checks
In the default configuration, running any number of parallel checks is possible. This setting works well under low load, from very small to very large systems. However, it is worth consistently adjusting this number to suit your own monitoring requirements, thereby achieving the best possible balance between memory usage and CPU utilization.
|
You may find that, based on the calculation principles and optimization suggestions in this section, the figures you arrive at require adjustments to the Linux kernel configuration in order to be effective. You should therefore read this section and the next one, Kernel Tuning, before making any changes. |
# MAXIMUM CONCURRENT SERVICE CHECKS
# This option allows you to specify the maximum number of
# service checks that can be run in parallel at any given time.
# Specifying a value of 1 for this variable essentially prevents
# any service checks from being parallelized.  A value of 0
# will not restrict the number of concurrent checks that are
# being executed.

max_concurrent_checks=0
To calculate the value theoretically, divide the total execution time as shown in the table above by the check interval (default 60 seconds) and add a further 30 % to 50 % on top. Given the total time of 715 seconds calculated above, a value between 16 and 18 would therefore be a reasonable starting point from which you can continue to optimize.
If, after the core has started, as many services as possible are to be brought up to date as quickly as possible, a value must be found that ensures two things:
Sufficient data is collected so that all CPU cores can be used almost to full capacity.
Not too much data is collected, so that processes processing the data do not have to compete for CPU resources.
Given the 8:1 ratio mentioned above (715 seconds in total to 90 seconds of CPU time), a value of 32 for max_concurrent_checks would fulfill both conditions on a four-core system.
|
One thing should be clear at this point: If the first calculated value is higher than the second, your requirements exceed what your hardware can handle. In this case, you will need to reduce the number of checks or increase the check intervals. |
If you don’t want to do the initial calculations but are looking for a rule of thumb for the max_concurrent_checks value:
Start—based on your judgment—with a value between two and four times the number of CPU cores, and fine-tune from there.
If, a good five minutes after restarting the monitoring core, you still have services that are Stale, you will need to increase max_concurrent_checks.
Conversely, if no services are Stale after less than a minute, use htop to check whether spikes occur at the start of a check interval.
When using htop, we recommend pressing the U (User) key to restrict the display to the site user and then pressing T (Tree) to switch to the tree view.
If necessary, reduce the maximum number of concurrent checks further.
However, even in small installations, do not go below two.
You must now also ensure that your Linux kernel permits the launch of all these processes.
4.3. Kernel tuning
 |
Only apply the settings described here if you have also reduced the number of Apache processes to a reasonable level and have actually limited |
For more than a quarter of a century, the Linux kernel has allowed memory overcommitment. This means that Linux allows processes to request a total amount of working memory greater than the physical memory available on a device. The default setting is to use a heuristic that attempts to predict future processes based on those started and terminated in the past. However, with Nagios, the ratio between working memory simply requested on a whim (“I might need this at some point…”) and the memory actually used in resident memory is so high that the Linux kernel often refuses to create new processes unnecessarily.
You must therefore determine whether the virtual memory used by Nagios processes can be plausibly requested from the Linux kernel. If this is not the case, you must make changes to the memory overcommitment settings.
Calculating the required memory
If only Checkmk is running on the server to be tuned, you can use the specified maximum number of processes to roughly calculate how much of the resident memory is actually being used.
We’ll use the 18 max_concurrent_checks we’ve just determined:
| Count | Process | Resident memory | Virtual | Total resident | Virtual |
|---|---|---|---|---|---|
18 |
Nagios |
30 MB |
1000 MB |
540 MB |
18000 MB |
18 |
Python (for Check_MK) |
100 MB |
150 MB |
1800 MB |
2400 MB |
10 |
Apache |
250 MB |
500 MB |
2500 MB |
5000 MB |
Total |
4,840 MB |
25,400 MB |
On a server with 8 GB of RAM, even taking other Checkmk processes into account, it seems at least plausible that you will not encounter any hard limits with 4,840 MB of resident memory.
Check the current overcommitment setting
First, check the current setting:
The value 0 shown here indicates that heuristic allocation is enabled.
If your calculation has shown that the virtual memory requirement is less than twice the amount of available working memory, no adjustments are usually necessary.
Making adjustments
Our calculation, however, has shown a figure more than three times that amount. An adjustment is therefore required. The following settings are available:
| Setting | Effect | Comments |
|---|---|---|
0 |
A heuristic determines whether a process is still permitted to request too much virtual memory |
Default |
1 |
No check is carried out; as long as there is any free memory available, a new process may request as much virtual memory as it wishes |
may be dangerous |
2 |
Overcommits are permitted within certain limits, which you specify using |
a good compromise between security and flexibility |
If Checkmk is the only application on your server, you can configure the following sysctl setting:
# Always accept each overcommit!
vm.overcommit_memory=1
Enable the setting:
The next step is to monitor actual memory usage and, in particular, to determine whether OOM conditions occur.
If your Checkmk shares your server with other applications, it may be advisable to assess their memory requirements in a similar way and to limit the number of processes accordingly—only then will the vm.overcommit_memory=1 be safe.
If this is not possible, you have the option of setting hard limits using vm.overcommit_memory=2:
# Setting to 2 means hard boundaries are respected:
vm.overcommit_memory=2
# Either specify as calculation ratio or fix value kilobytes
vm.overcommit_kbytes = 0
# The calculation is:
# CommitLimit = SwapTotal + vm.overcommit_ratio / 100 * MemTotal
# So, you'll most likely set this to something between 150 and 300
vm.overcommit_ratio = 50
4.4. Behavior during restarts
The settings shown here are particularly relevant if you have configured max_concurrent_host_checks to be unlimited or to a fairly high value.
By default, Nagios attempts to intelligently calculate the interval at which checks are initially started. However, this can lead to spikes at the start of the first check intervals, which persist for several minutes after the Checkmk site has started. In such cases, you can artificially deploy the initial checks over more than one check interval. Alternatively, if you wish to achieve full visibility in well under a minute, you can force an aggressive start behavior.
# SERVICE INTER-CHECK DELAY METHOD
# This is the method that Nagios should use when initially
# "spreading out" service checks when it starts monitoring.  The
# default is to use smart delay calculation, which will try to
# space all service checks out evenly to minimize CPU load.
# Using the dumb setting will cause all checks to be scheduled
# at the same time (with no delay between them)!  This is not a
# good thing for production, but is useful when testing the
# parallelization functionality.
#       n       = None - don't use any delay between checks
#       d       = Use a "dumb" delay of 1 second between checks
#       s       = Use "smart" inter-check delay calculation
#       x.xx    = Use an inter-check delay of x.xx seconds

service_inter_check_delay_method=s
Assuming you identify 400 active checks (including Check_MK) for the 130 hosts assumed above, a value of 0.15 ensures that these fit exactly within the 60-second interval.
For a smoother start and better distribution, you can also deploy the start over two or three check intervals.
The same applies to the variable host_inter_check_delay_method, which applies the same setting to host checks.
The calculation here is simple: one check per host.
With the figure of 130 hosts mentioned above, a reasonable value would be 0.4 seconds.
If you have set the number of max_concurrent_host_checks to a low value, you can use service_inter_check_delay_method=n to ensure that the initial scheduling takes place with maximum concurrency.
4.5. Parallelization through distributed monitoring
The actual Nagios core (scheduler, status calculation) runs as a single thread and therefore cannot benefit from multi-core processors. A fair amount happens in the main thread, and everything must take place sequentially. The following is relevant for Checkmk:
Scheduling is carried out.
Child processes are forked.
The Reaper must read the results of active and passive checks from the file system.
The need for notifications must be determined based on state changes.
In Checkmk, the Python processes launched as active checks do the bulk of the work in retrieving and processing the agent data. These write the check results to the Nagios spool directory, from where they are read by the Reaper at one-second intervals.
We are aware of two potential bottlenecks:
If there is a very high number of active checks, Nagios cannot keep up with forking.
If Checkmk writes a very large number of check results to the Nagios spool directory, the Reaper sometimes fails to read and process the data quickly enough.
The first issue mentioned can certainly occur on sites that use a high ratio of active checks to passive checks. The second is more likely to occur on larger-scale hardware with many cores and a very large number of passive checks.
Admins experienced in running Checkmk Community therefore often deploy the workload across multiple monitoring cores by setting up distributed monitoring on a single physical machine. A practical upper limit for such distributed monitoring is generally one Checkmk site per core.