1. What is NagVis?
In the article on Monitoring basics you saw the map of a network’s topology based on Parent-Child-Relationships. NagVis is responsible for such maps. The Nagios-Extension enables a visualisation of, for example, infrastructures, servers, ports or processes.
NagVis' mode of operation is basically very simple: Checkmk, or to be more precise Livestatus, provides backend data such as hosts, services, host groups and service groups. These elements from your monitoring can be placed as icons on various maps. These dynamic icons can then show the current status of each of the hosts and services. More detailed additional information can be provided by hover-menus. And finally, the icons and other elements are also links to the Checkmk-objects that they represent. Other available elements are lines, performance displays (Gadgets) and containers for external contents.
To get a better conception of what can be achieved with NagVis in Checkmk, here are three examples:
Geographic maps based on Open Street Map for managing sites
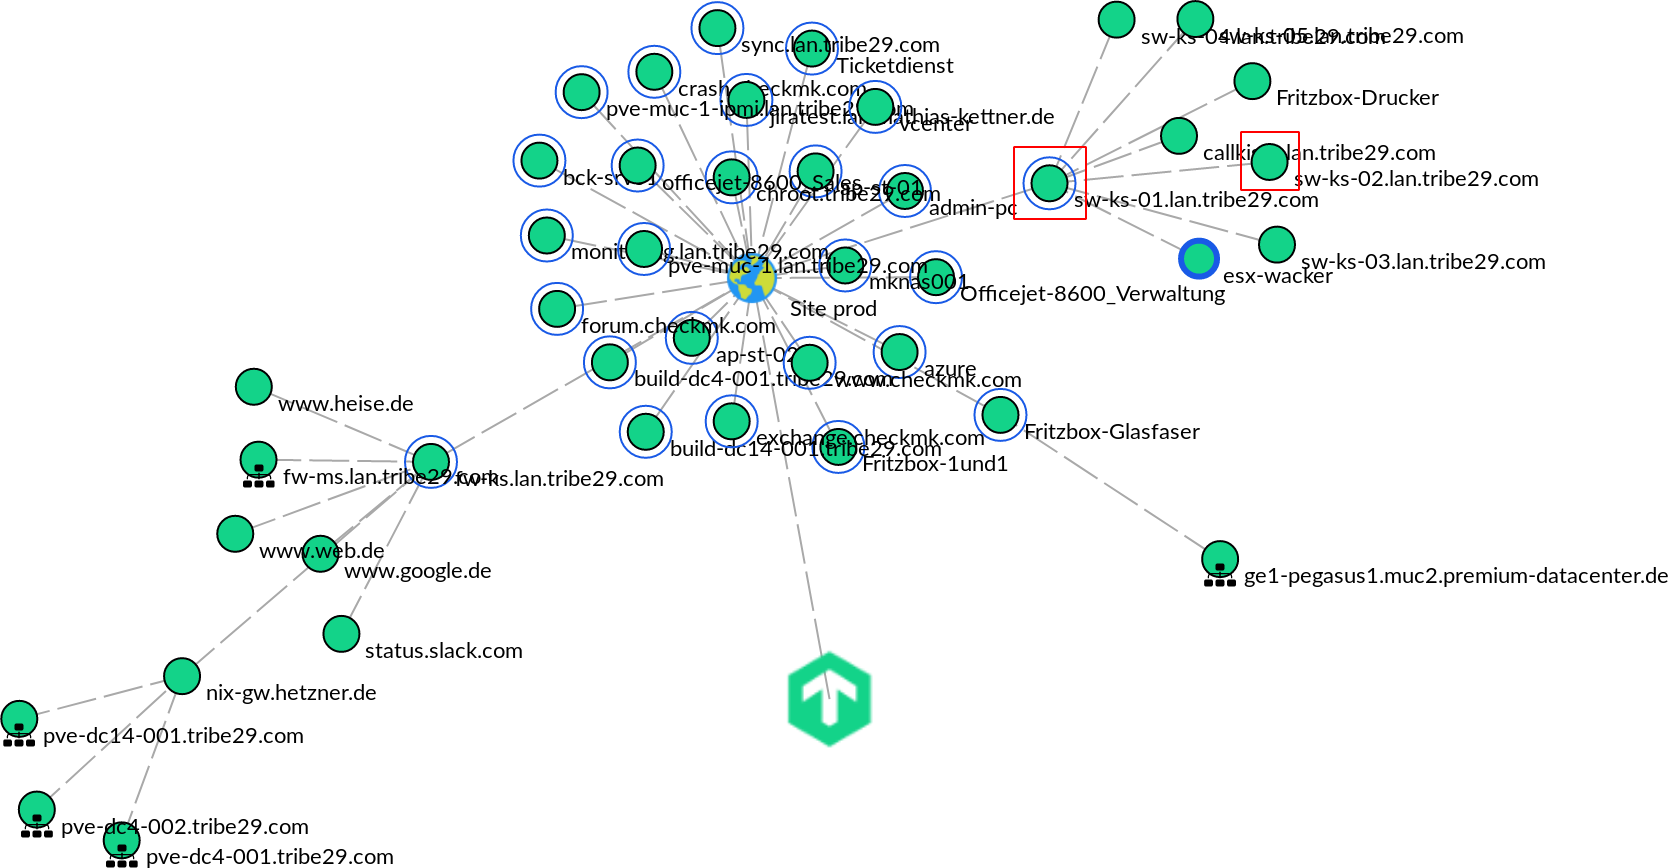
Automatic topological maps from Parent-Child-Relationships
Maps of individual switches or server rooms to enable an overview of ports and hardware
Provided the Parent-Child-Relationships have been defined, without further action you can call up a map from the basic articles using Views > Overview > Network Topology in the navigation. Aditional steps are unnecessary here.
2. Setting-up NagVis
NagVis is fully-integrated in Checkmk and configured so that you can immediately begin adding elements from your monitoring to maps.
To start NagVis, first open the section with available snapins for the sidebar via ![]() at the bottom of the sidebar.
Here select the NagVis maps snapin, and finally start NagVis with the
at the bottom of the sidebar.
Here select the NagVis maps snapin, and finally start NagVis with the ![]() button.
button.

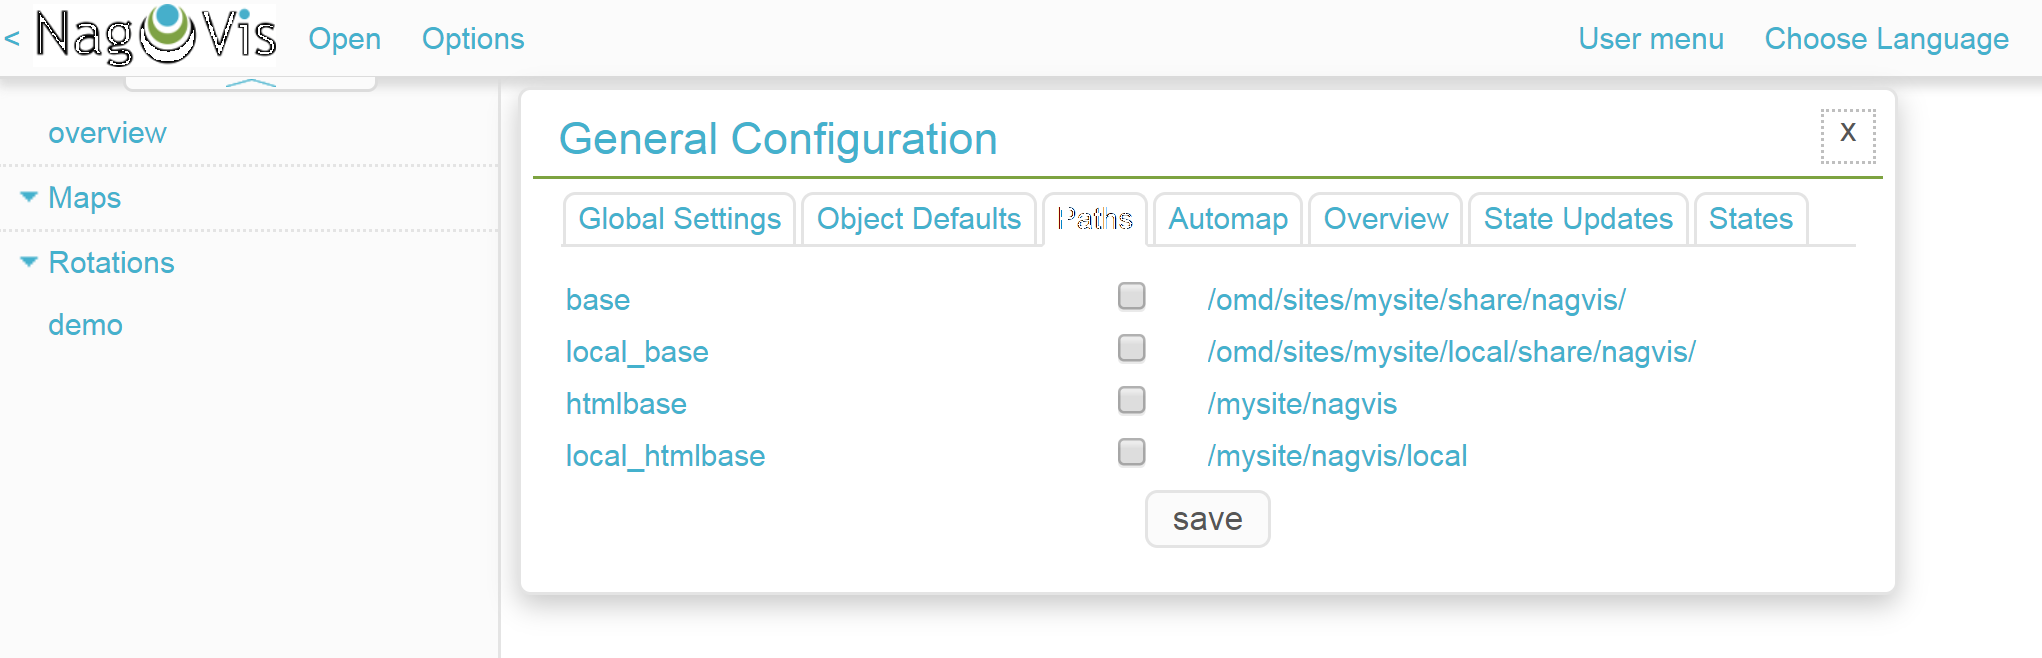
Before you create your first map you should have a look at the basic configuration in Options > General Configuration. Here can be found over 100 options for the basics, such as data formats and language settings, from the displaying of objects on maps, to the weighting of the available host and service statuses. All options are explained in the NagVis-Documentation.
At this point we would like to do without a comprehensive description for the use of NagVis, and especially its configuration options. NagVis itself has a very good, detailed Documentation. In the following section we will restrict ourselves to the most essential basics for generating simple, useful maps using NagVis in Checkmk.
3. Creating maps
3.1. The various types of maps
NagVis provides a total of five different map types: regular, dynamic, automatic and interactive/non-interactive geographic maps.
Regular Map is the standard type of map. The maps can visualise any desired scenario – from switch ports, to server rooms, to complete infrastructures. The elements (Icons, Lines, etc.) are added individually to the maps from the inventories of the Checkmk hosts and services.
Dynamic Maps largely resemble the Regular Maps, with a significant difference however: hosts, services, Host and service groups are not explicitly specifed, but instead by using filters in the form of Regular expressions; to put it more accurately, in the form of valid Livestatus-Filter-Definitions. In this way new hosts and services, and likewise any alterations land automatically on the map without additional manual action being required.
Automaps based on parent/child relations you have already met. These are the network topology maps mentioned at the start of this article which are generated fully-automatically from the Parent-Child-Relationships defined in Checkmk.
Geographical Maps are maps rendered with map material from the Open-Street-Map(OSM)-Projekt for their backgrounds.
3.2. Generating an automatic map
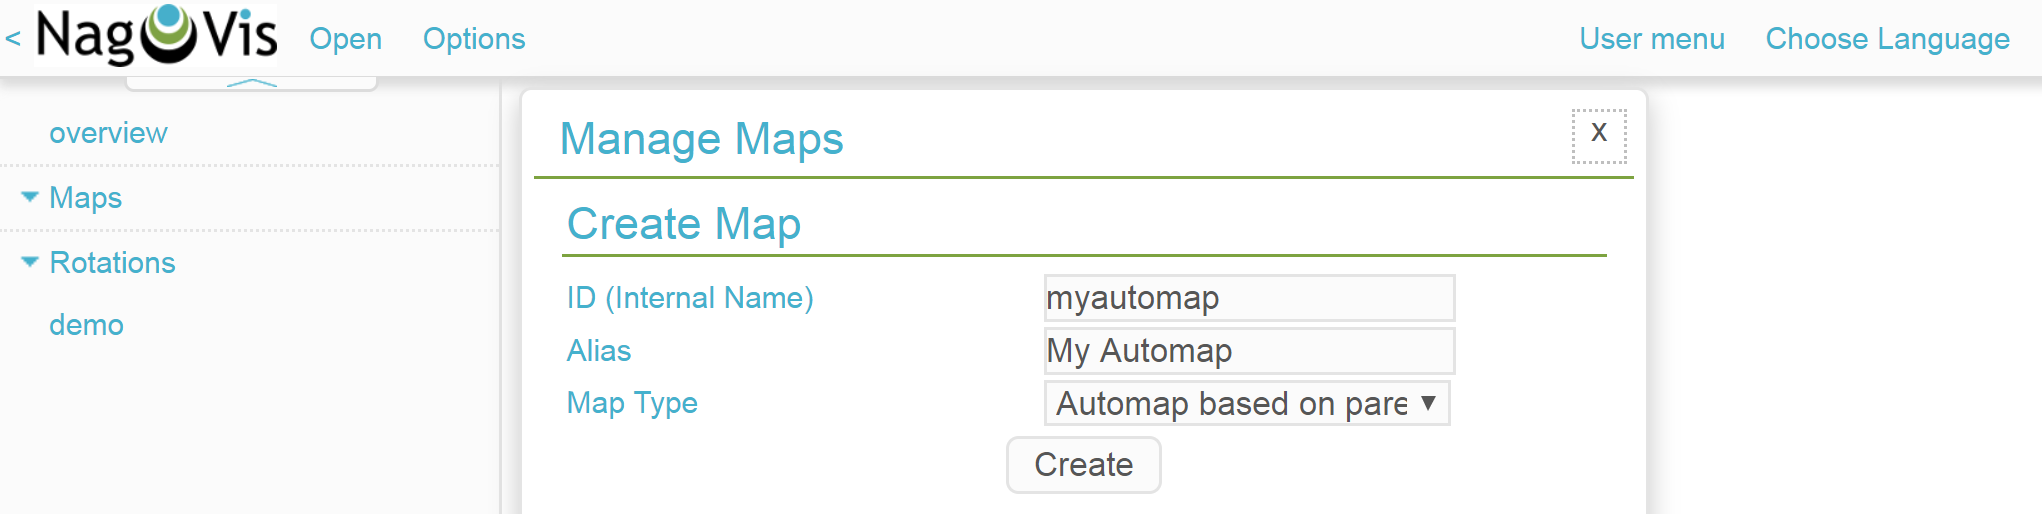
The quickest facility for generating a representative map is the Parent-Child-Automap. Create a new map of the Automap based on parent/child relations type via Options > Manage Maps > Create Map. In ID enter the internal name myautomap, and in Alias your name for the display My Automap.
The map itself will immediately appear in the Content Area, and its corresponding link will appear in the NagVis maps snapin. Automap-specific settings can next be customised in Edit Map > Map Options > Automap. The point render_mode is particularly interesting as it provides the fundamental layout of the nodes on the map.
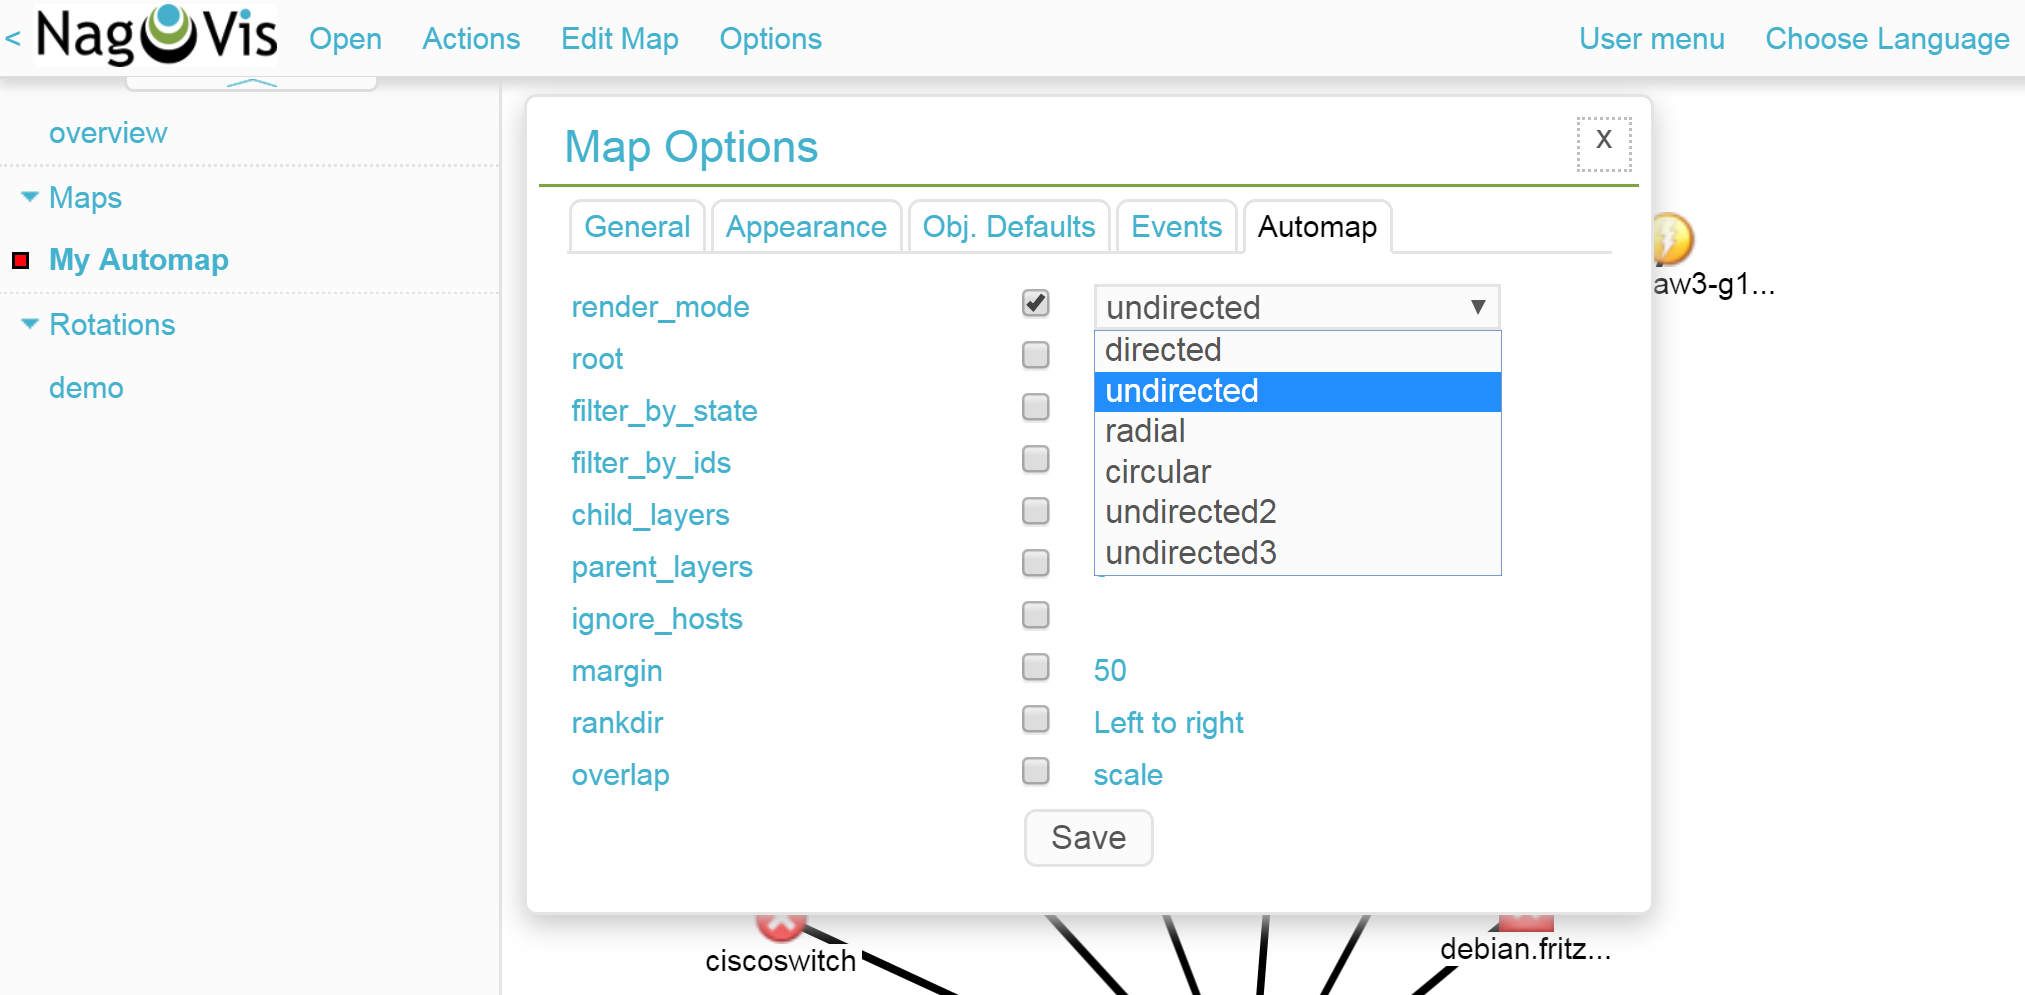
In addition the roots of the map can be specified here – although that is simpler to achieve with a right-mouseclick on an icon on the map, and then making an entry in the Make root context-menu.
3.3. Creating a regular map
Regular Maps are the commonest maps in NagVis. So that you can to get to know NagVis' procedures and its most important elements, we will show you how to create a small map of a server-rack. This will visualise a host on an individual background, and provide optical and acoustic warnings when the monitored host is not OK.
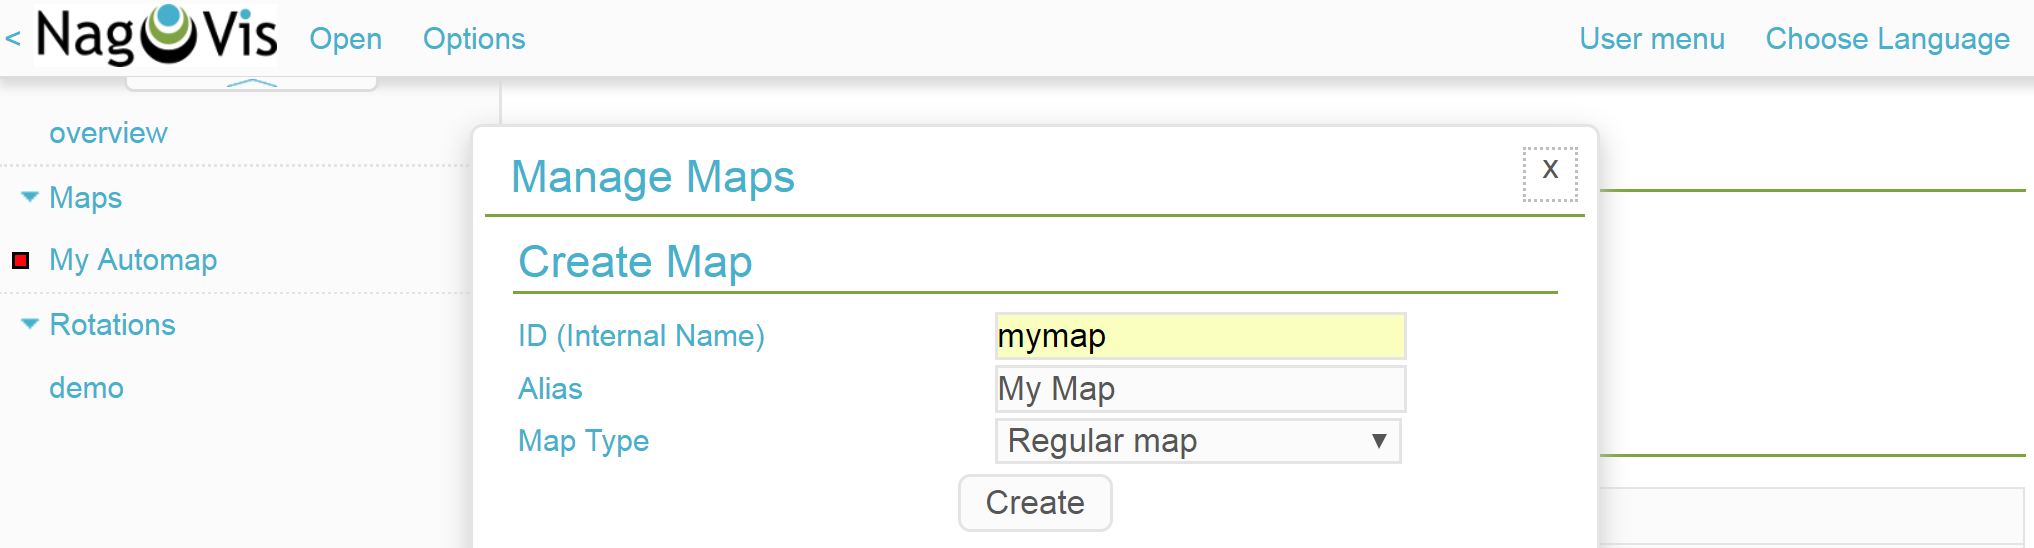
To create the map open the options via Options > Manage Maps. Here in Create Map give the map the name mymap and the alias My Map. For the Map Type select Regular map and verify it with Create button.
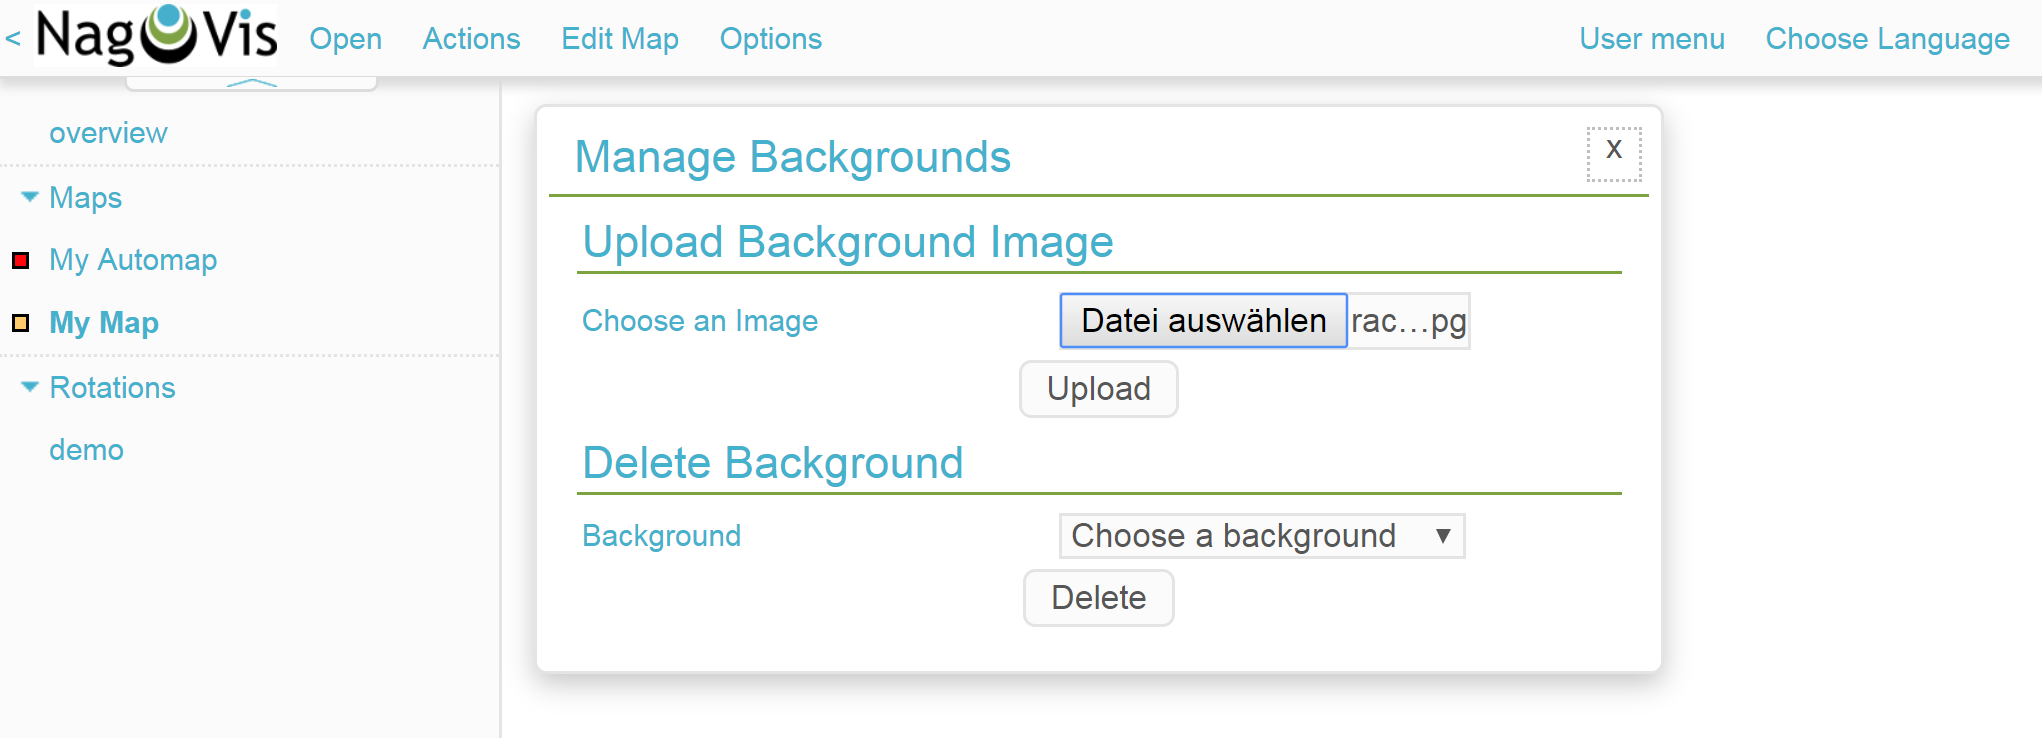
Next import a photo of the rack being monitored as the background – this is achieved using Options > Manage Backgrounds. Simply select the local file and verify it with the Upload button.
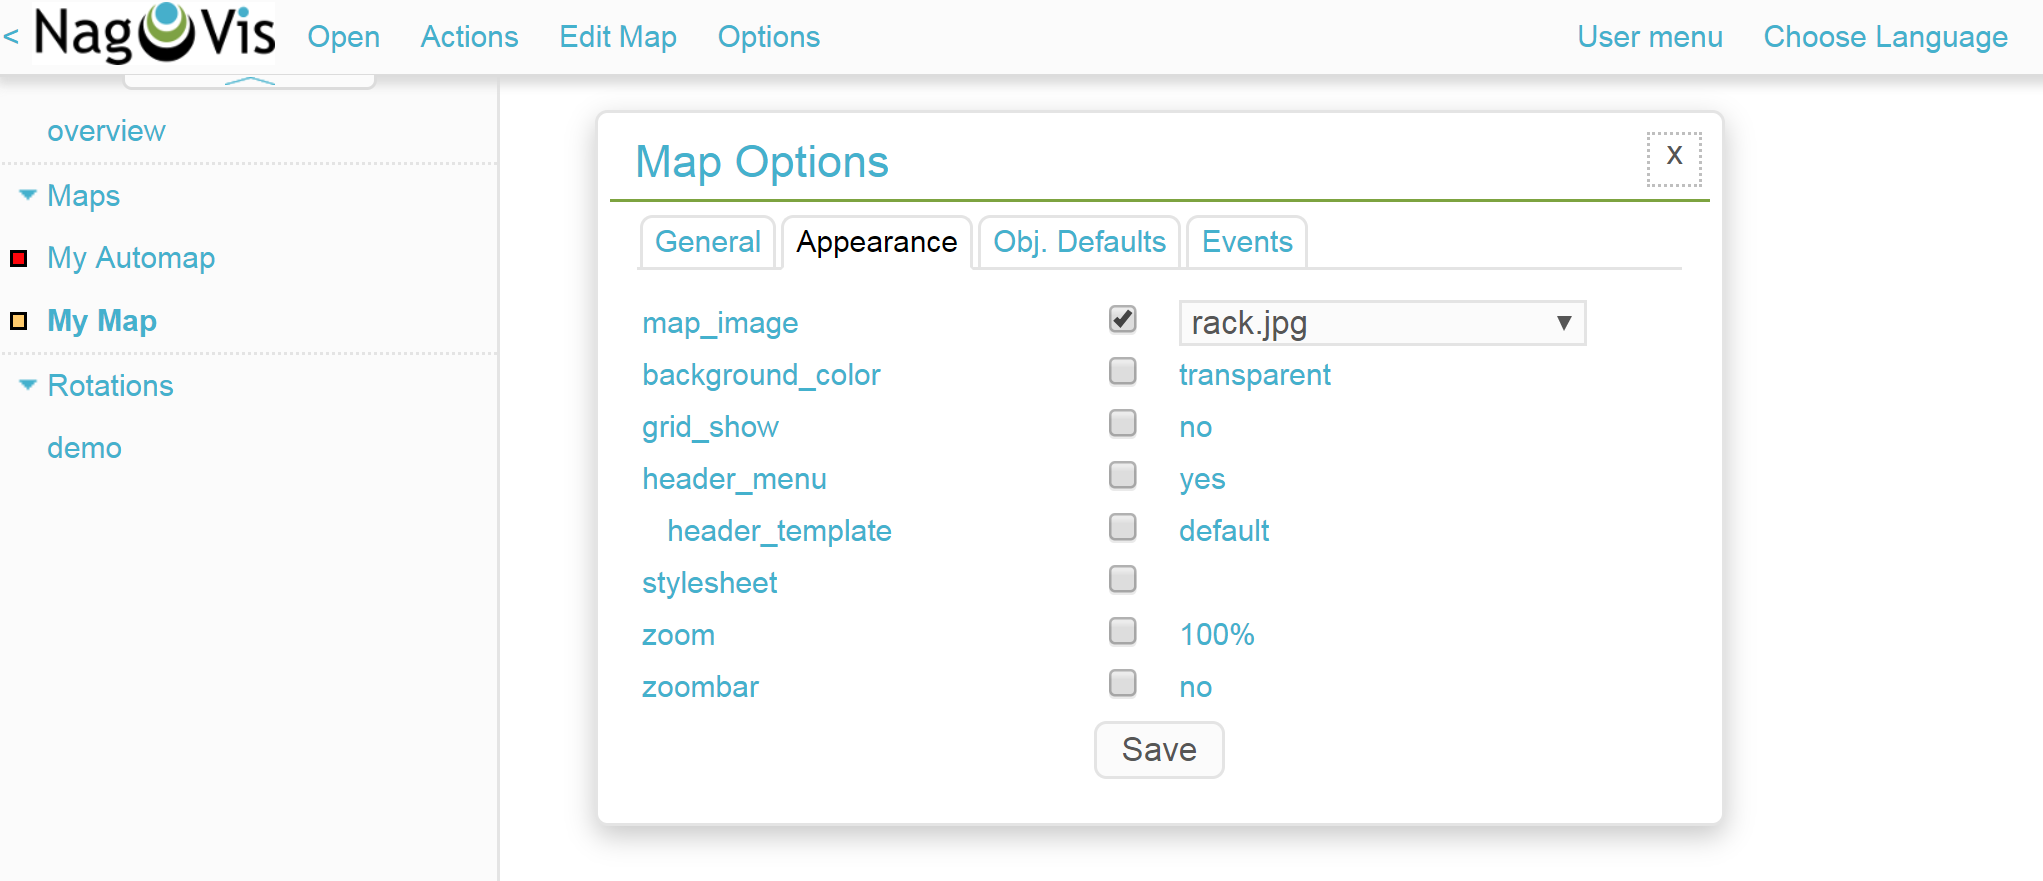
Now the imported image must be defined as the background for the current map. Call up the map options with Edit Map > Map Options and go to the Appearance tab. Here activate the map_image option and select the desired image from the dropdown-menu. Don’t save that right now – a setting from the maps options is still needed.
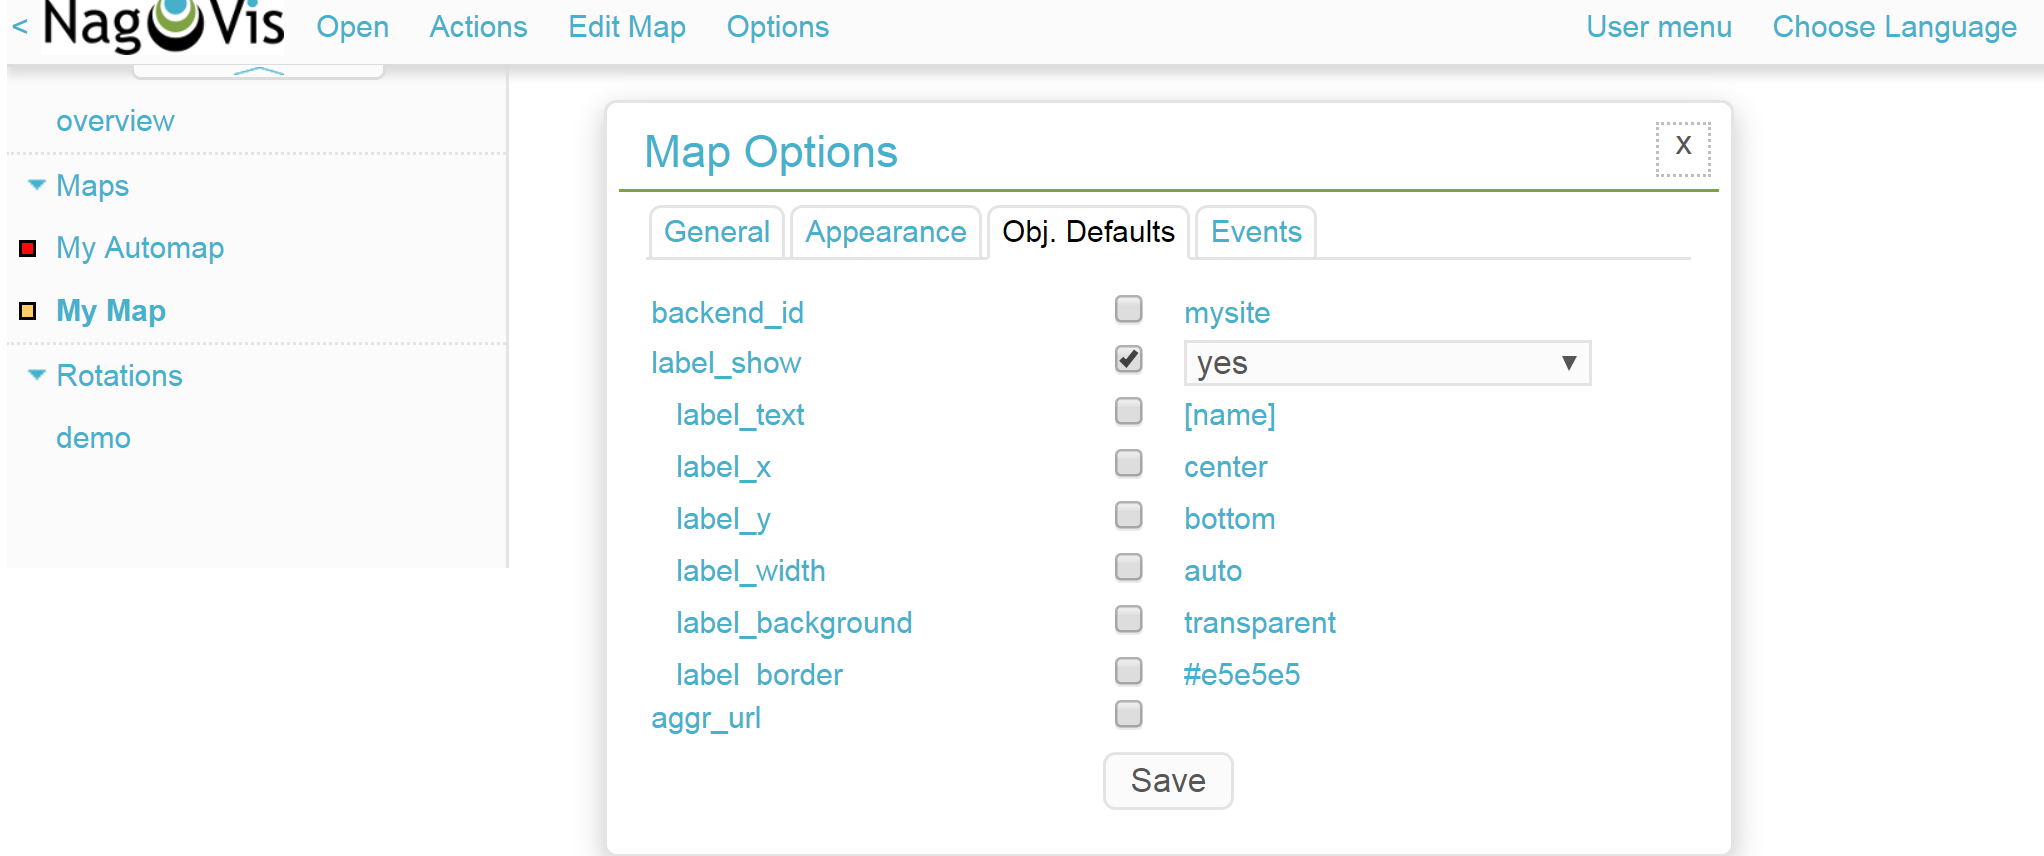
Go to the Obj. Defaults tab. Here you can activate the label_show option. This option enables the host and service icons on the map to be labelled with their appropriate host/service names – otherwise the icons will only be identified via their hover-menus. Finally, save these settings.
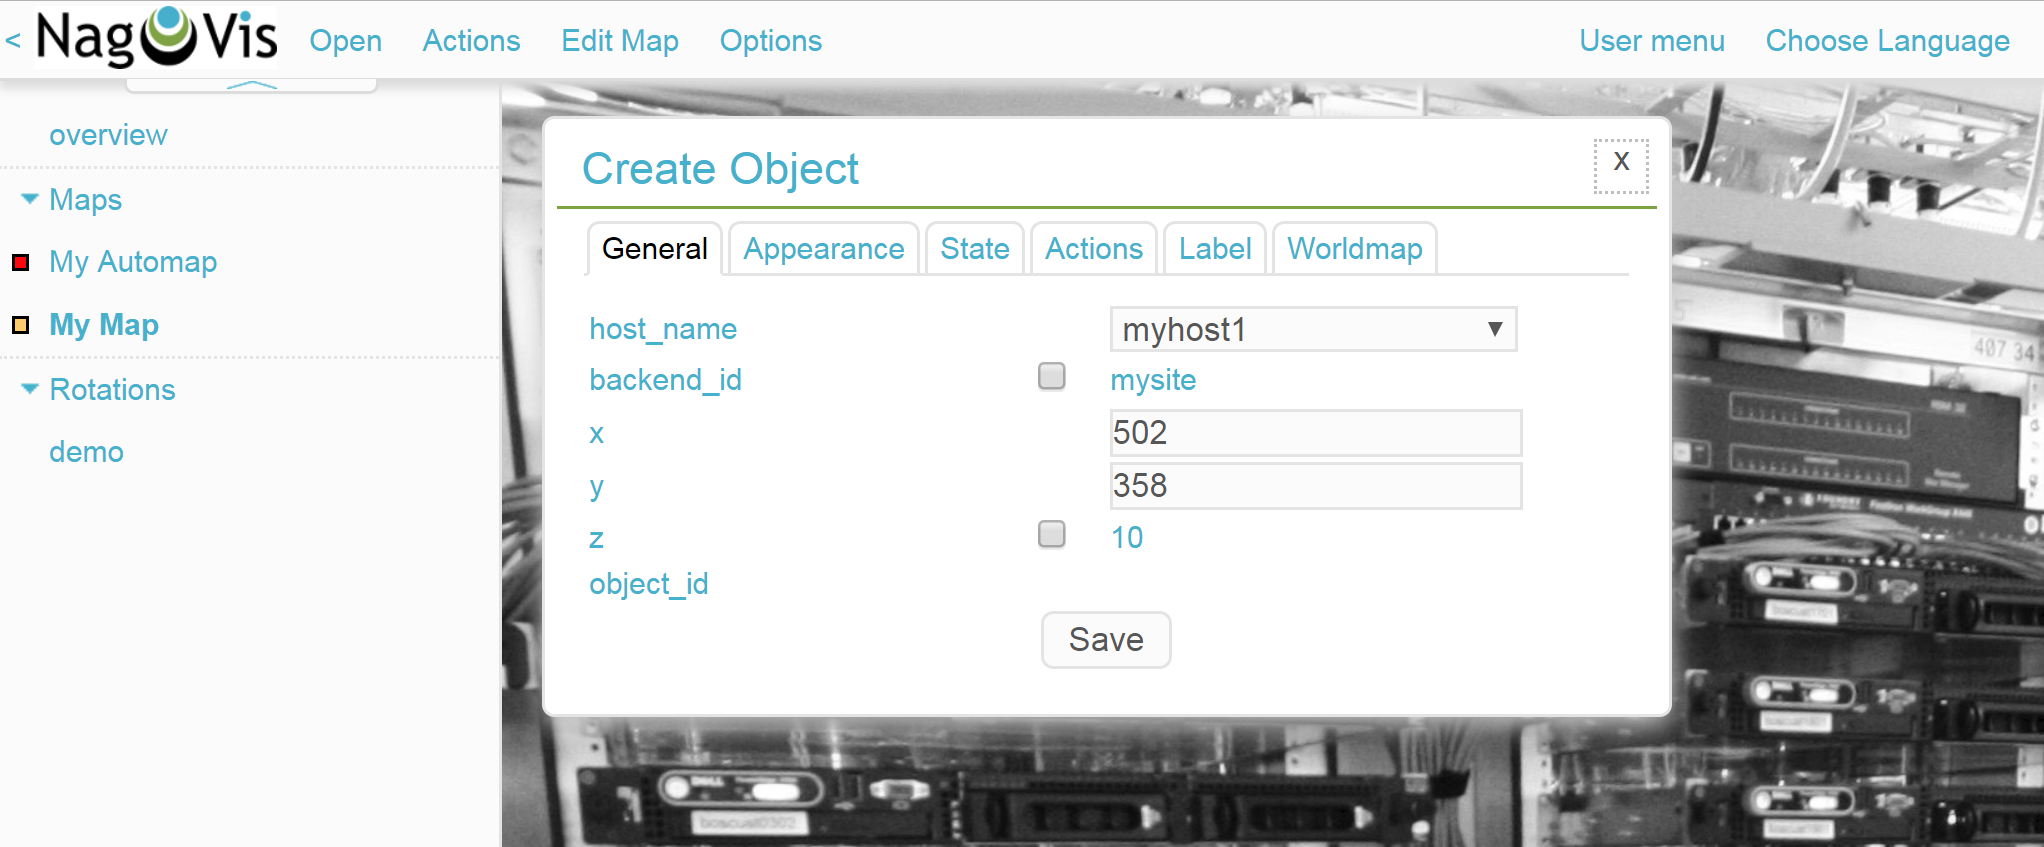
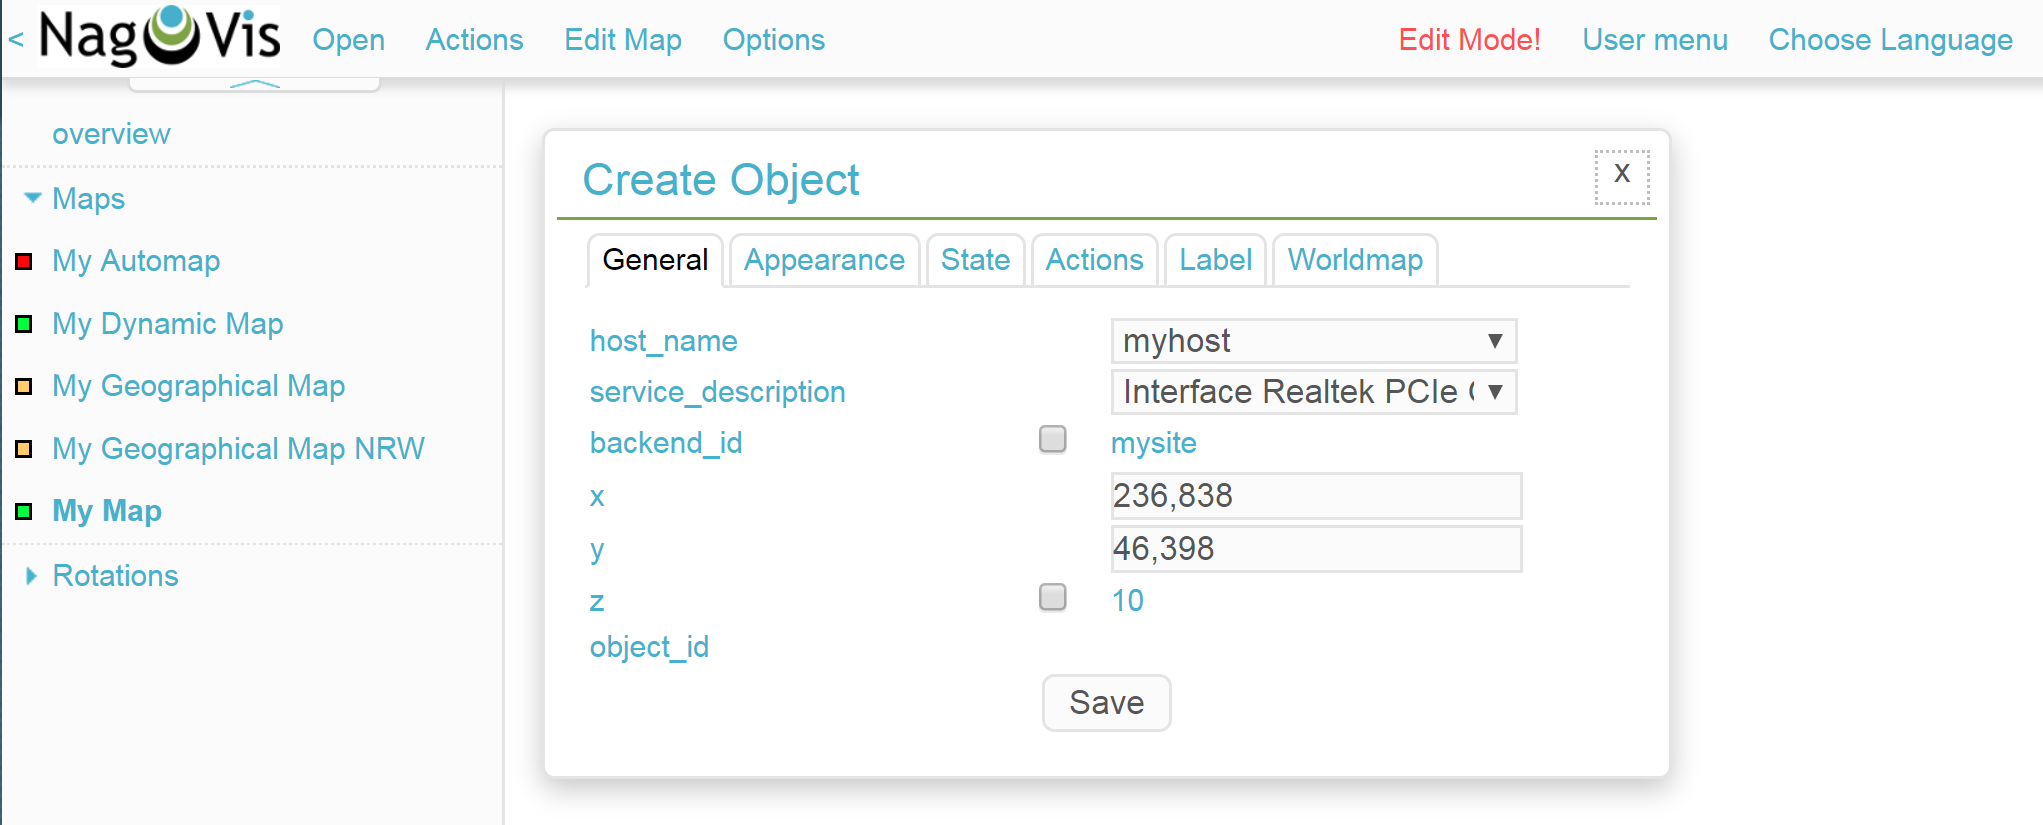
Now it is time to add the host. Click on Edit Map > Add Icon > host and then with the curser (which now appears as a cross) at the position on the map where the icon is to be placed – at this point the Create Object-dialogue will open. In the General tab simply select the desired host from the dropdown-menu in host_name and save. If you operate multiple Checkmk sites, an alternative data source can be used via backend_id.
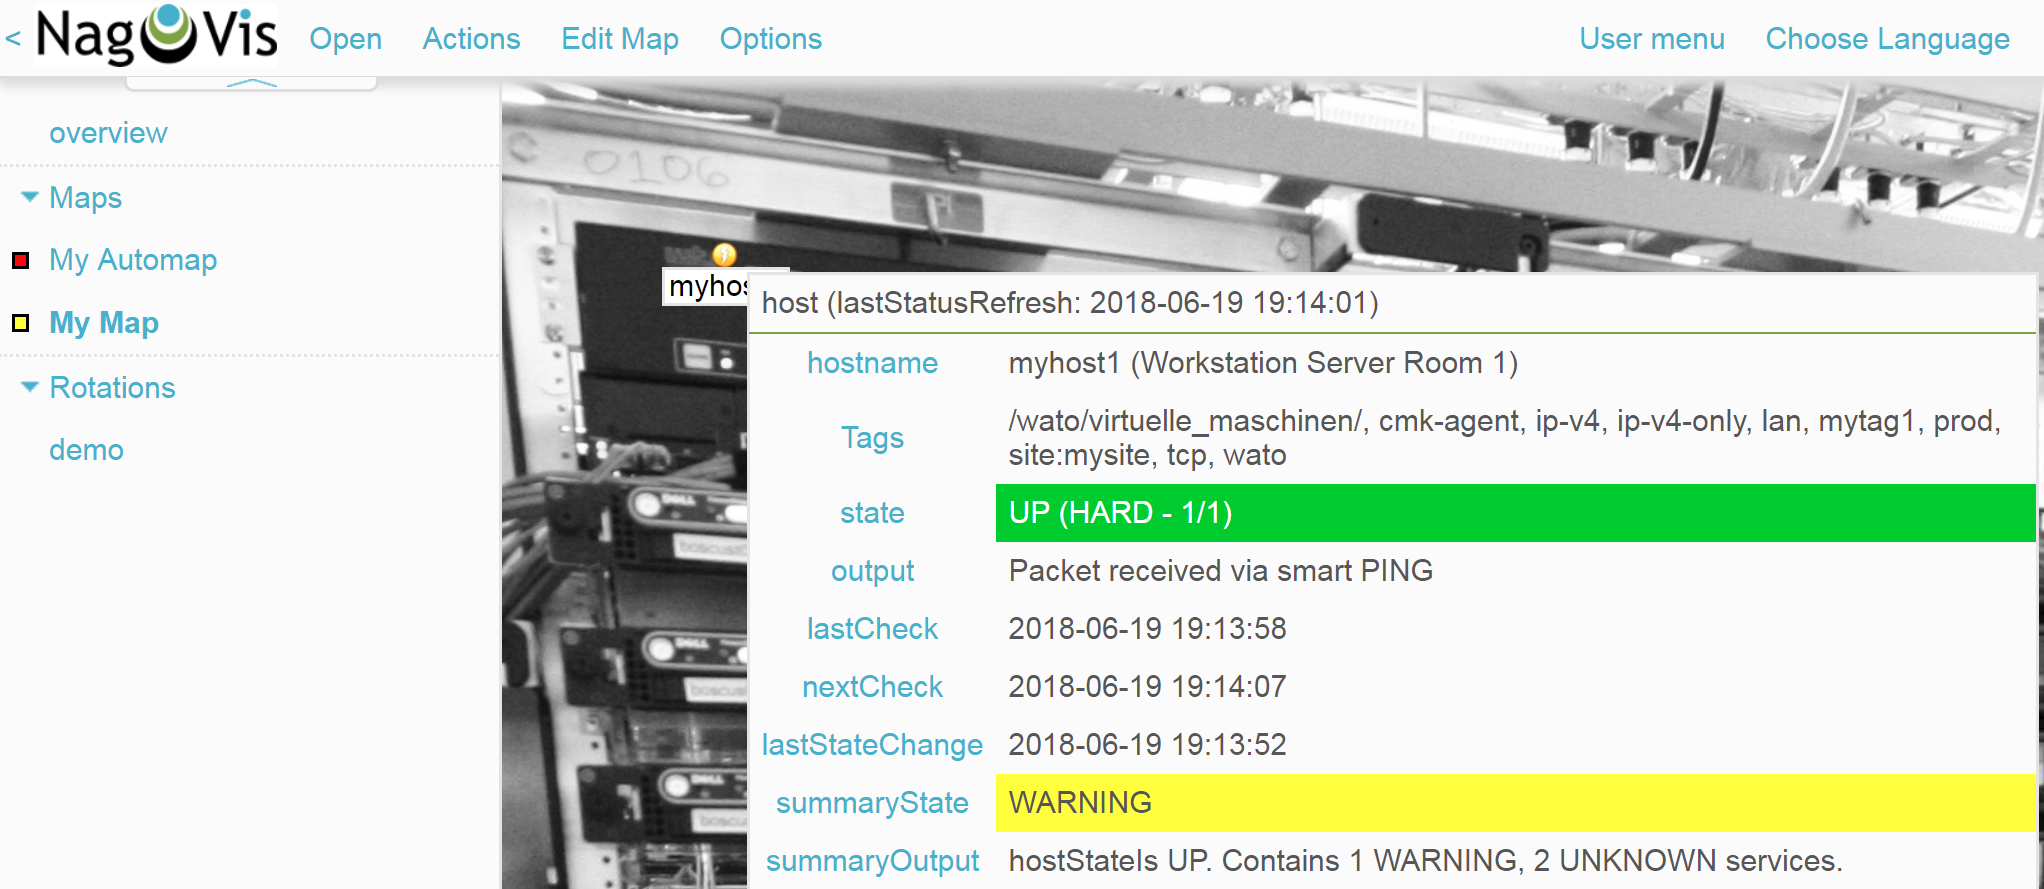
The icon is now positioned on the map, and it provides detailed information via a hover-menu. Clicking on the icon takes you directly to the host in Checkmk – all of the objects positioned in NagVis are now links to your Checkmk objects.
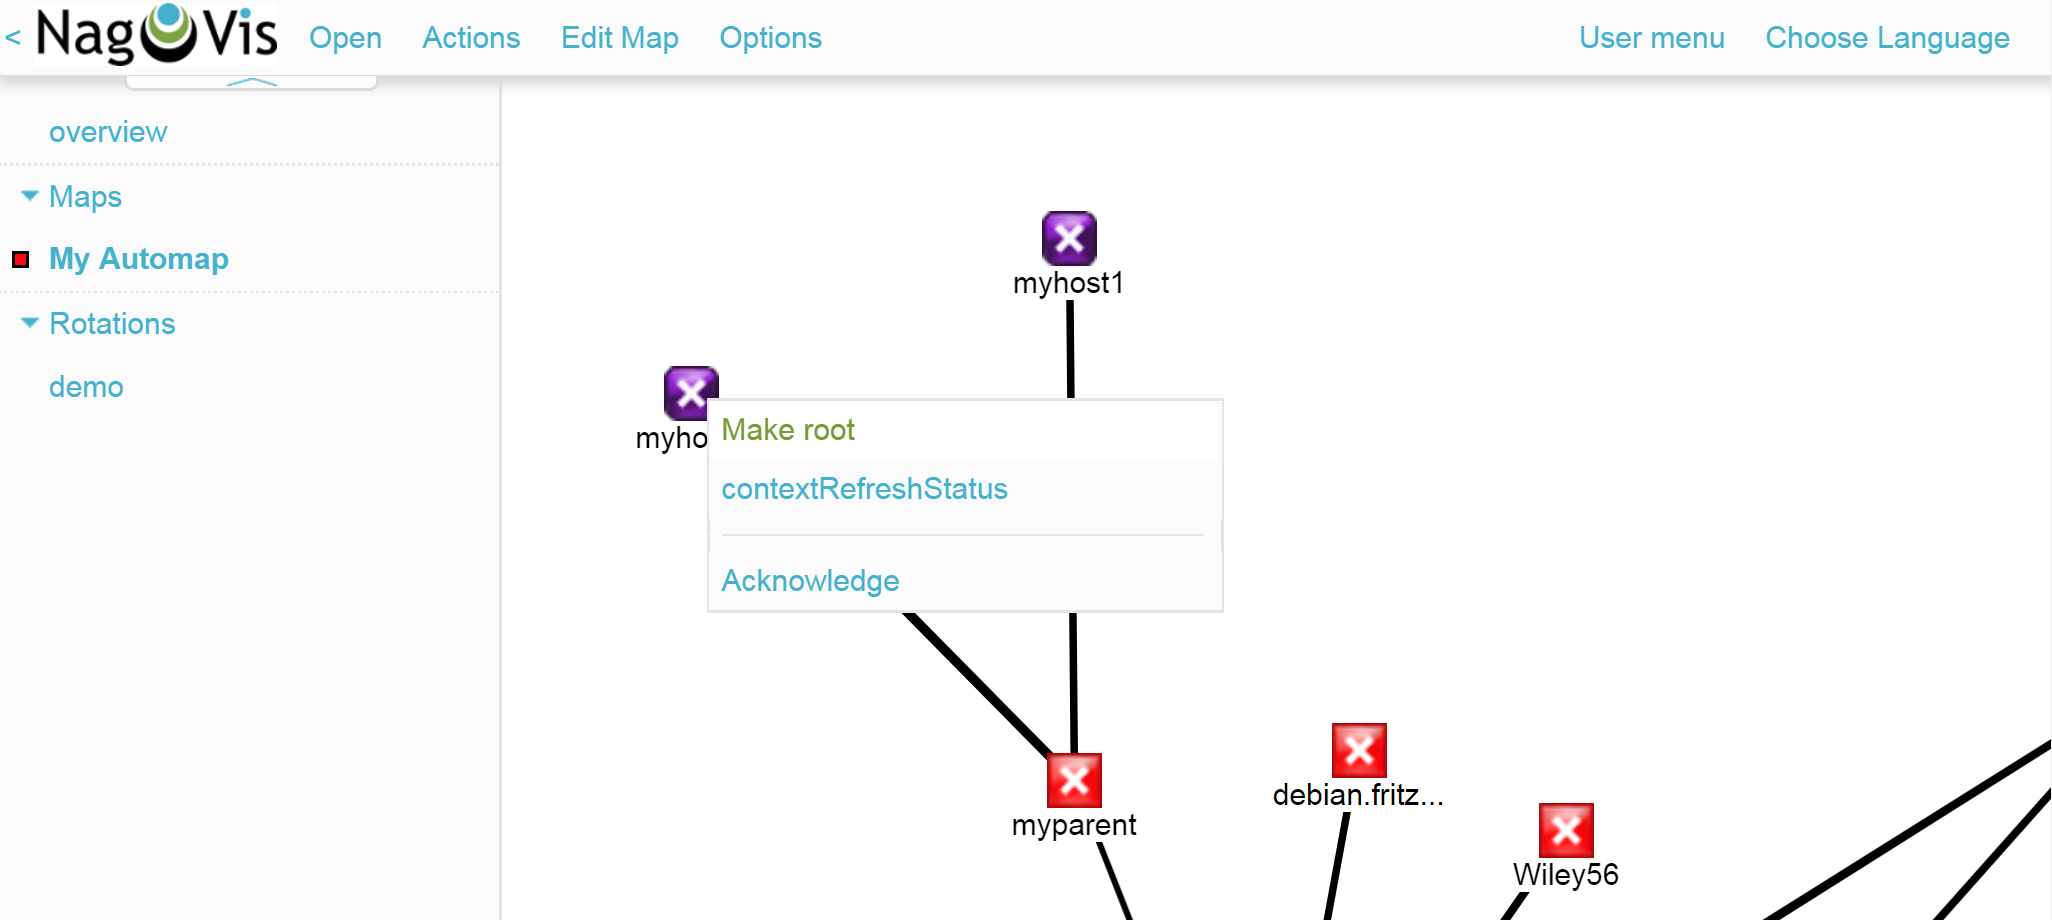
The edit mode needs to be activated to be able to move or edit an icon. Right-click on the icon to open its context menu, and select Unlock.
Now you can move the icon, or again open the context menu: Here a number of new options will be seen which will enable the object to be cloned, deleted or edited, or to acknowledge a problem directly from here by choosing the Acknowledge option. See acknowledge.
Once the editing of a host/icon is complete, again open its context menu and select Lock. By the way, with Edit Map > Lock/Unlock all the editing mode can also be activated and deactivated for the complete map.
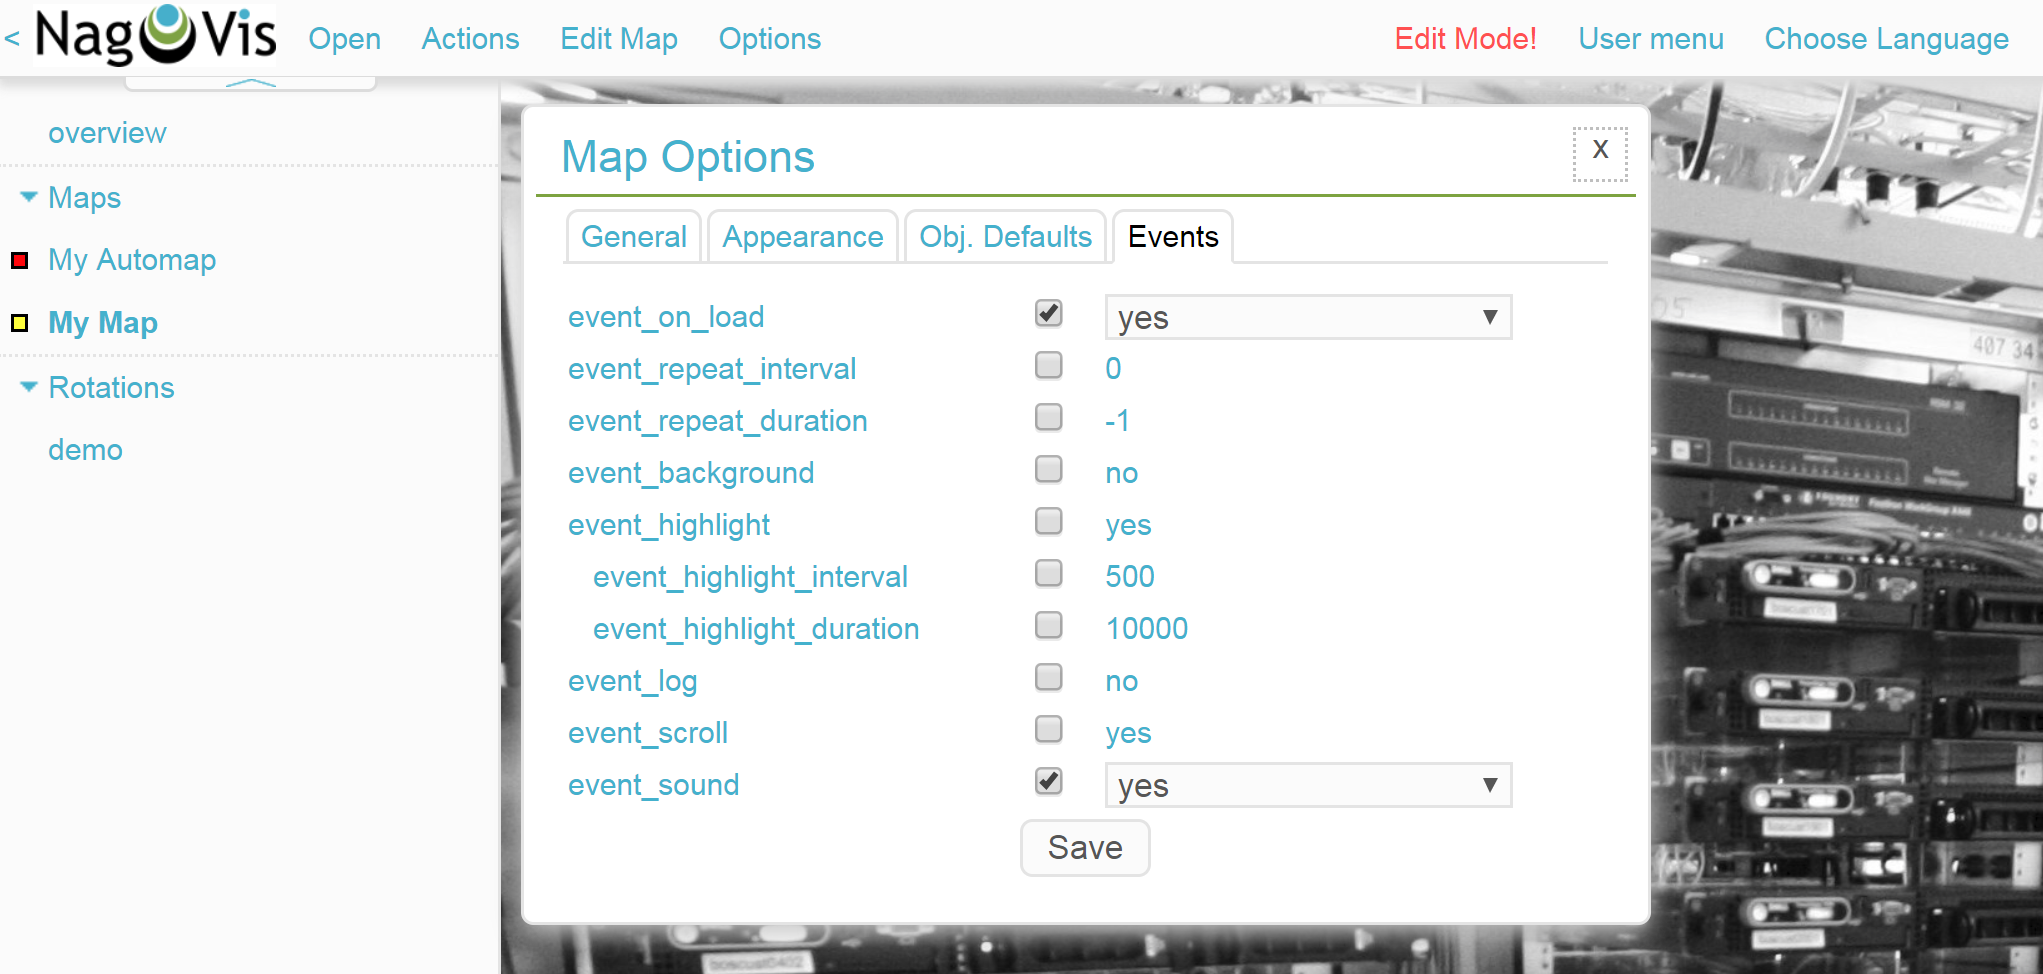
You can now add further hosts to the map. Adding services, host and service groups functions in a similar way. To round things off, the map can be so configured that when loading, problems will be signalled by a warning sound and blinking host icons. For this, call up Edit Map > Map Options and switch to the Events tab. Here, at the top of the display, activate event_on_load, and at the bottom check the event_sound box to receive audible warnings.
3.4. Creating a geographical map
Geographical maps are available in two different forms: The interactive variant can be scrolled and zoomed in the way we know from Google Maps & Co., and its background is set automatically. Objects that have been placed on such maps will appear on every subsequent map of the same type. NagVis assumes that an object will always be found at a specific location regardless of the scale of the map. So for example, a host located in Hamburg will appear on a world map as well as on a map of Germany and of course on a map of Hamburg.
NagVis ultimately views the various map sections and zoom-levels only as Viewports. At any time viewports can be saved as a separate, new map. Since viewports/maps can likewise be diplayed as icons on maps, to some extent maps can be nested. So for example, a map of Germany with its dependencies can be called-up, and then with a click a more detailed view of a state, and then as needed maps for a specific subsidiary, server room, and from there even to a map for an individual switch.
In contrast to manual navigation, using an interactive map is quicker and more convenient, and as well the individual maps are active so that for example, they can be displayed in parallel on separate monitors, or set for automatic rotation on a single monitor (more on this later). Also important: in this way a summary of the related maps is thus available as a hover-menu. This also makes using them more intuitive for third parties since they don’t have to click through hierarchies, or need to know where zooming is necessary.
The non-interactive geographical maps must be fed with a CSV-file containing the hosts and coordinates to be rendered. There are no general pre-existing elements in this case.
In the documentation the interactive geographical maps are called Worldmaps, and the non-interactive variants are called Geomaps. Worldmaps were first added to the current 1.9 version of NagVis, and until now only explained in the English documentation.
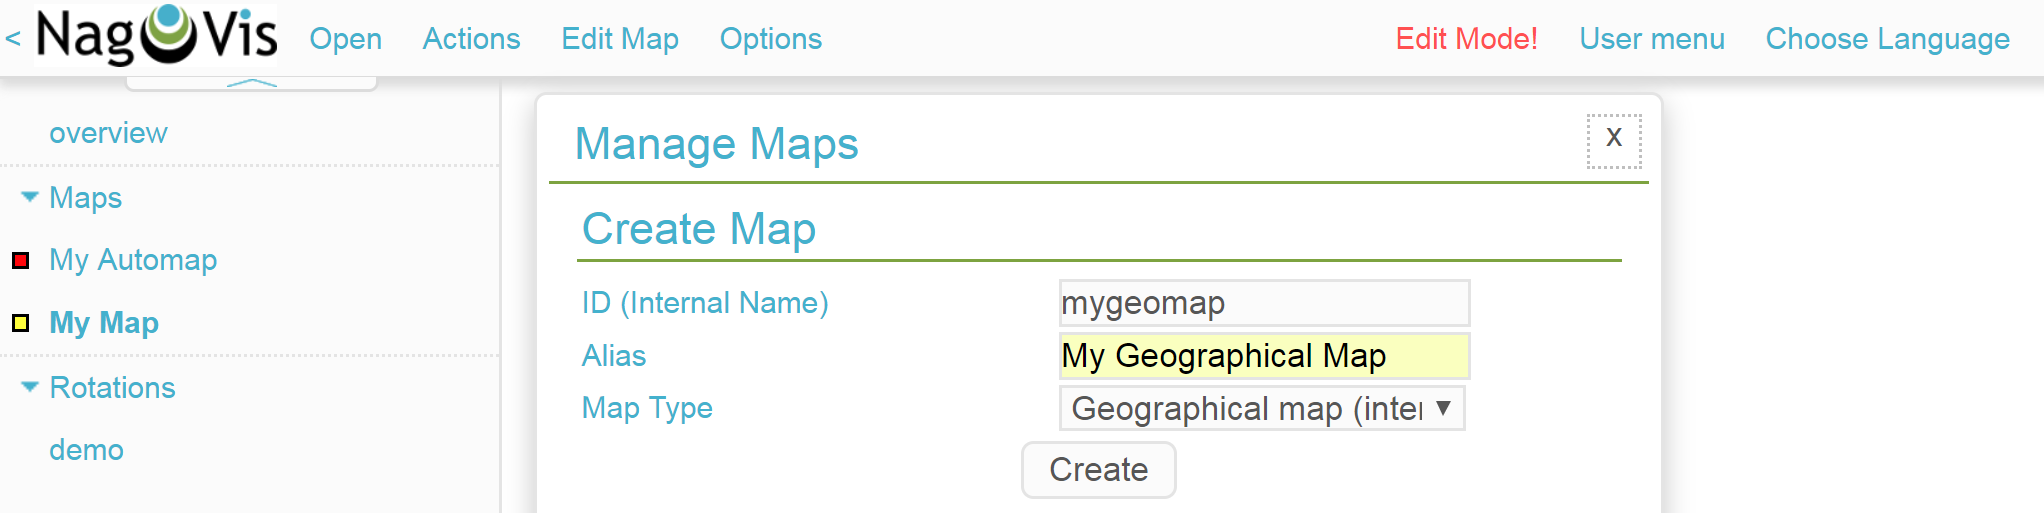
Example: create an interactive map for all of Germany, and to this link a new viewport for Nordrhein-Westfalen. Create an interactive geographical map – a Worldmap – with Options > Manage Maps > Create Map. As Map Type select the Geographical Map (interactive) option – the ID (mygeomap) and Alias (My Geographical Map) can also be defined here.
To finish, specify the map section which is desired as the overview, and save this view using Edit Map > Viewport > Save view.
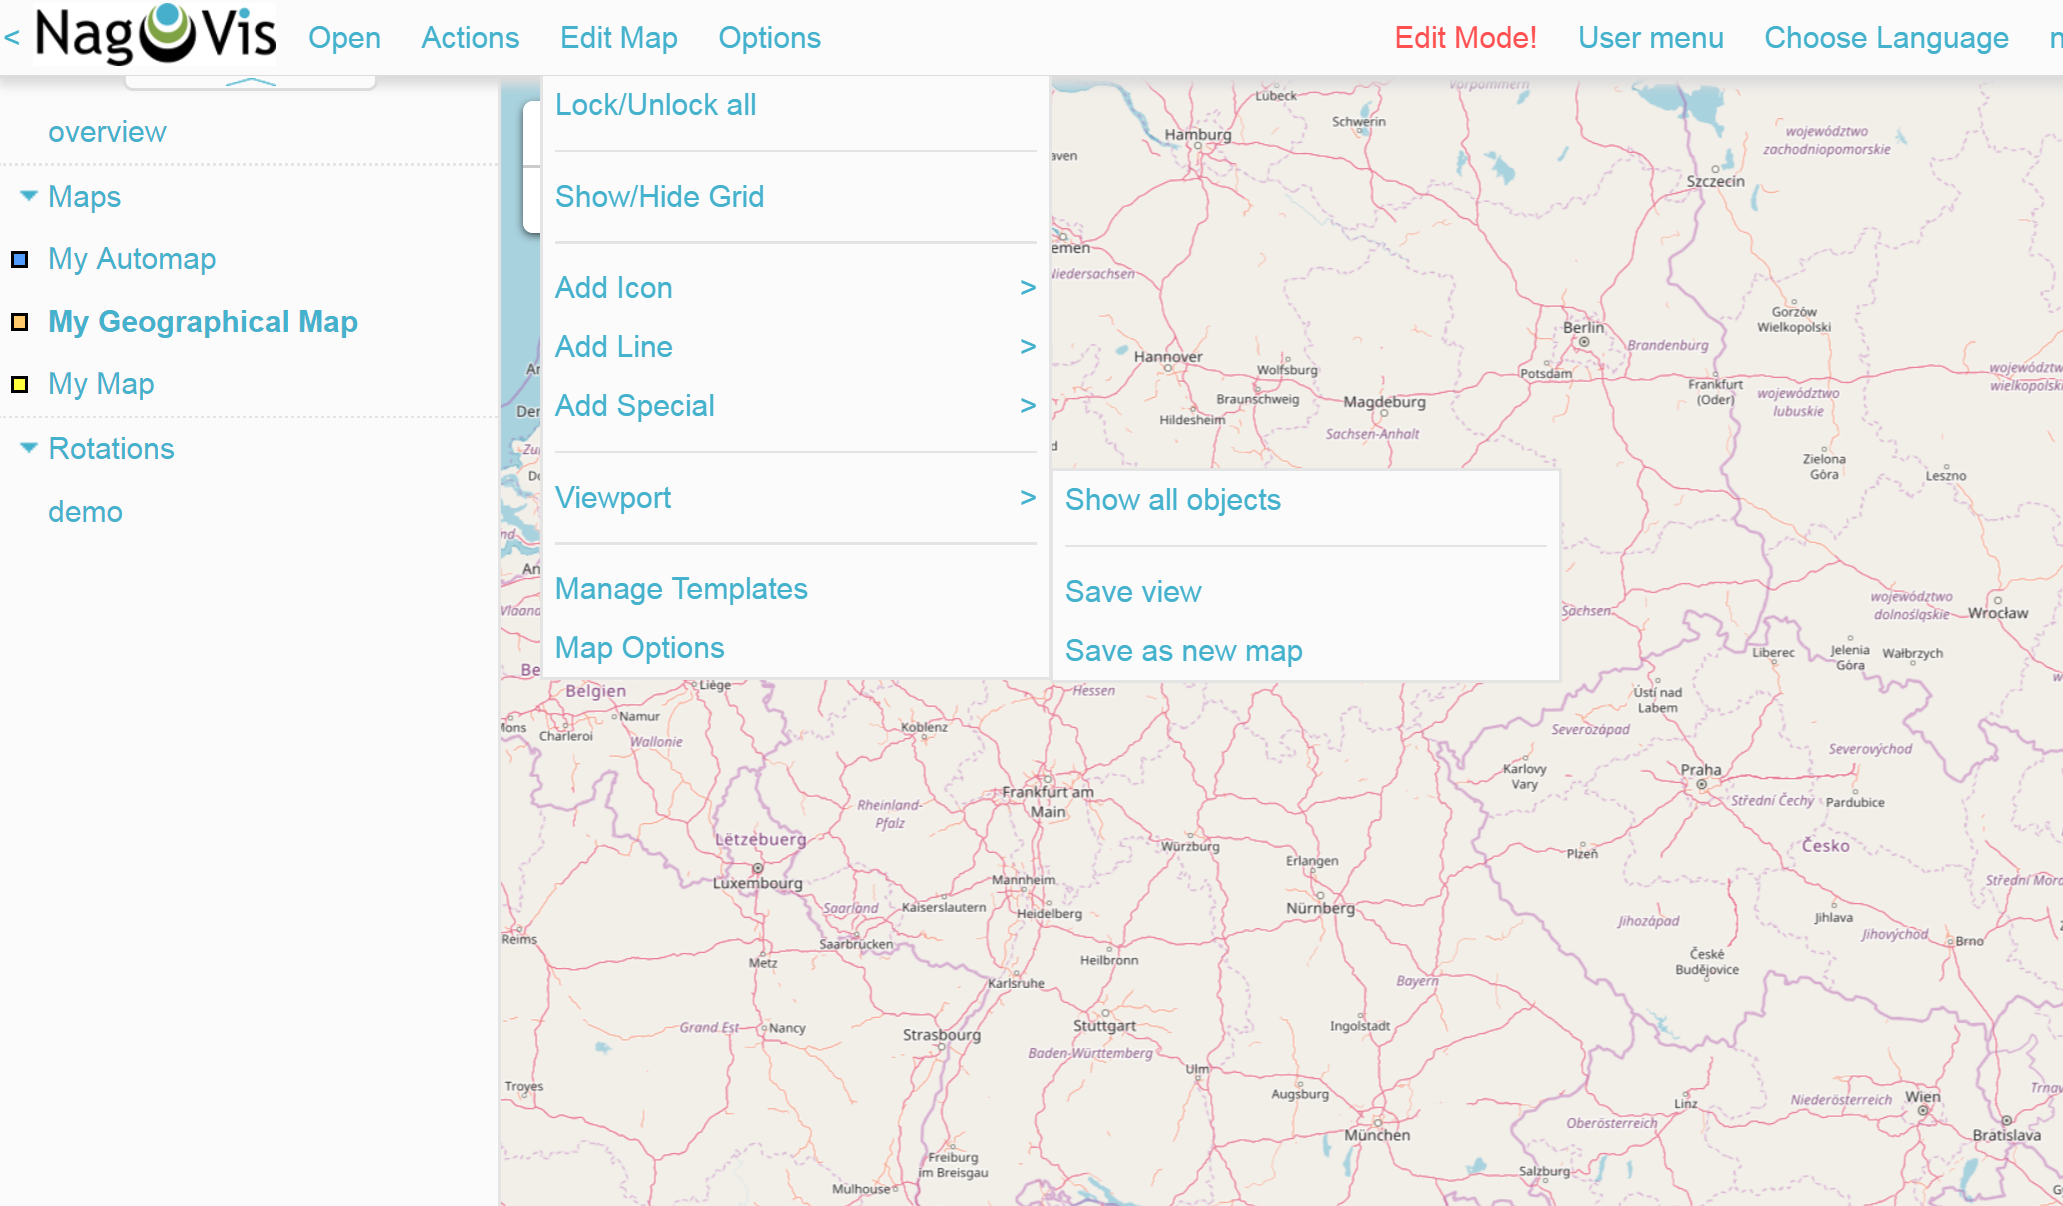
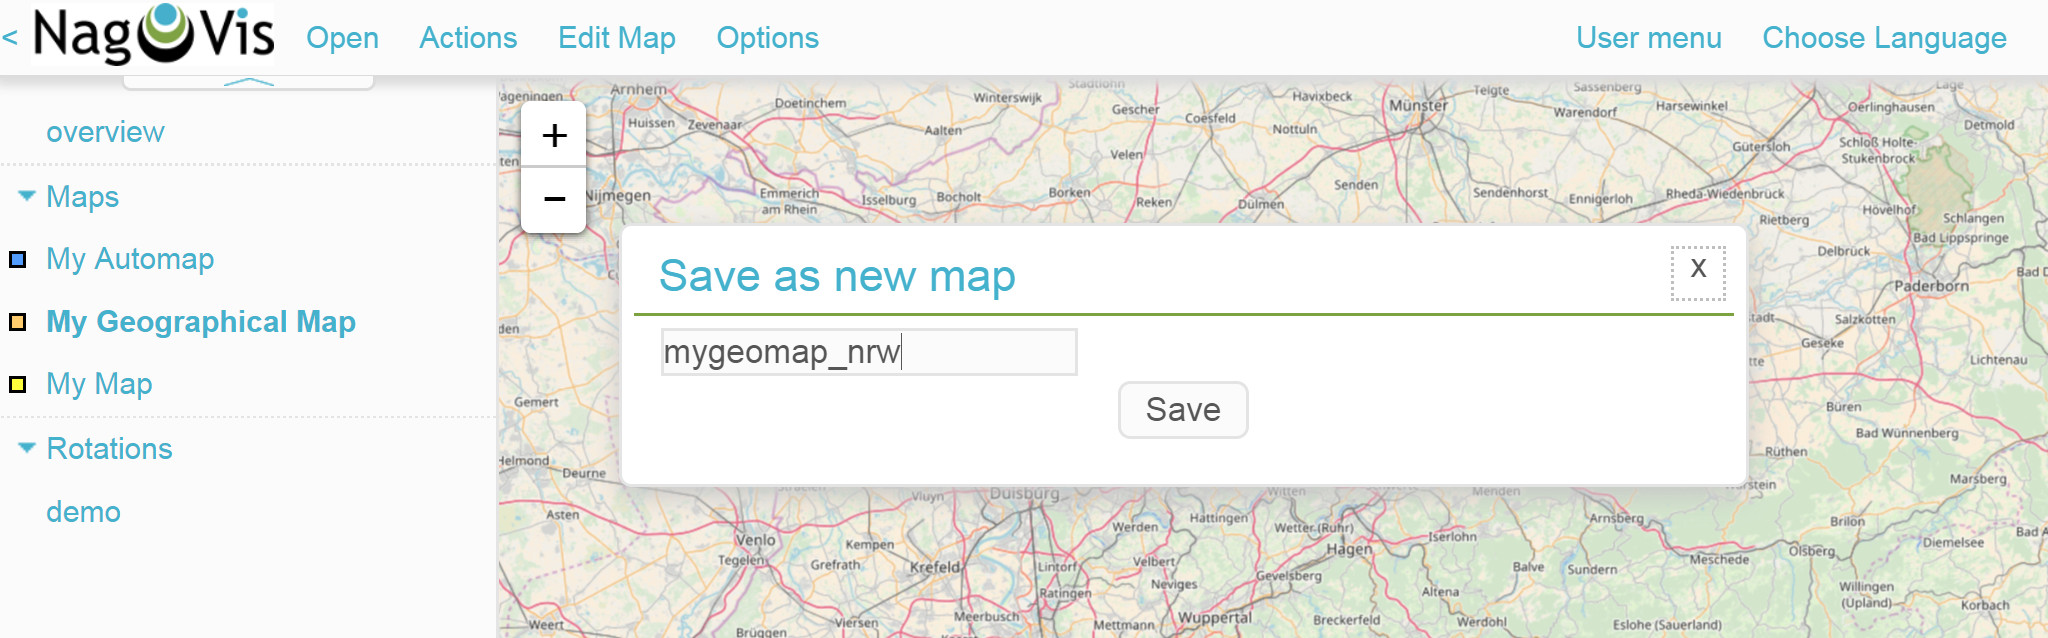
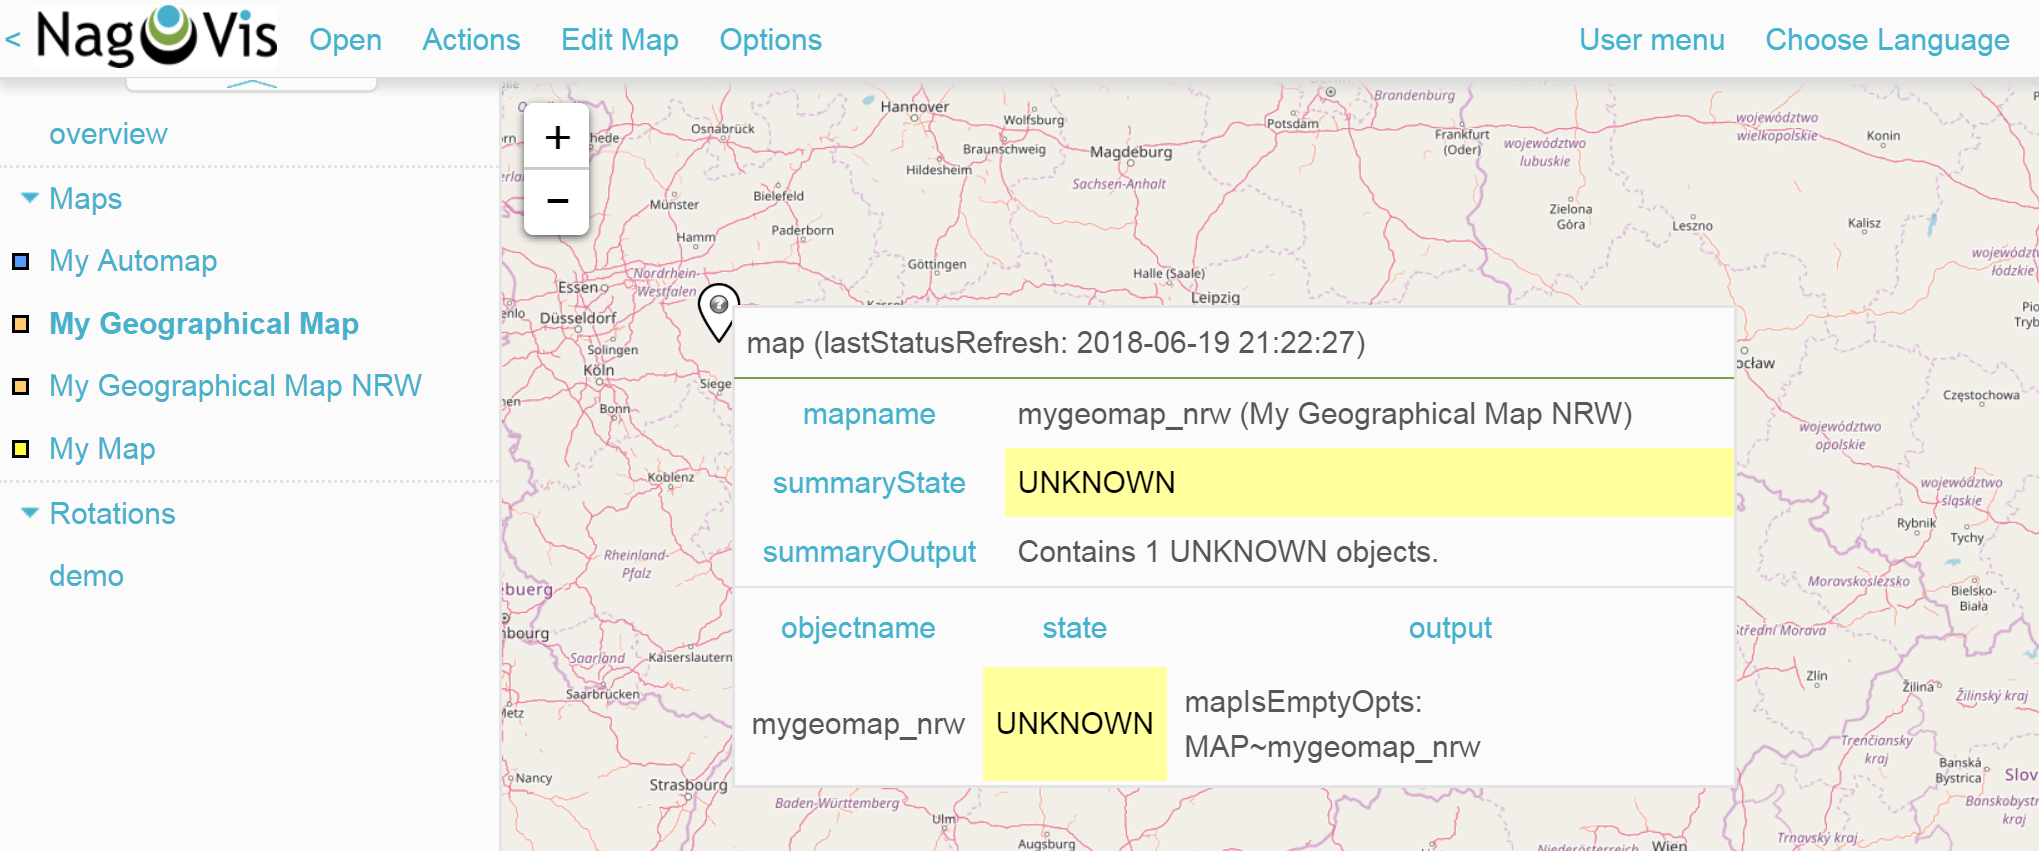
Next zoom into the map until the desired detail for NRW is reached. This time save the view with Map > Viewport > Save as new map as the new map mygeomap_nrw.
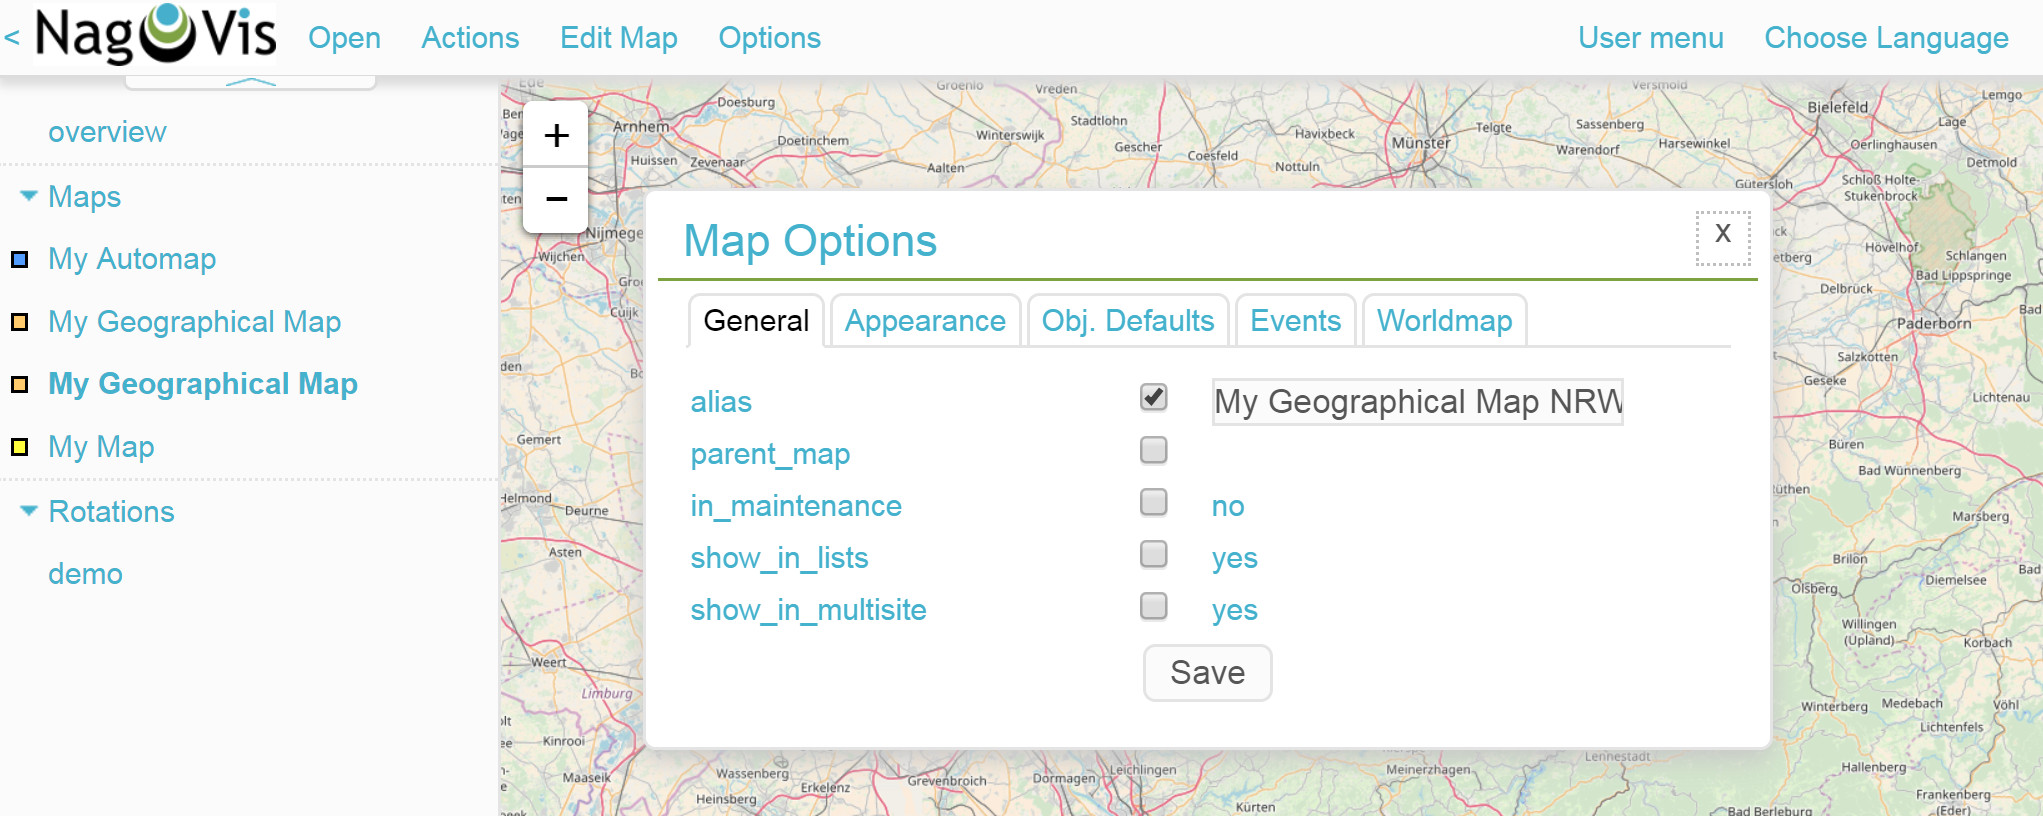
The map’s alias will be adopted from the original map so that links in the navigation will now have two map names My Geographical Map. Therefore now define a new alias NRW with Edit Map > Map Options.
Switch to the map of Germany My Geographical Map and add the link to the NRW-map with Edit Map > Add Icon > Map. In the subsequent Create Object-dialogue you only need to specify the mygeomap_nrw map from the selection menu.
Afterwards a click on the new icon in the map of Germany takes you directly to the NRW map. In the same way additional maps can be linked together, and of course a navigation from the NRW map back to the map of Germany can also be built-in.
The actual loading of the map contents also corresponds with the procedure for the other map types. But remember – all objects added to ANY of the 'Worldmaps' will also appear on EVERY other 'Worldmap' since they are really only alternative views of the real geographic situation.
3.5. Creating a dynamic map
Dynamic maps differ from the Regular Maps – as mentioned earlier – in the method of adding their elements. Instead of manual additions the Dynamic Maps receive their elements – hosts, services, and likewise host and service groups – dynamically via Livestatus filters.
As an example, a map should automatically receive the CPU load-services from all hosts.
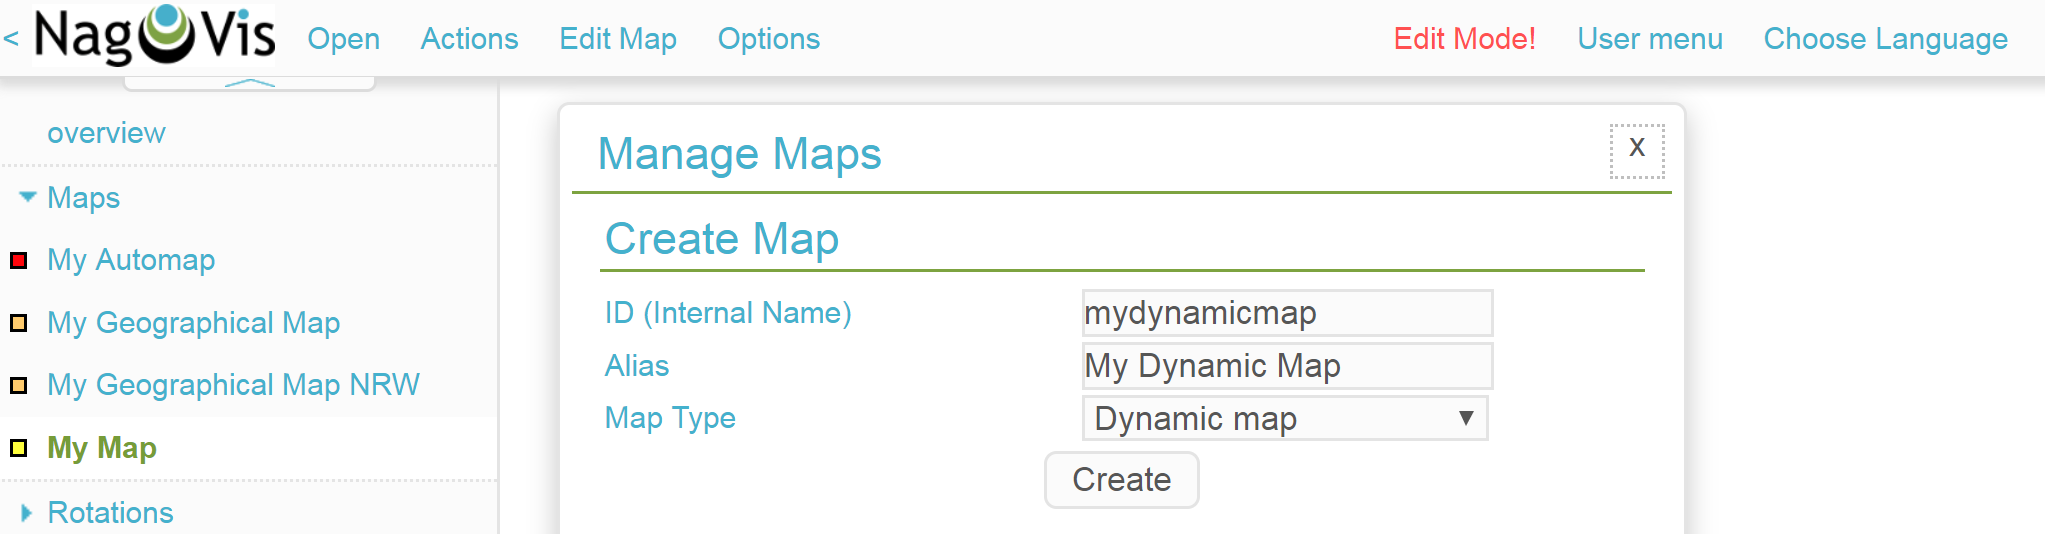
To create such a map, again begin with Options > Manage Maps > Create Map, and allocate an ID (mydynamicmap) and alias (My Dynamic Map).
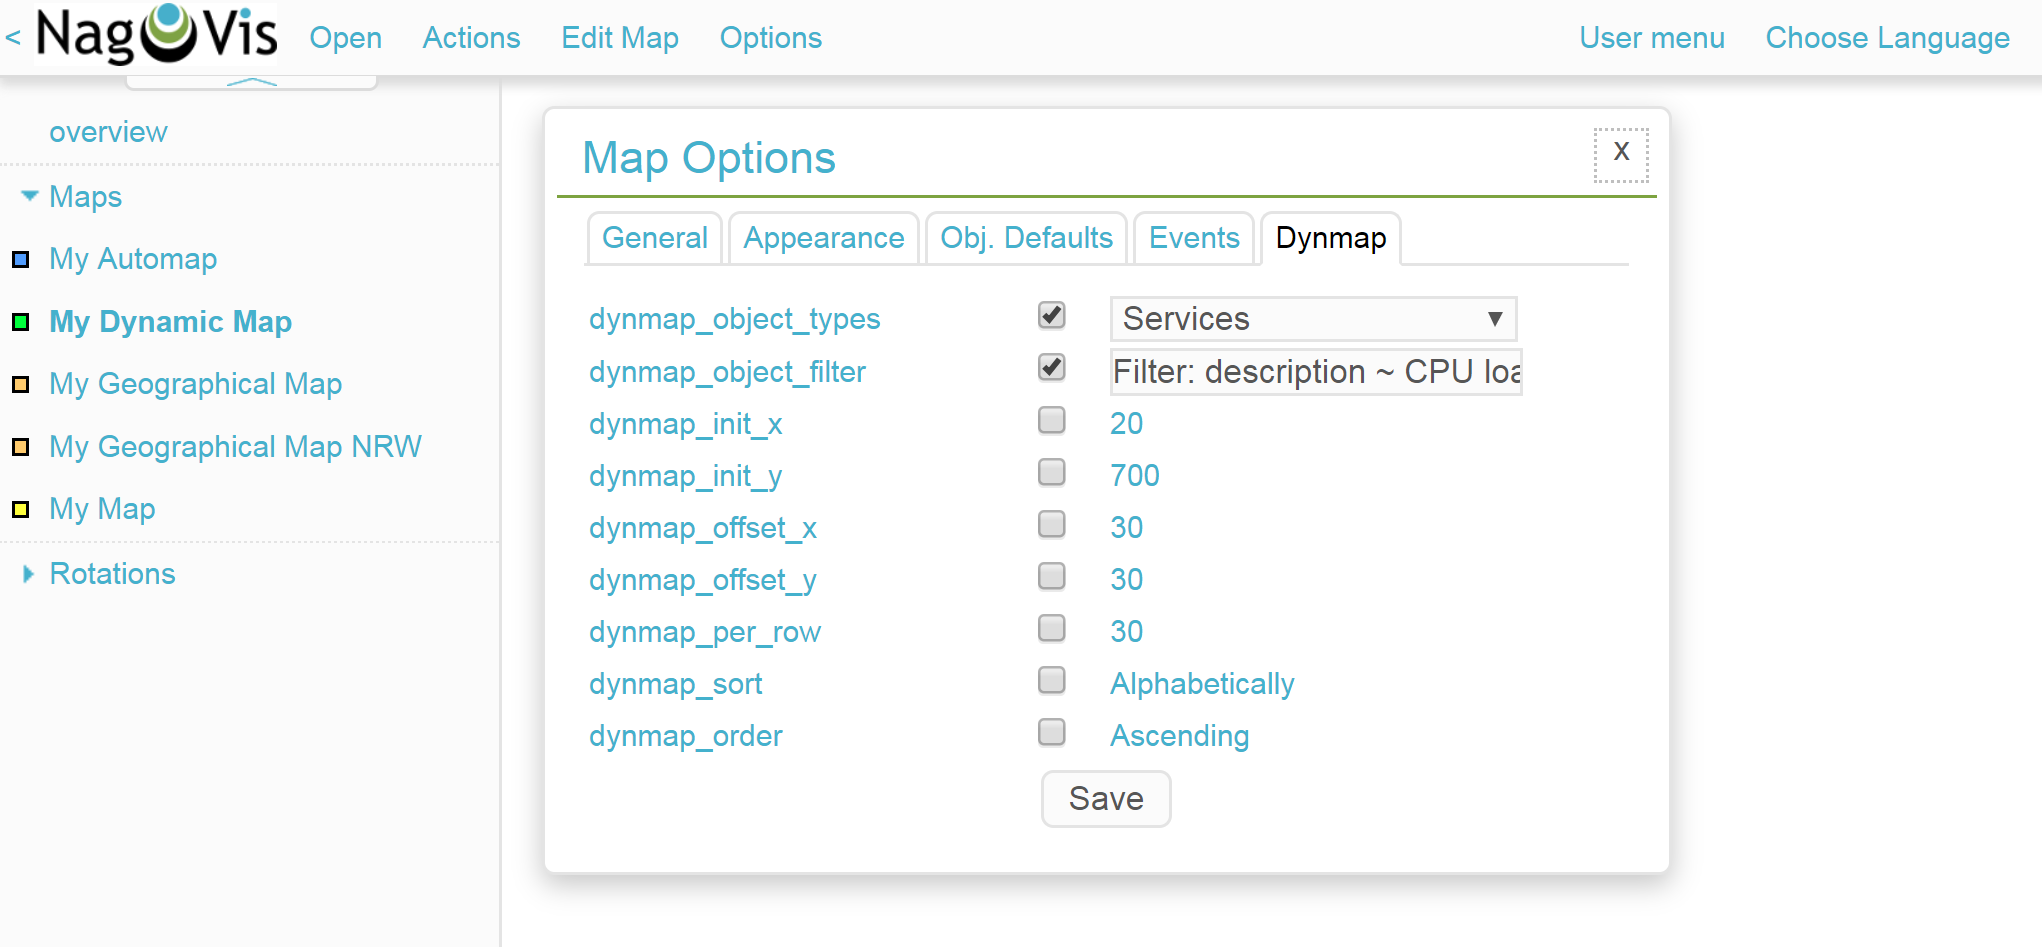
Next open the map options with Edit Map > Map Options and select the Dynmap tab. Here activate the dynmap_object_types option and choose the services as the object type.
The interesting part now follows with the second option dynmap_object_filter, with which the filter for the services is defined. Use the simple Livestatus query Filter: description ~ CPU load\n. With this the string CPU load will be searched for in the description column. This \n doesn’t belong to the filter itself, rather it generates a line-break required by the Livestatus query contructed by the filter.
If you now save, all of your monitoring’s CPU load-services will land on the map. As well, any new objects in the monitoring which match the filter will be added automatically to the map.
In the NagVis documentation it is also described how the configuration functions directly by using the Config file.
By the way: since dynamic maps can also be saved as static maps with Actions > Export to static map, this method can be used as a beginner’s help to create static maps containing very many elements.
4. Customising maps
4.1. Lines
NagVis provides various types of lines: there are purely decorative lines without further functions under Edit Map > Add Special > Stateless Line, lines which visualise hosts and services with 'traffic light colours' in the same way as for icons, and the Weathermap Lines. These last visualise network bandwidths using seven distinct colours. To create lines with this 'weather map style' preceed as follows:
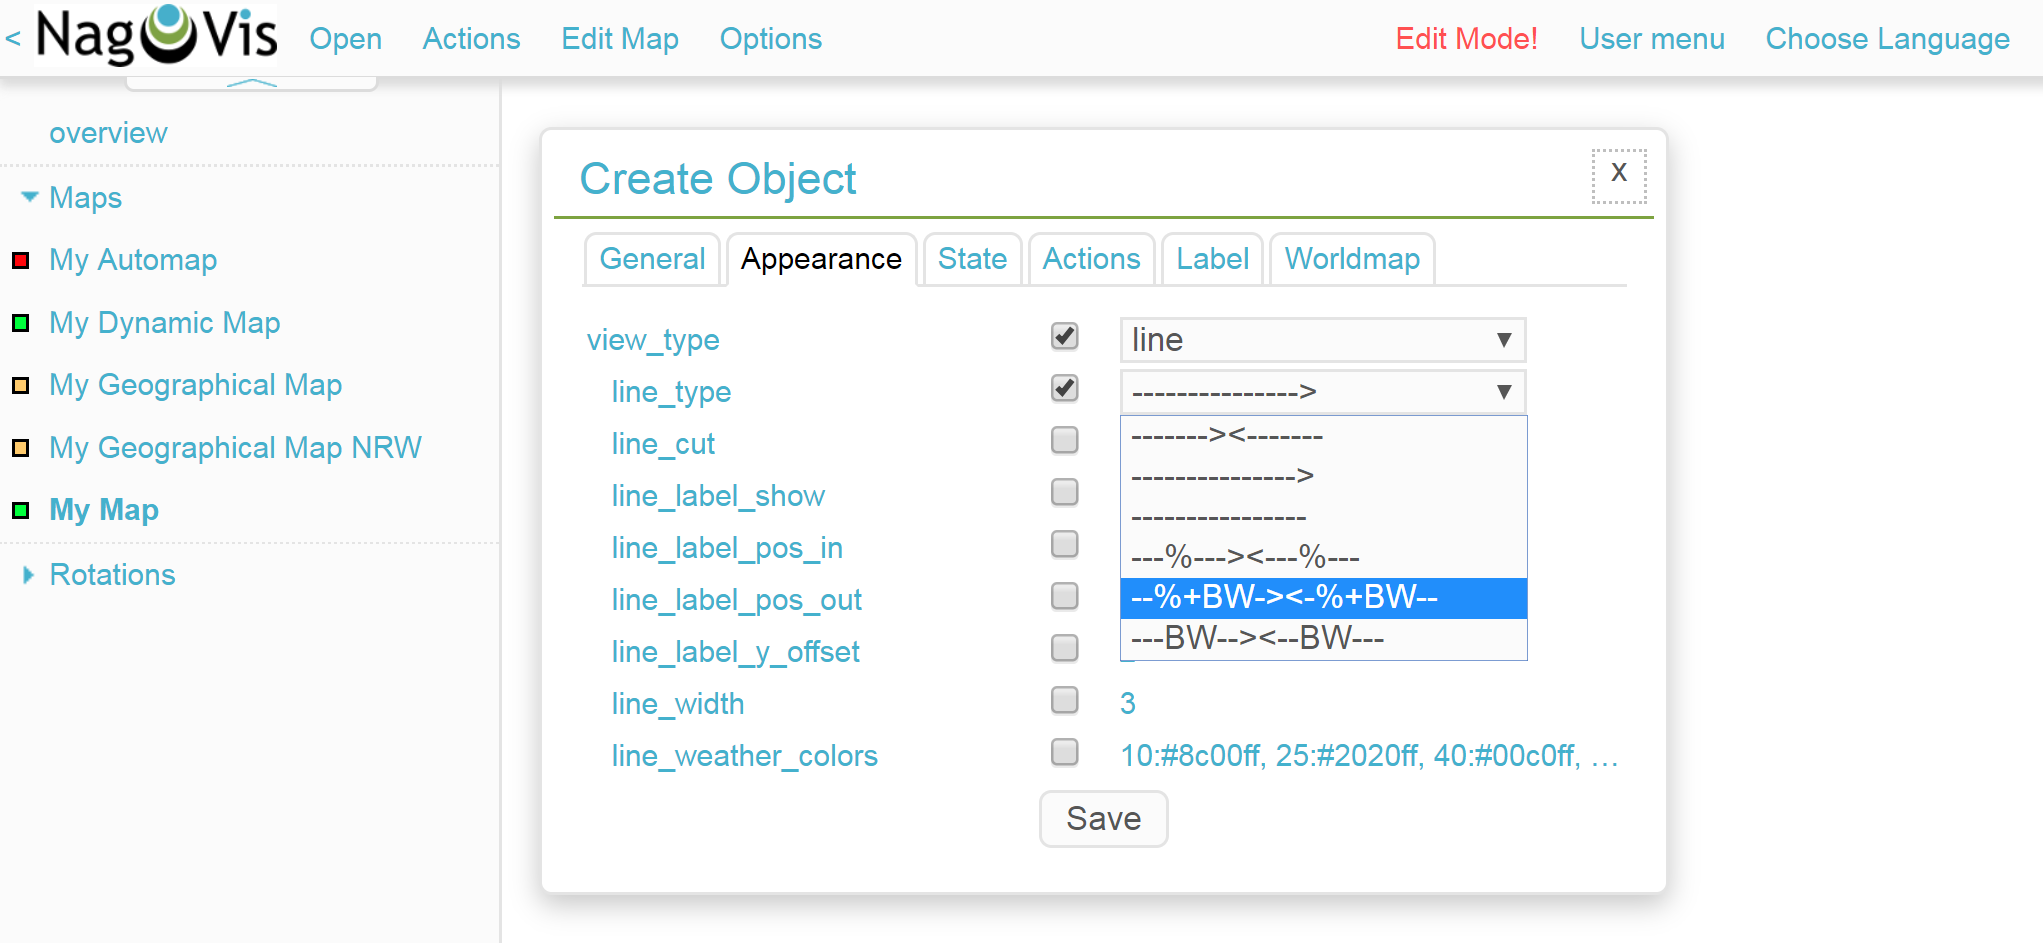
Start with Edit Map > Add Line > service and select a host and a network interface in the Create Object dialogue.
Next, switch to the Appearance tab and set the view_type to line. As the line_type activate the --%+BW→←%+BW-- variant – with this lines will be generated for upload and download and they will include labels for percentage (%) and absolute (BW) bandwidth.
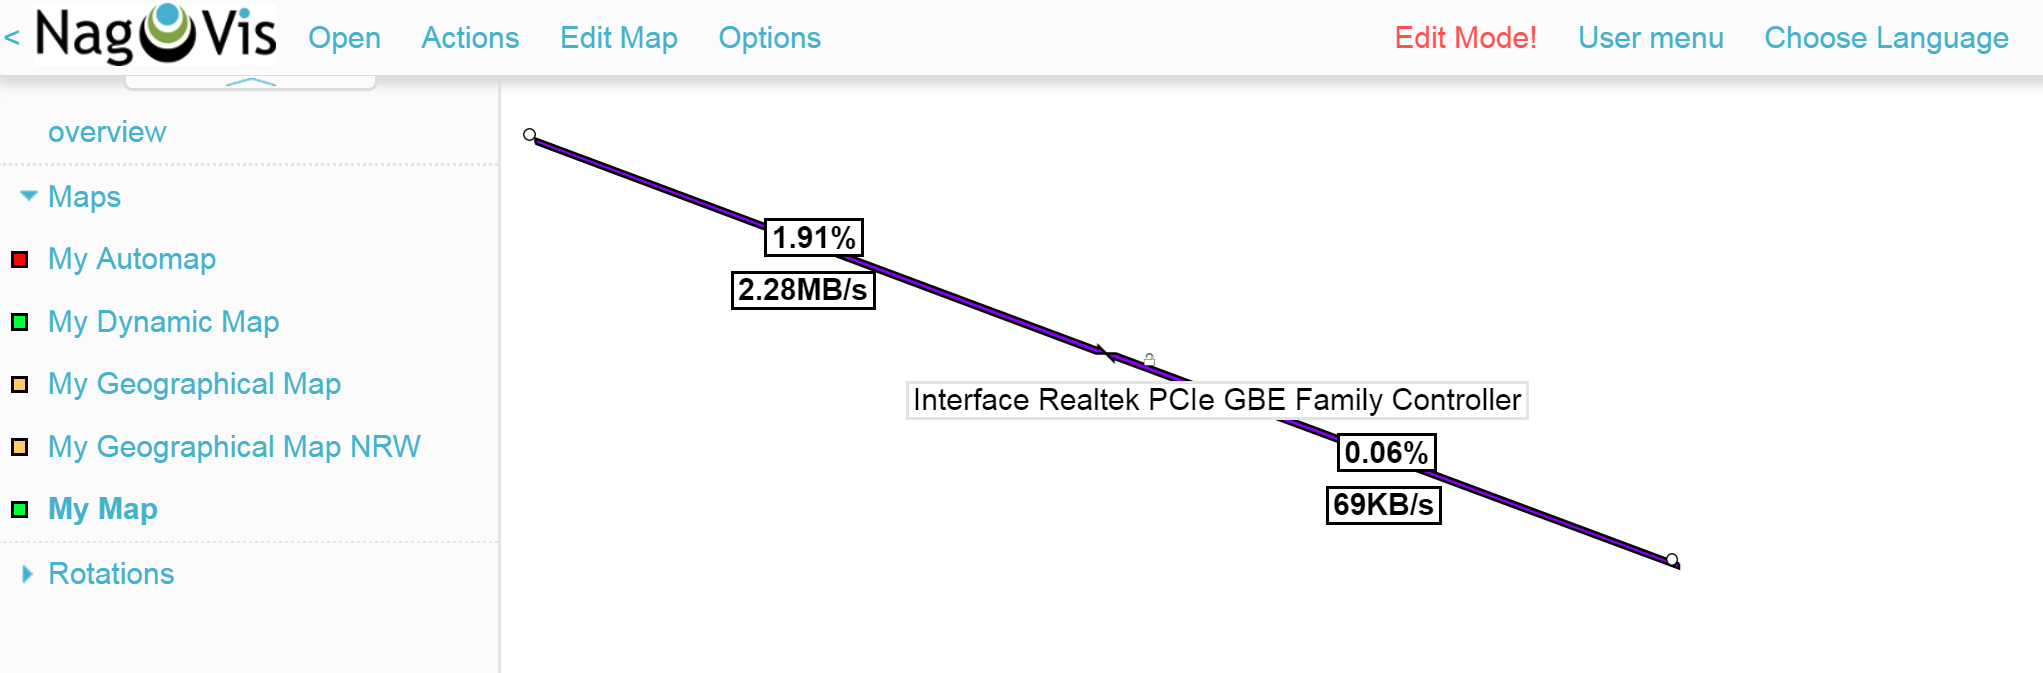
Once saved the lines will appear on the map. Clicking on the 'lock' symbol in the middle allows the end points as well as the middle point of the line to be moved.
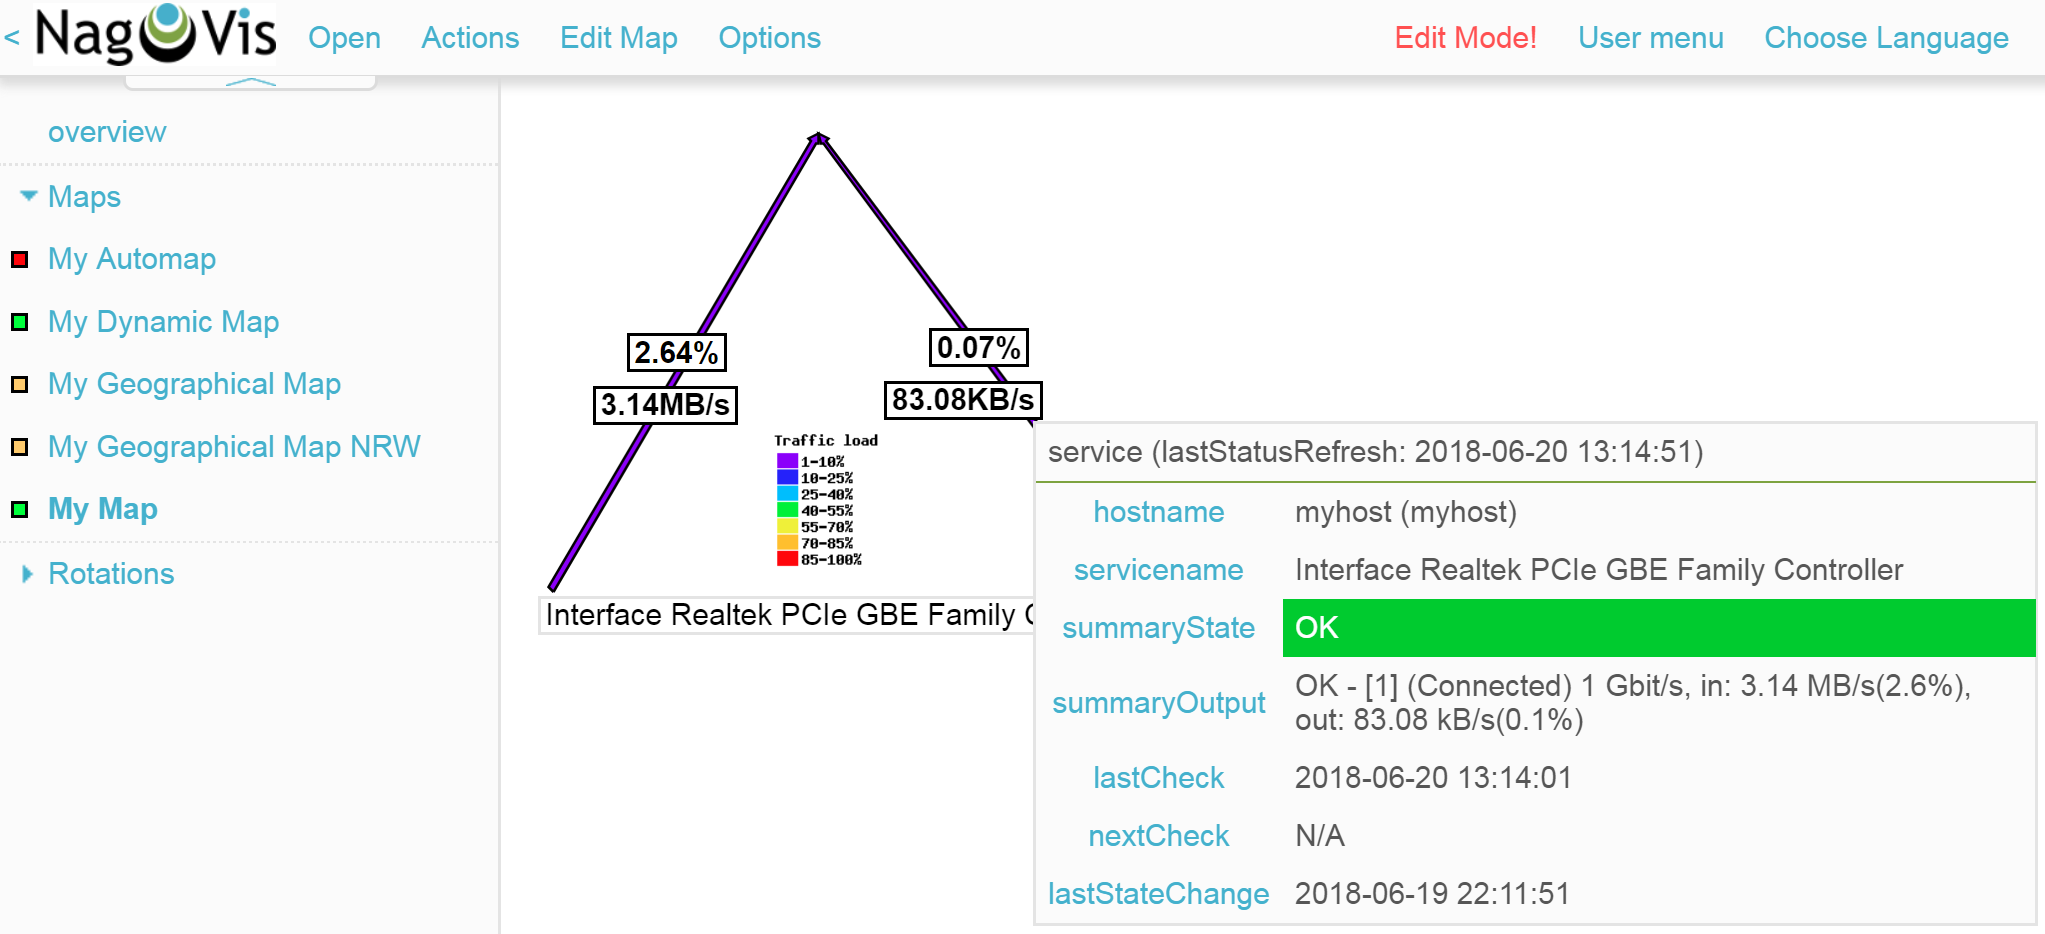
NagVis also provides a default legend: using Edit Map > Add Special > shape insert a so-called Form – simply an image in NagVis. In the icon option simply choose the image demo_traffic_load_legend.png from the dropdown-menu.
4.2. Gadgets
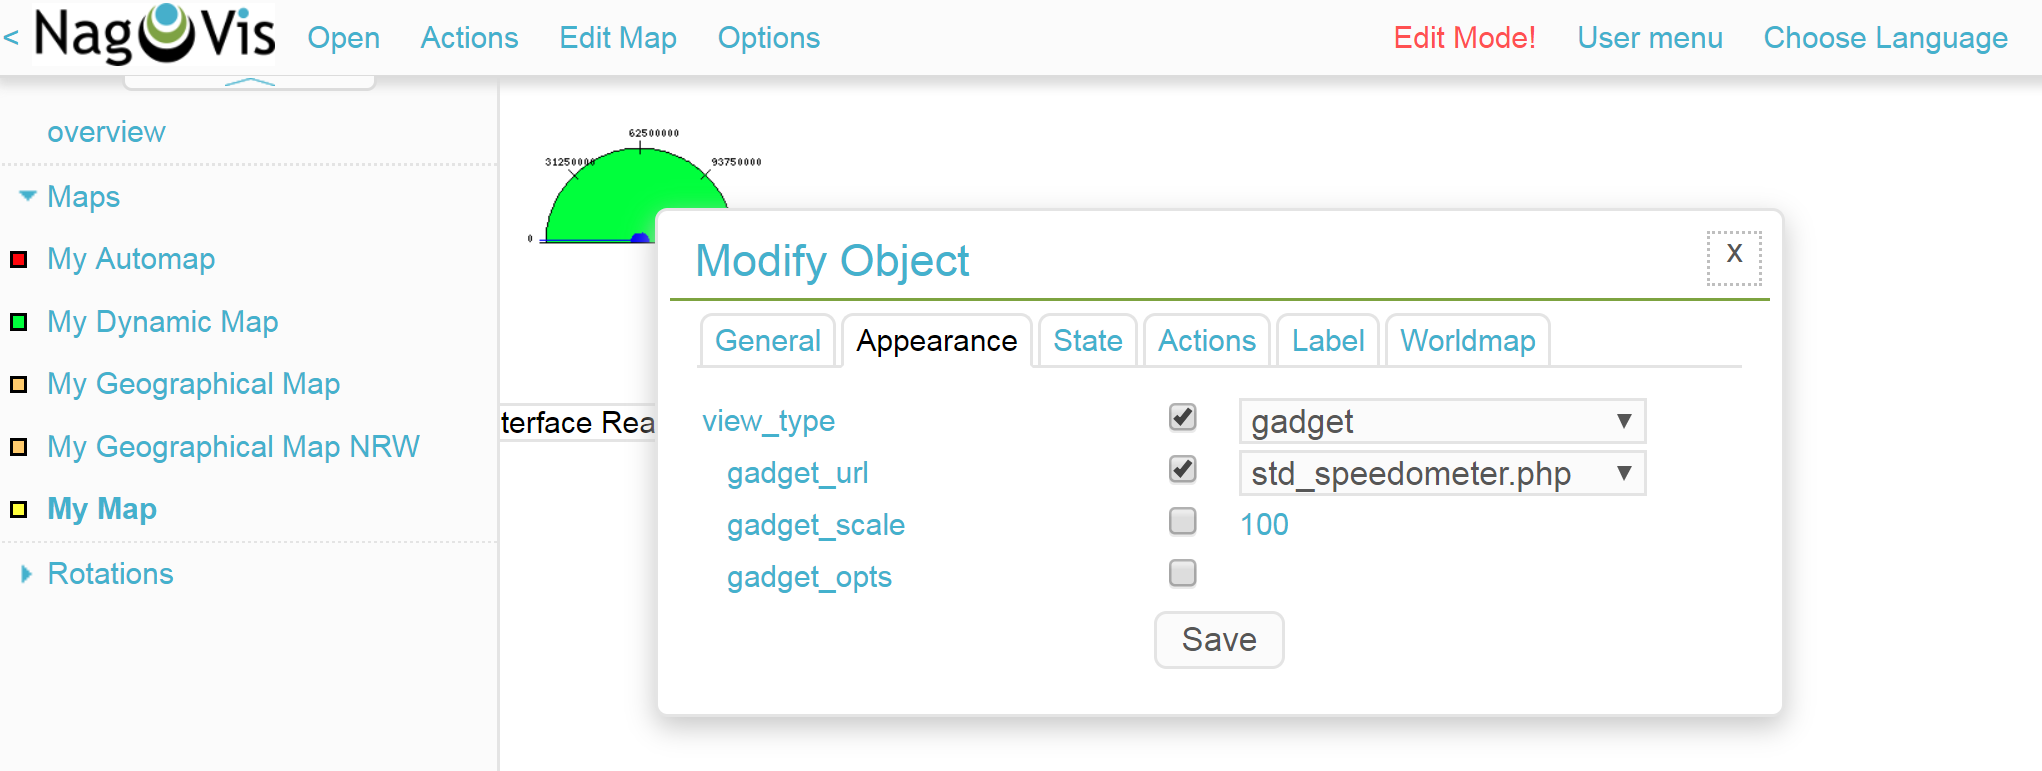
Gadgets, like lines and icons are aids to visualisation on a map. They show performance data in the form of speedometers, thermometers or similar. Consequently these are only available for services. As an example, the load on a network interface can be created in the style of a speedometer:
Next, add a service as an icon to your map using Edit Map > Add Icon > service. In the General tab choose myhost as the host, and a suitable network interface as the service.
Switch to the Appearance tab and set view_type to gadget. Directly below, activate gadget_url. Here there are a number of display variations which correspond to the data in share/nagvis/htdocs/userfiles/gadgets/. Select std_speedometer.php for the speedometer display.
4.3. Container/iFrames
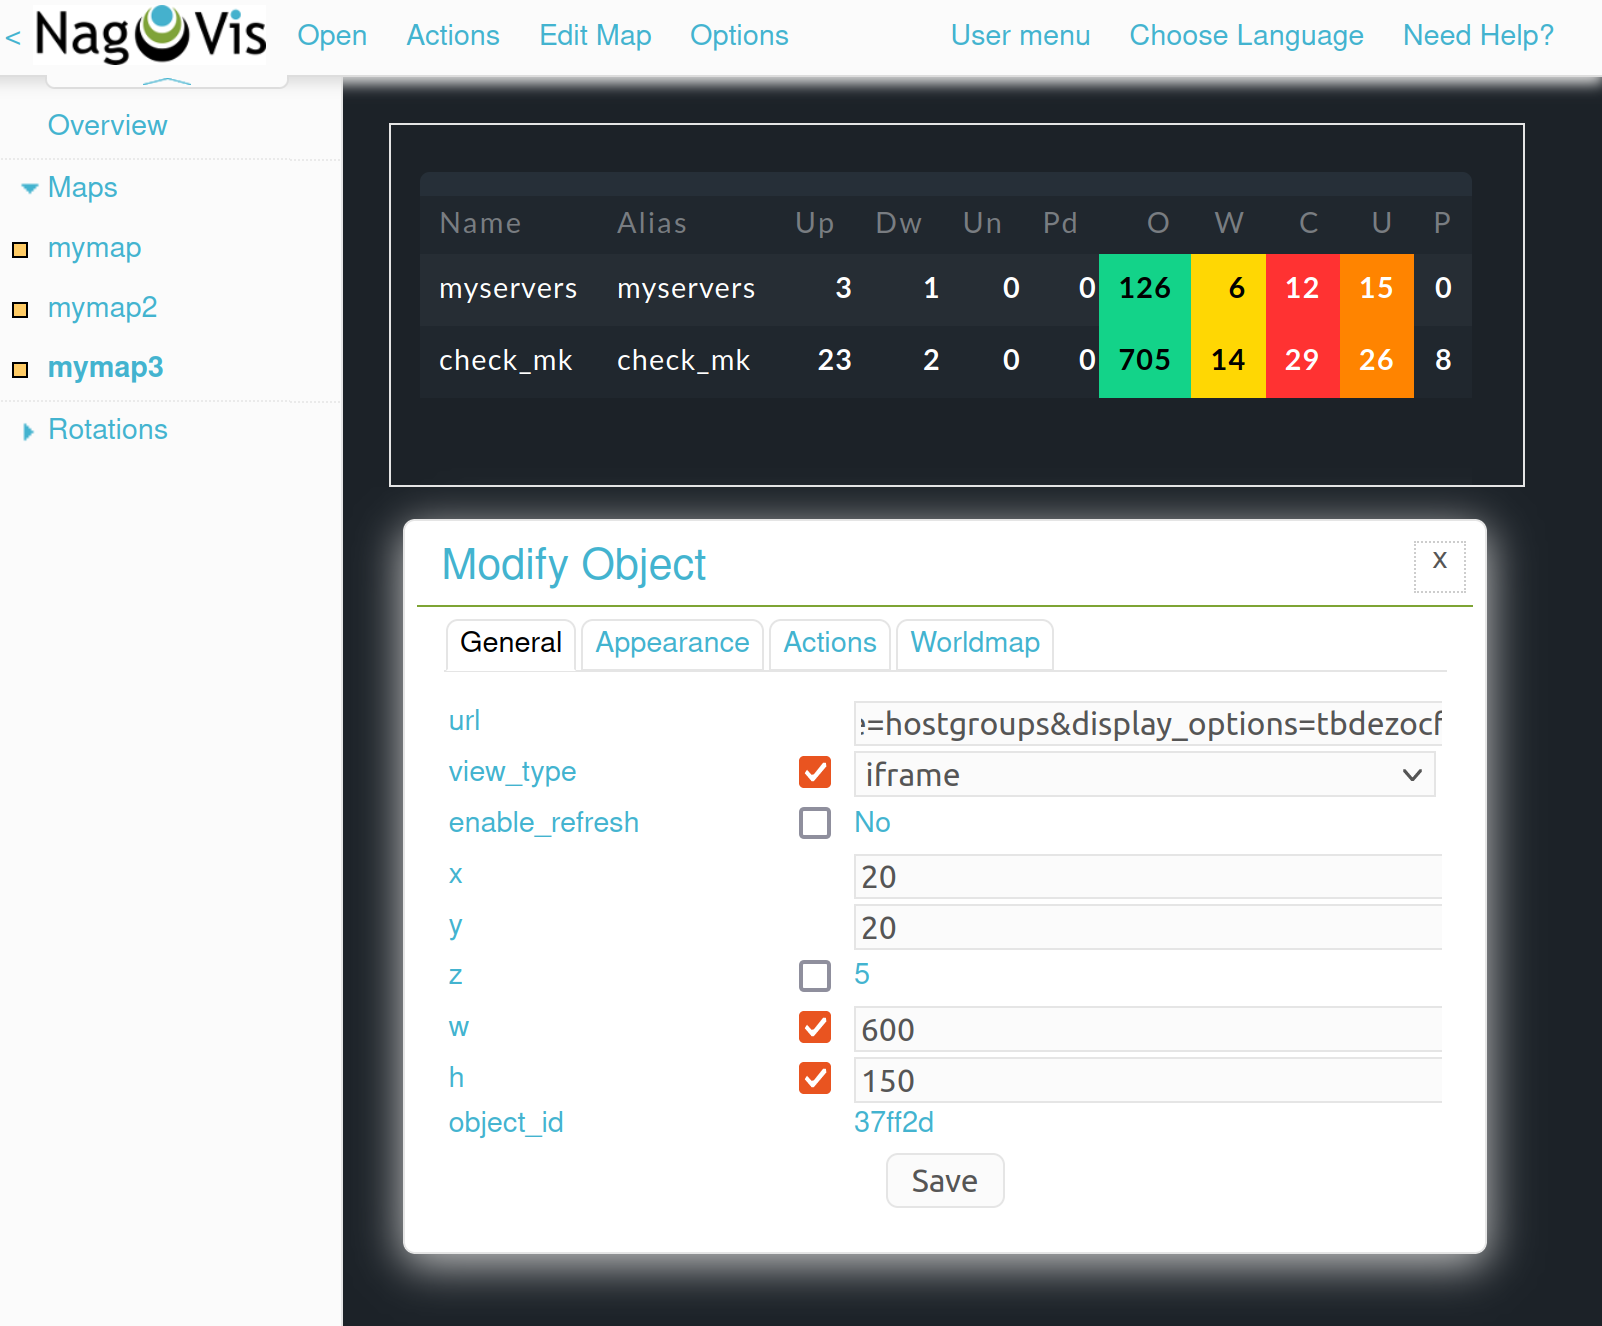
An interesting possibility for showing external information is provided by Container. Here you can simply specify a URL and allow the target to be displayed in an an iFrame. As an example, a host group view restricted purely to the table should serve as an embedded view.
Add a container to your map using Edit Map > Add Special > Container. In contrast to host and service icons, here you can’t simply click on the map, rather you must draw a frame. This can of course be modified at any later time. A dialogue will options will again open.
In the General tab set the view_type to iframe.
The actual work is in the url option: The basis-URL can be
gotten with ![]() on the Host Group View page.
Subsequently the Embed a view options are
missing with which only the table is actually displayed (plus a
bit of background). Thus the URL can look something like this:
on the Host Group View page.
Subsequently the Embed a view options are
missing with which only the table is actually displayed (plus a
bit of background). Thus the URL can look something like this:
/mysite/check_mk/view.py?view_name=hostgroups&display_options=tbdezocf.
4.4. Making maps rotate
On NagVis' overview page you may have noticed the point Rotations at the lower left, or respectively in the middle of the list of maps in Rotation Pools. Maps can be set to rotate automatically at any desired interval, which for example is practical for publicly-visible information monitors. The configuration is performed in the NagVis configurations File. Open the /omd/mysite/etc/nagvis/nagvis.ini.php file, and scroll to line 440 where the Rotation pool definitions can be found. Here three lines are required to define a Rotations-Pool, the appropriate maps, and the interval. In the below example the pool myrotation has been configured with the maps mymap1, mymap3 and mymap, and with an interval of 30 seconds:
[rotation_myrotation]
maps="mymap1,mymap2,mymap3"
interval=30