1. Introduction
Checkmk has an integrated graphing system with comprehensive features for the visualization and storing of metrics. However it might still be helpful to use Grafana as an external graphing system — for example, if you are already using Grafana and have other data sources connected to it and want to have a single, unified dashboard.
Beginning with version 2.0.0, in all Checkmk editions it is possible to directly address Checkmk as a data source in Grafana 8.x, and to display individual metrics — or even entire graphs as predefined by Checkmk — in Grafana. In addition you can create your own graphs dynamically using regular expressions to specify a set of hosts and services that should take specific metrics in the graph into account.
This article explains how to retrieve metrics from Checkmk and display these in Grafana. For detailed instructions on how to use and configure Grafana, see the Documentation at Grafana Labs.
The plug-in for Grafana is developed independently from Checkmk, thus it is not included with Checkmk, rather it is maintained in its own repository on GitHub. Since the plug-in has to be installed in Grafana, it makes no sense to bundle it with Checkmk. An inclusion directly into Grafana currently is in review by the maintainers of Grafana. Once this review has been completed, an installation directly from the Grafana user interface will be possible.
2. Check prerequisites in Checkmk
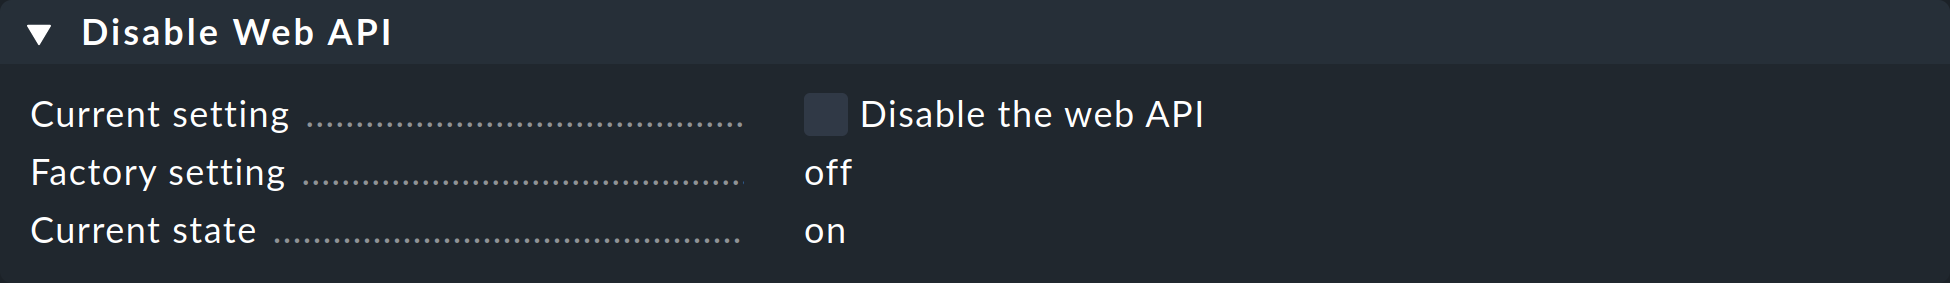
If you created your site with Checkmk 2.1.0 — that is, ran the command omd create with version 2.1.0 — the Checkmk Web API is disabled by default in the global settings.
In this case, you need to re-enable the Web API by unchecking Setup > General > Global Settings > Site management > Disable Web API.
Starting with version 2.2.0 of Checkmk, the plugin will support our REST API.
3. Setting up the plug-in in Grafana
3.1. Installing the plug-ins
To install the plug-in, simply download the zip file with the latest version, and copy it – for example, with scp – to the Grafana server.
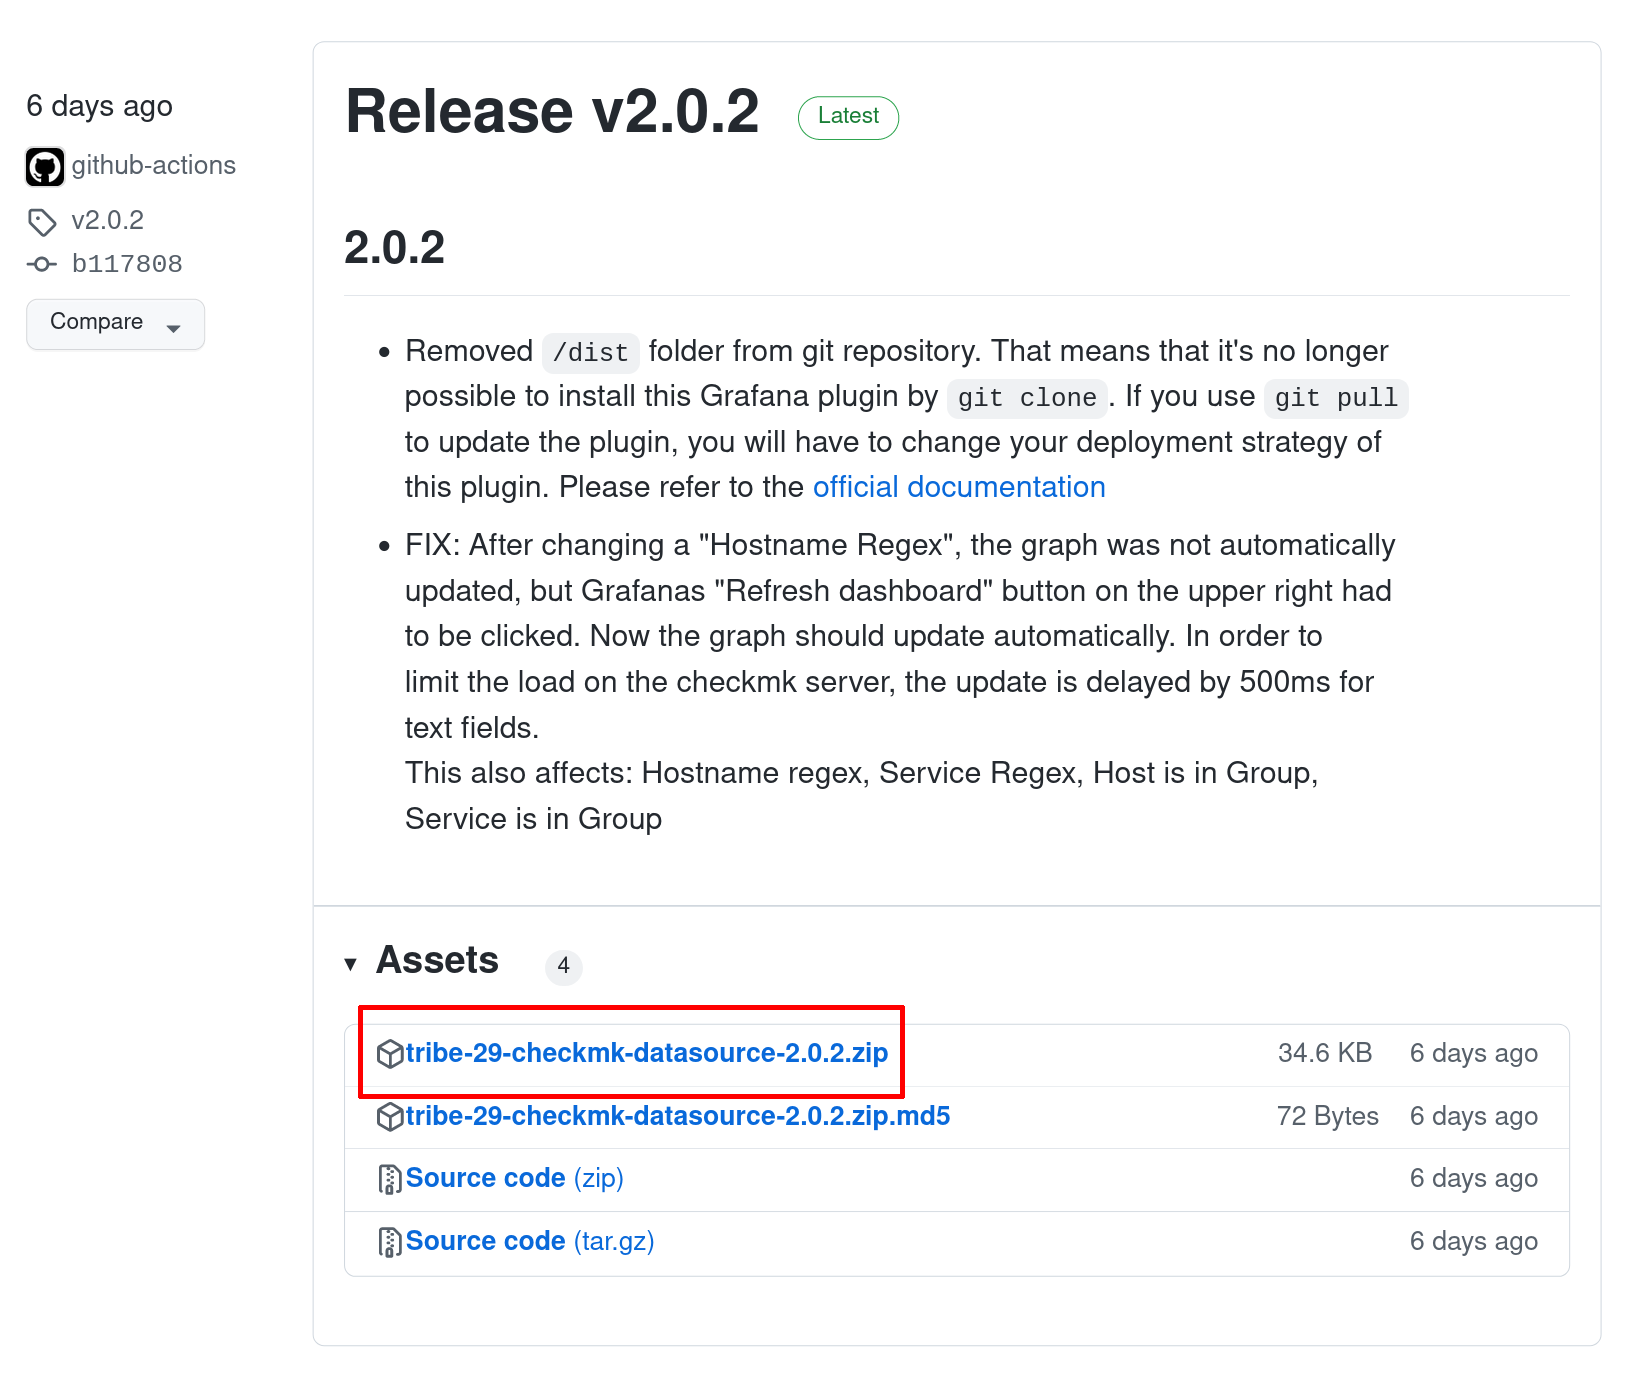
Alternatively, you can also load the file directly from the command line. Note that you need to know the correct version for this.
root@linux# wget https://github.com/Checkmk/grafana-checkmk-datasource/releases/download/v2.0.2/tribe-29-checkmk-datasource-2.0.2.zipNow unpack the archive:
root@linux# unzip tribe-29-checkmk-datasource-2.0.2.zipNext, move the newly created folder to Grafana’s plug-in directory.
Its path is usually: /var/lib/grafana/plugins/
root@linux# mv -v tribe-29-checkmk-datasource /var/lib/grafana/plugins/tribe-29-checkmk-datasourceChange ownership to the Grafana user (typically grafana):
root@linux# chown -R grafana:grafana /var/lib/grafana/plugins/tribe-29-checkmk-datasourceInstallation by cloning the Git archive (as stated in previous versions of this document) is no longer possible.
3.2. Allowing unsigned plug-ins
As of Grafana 8.0, it is no longer possible to easily integrate external plug-ins if they have not been signed. This applies to the Checkmk plug-in which is still under development, so that you also need an additional step.
To do so, open /etc/grafana/grafana.ini in your favorite editor, navigate to the`[plugins]` section and modify the line ;allow_loading_unsigned_plugins = as follows.
Make sure to remove the semicolon at the beginning of the line:
[plugins]
allow_loading_unsigned_plugins = tribe-29-checkmk-datasource
With this setting you add an exception for this single plug-in.
If you are using Grafana in a (Docker) container, either link the custom INI file into the container or create a volume which you map to the directory in the container (/etc/grafana).
The following code blocks show an example of how to link the INI file using --mount.
Note that this is only an example and will probably not fit your environment exactly:
user@host:~$ sudo docker run -d --mount type=bind,source=/home/user/grafana/grafana.ini,target=/etc/grafana/grafana.ini -p 3000:3000 --name grafana -v grafana-plugins:/var/lib/grafana/plugins -v grafana-db:/var/lib/grafana grafana/grafana3.3. Restarting the Grafana service
After changing the configuration file, updating or installing the plug-in, restart the Grafana service:
root@linux# service grafana-server restartAfterwards the plug-in is available in the Grafana GUI, and from there can be activated and configured.
3.4. Activating and setting up the plug-in
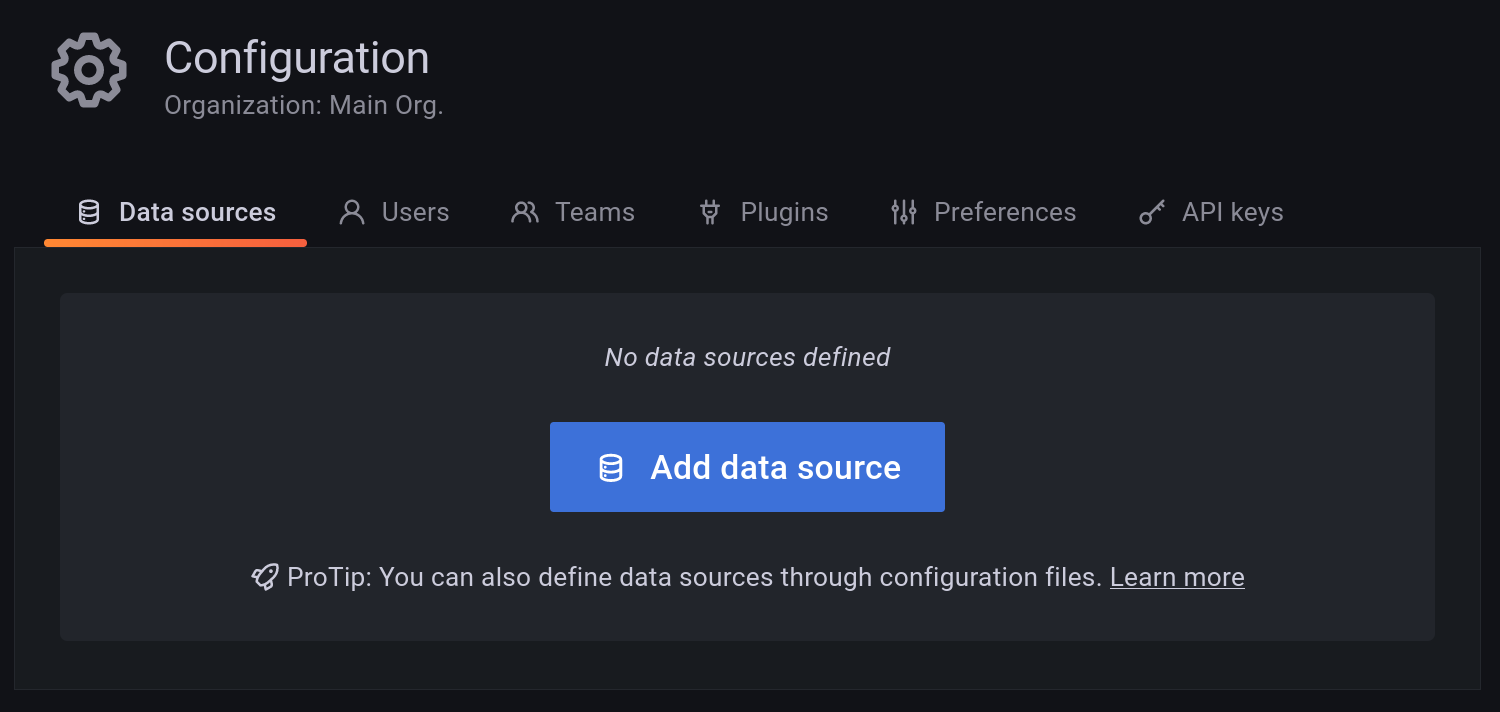
Once the necessary files have been installed you can activate the plug-in in Grafana. Go to the configuration and select the Data sources tab. Here you can add a new data source using the Add data sources button:
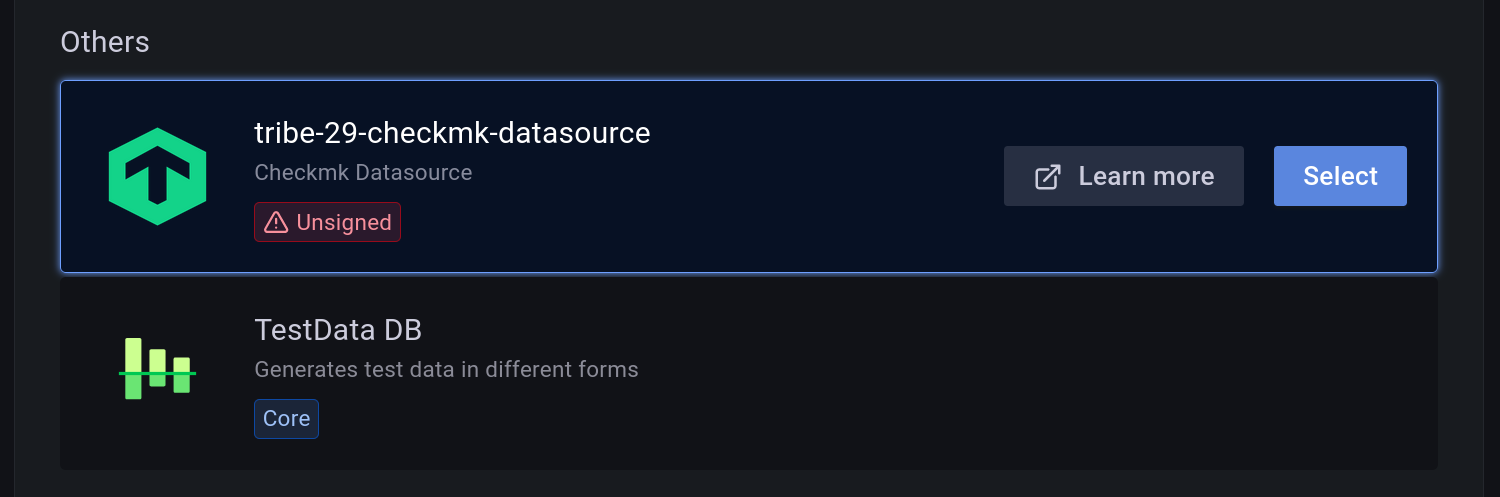
The entry for Checkmk can be found at the bottom of the category Others:
The configuration form for the data source is quite simple. Enter the URL for your site and an automation user who has rights to access the Web API. Important: In a distributed setup with multiple sites, specify the URL for the central site in the input field:
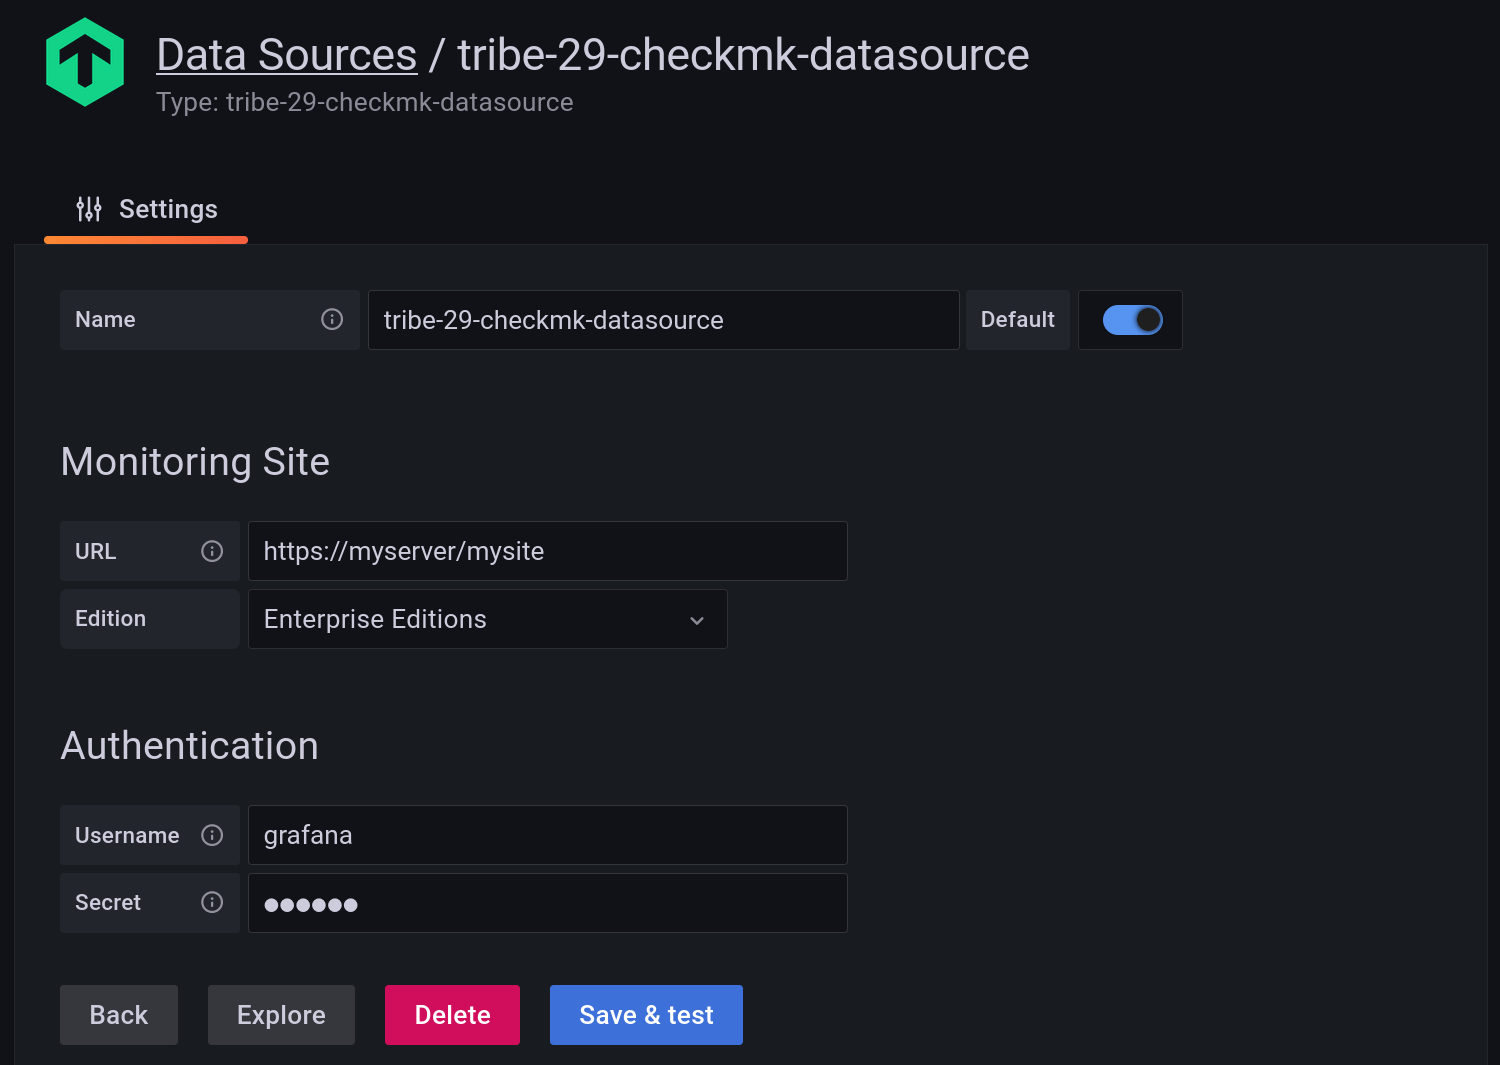
If you want to connect more than one Checkmk site, you can optionally add a unique name to each connection — otherwise simply leave the default tribe-29-checkmk-datasource as is.
After you have saved the connection with the Save & Test button, it will be available as a data source in Grafana and you can configure your first graphs.
4. Creating graphs
4.1. Creating a blank dashboard
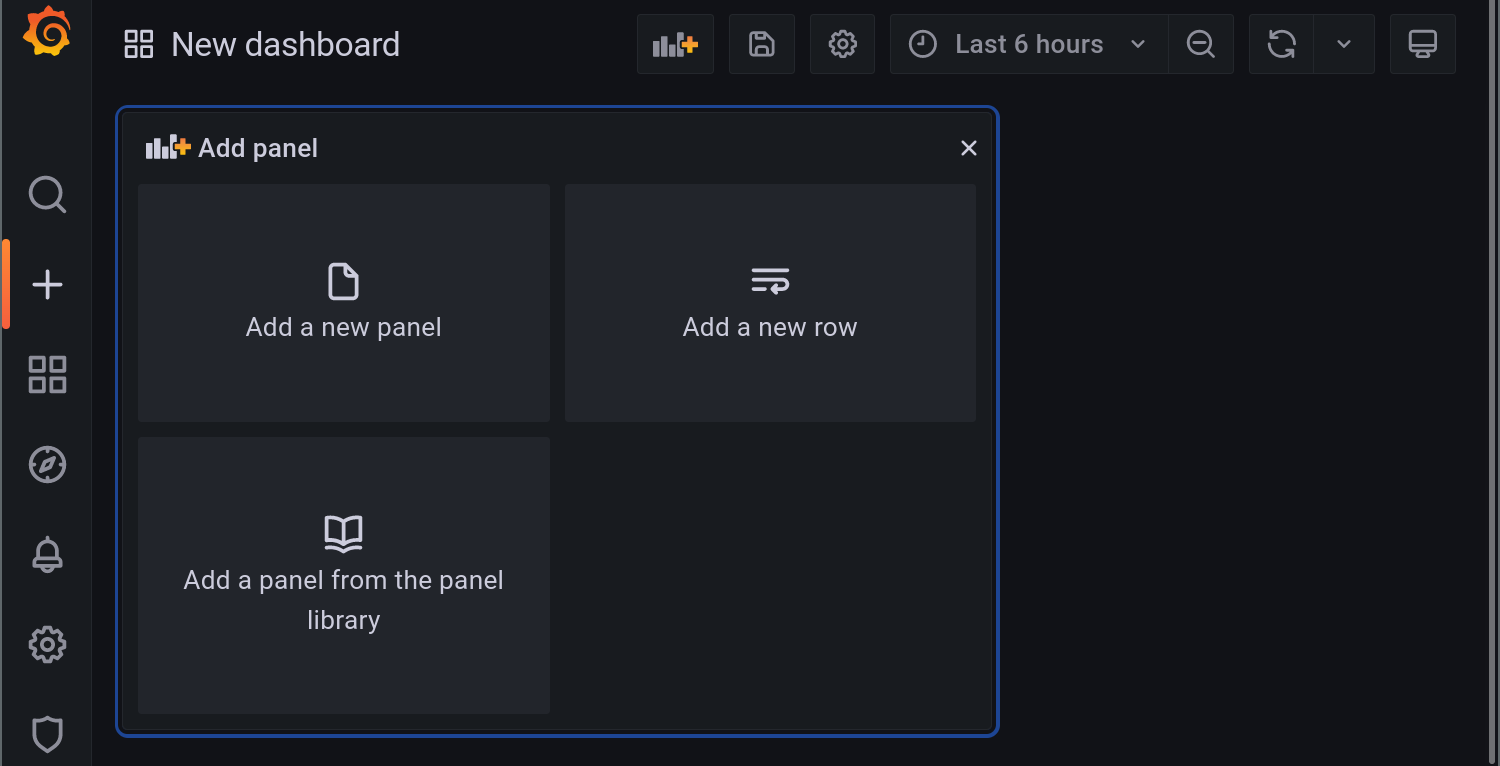
Dashboards are generated in Grafana using the ‘plus’ icon on the left side. Clicking on Dashboard will open a new, blank dashboard:

4.2. Displaying a single metric from a host
The simplest dashboard shows a single graph for a service on a host. This can also be the metric of a local check for which no prebuilt graphs exist. In an existing dashboard or the one you just created, create a new panel. First select Add Panel here:
Creating the panel immediately takes you to adding a new Query. In the Data source menu, select tribe-29-checkmk-data-source.
Access to data for visualization is slightly different between ![]() Checkmk Raw Edition and
Checkmk Raw Edition and ![]() Checkmk Enterprise Editions:
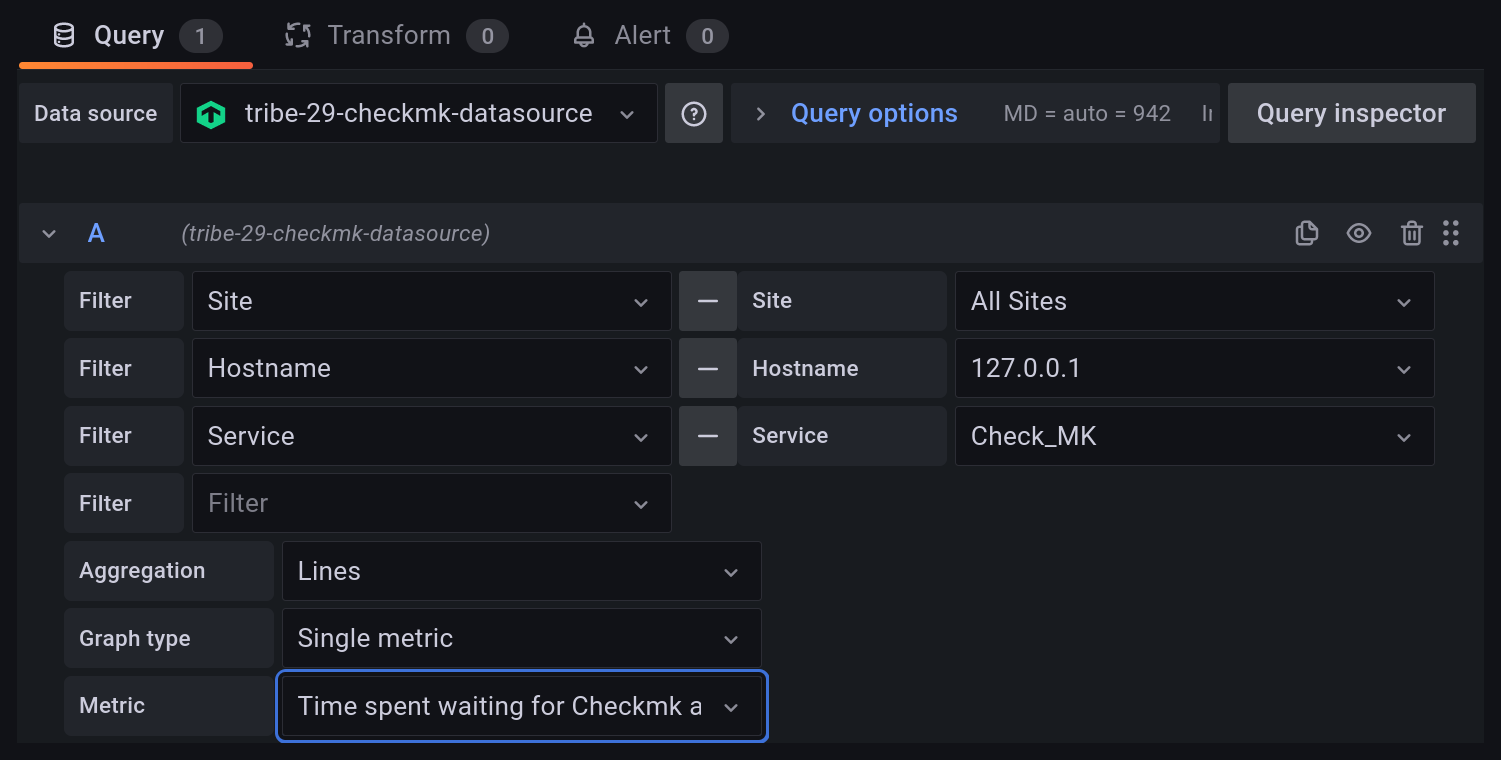
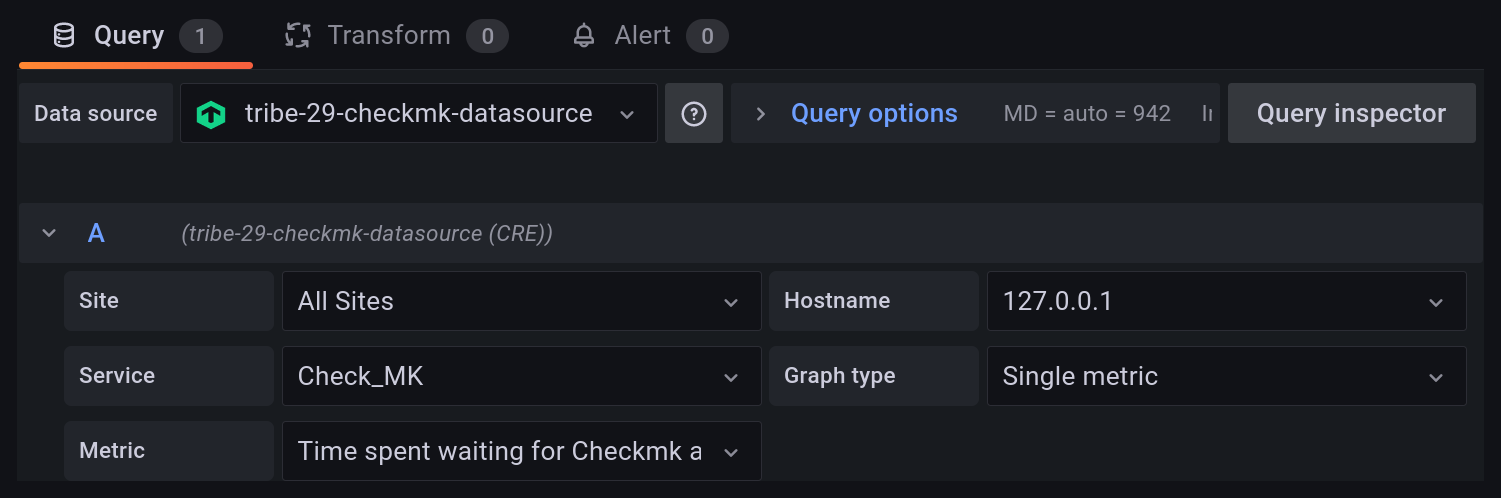
In the Raw Edition you have to select from predefined menus for site, host name, service and so on.
The Enterprise Editions provide more flexibilty by using cascades of filters.
This allows for very detailed selection, for example, by using regular expressions.
We have chosen an example for which you can action its configuration procedure in both Checkmk editions.
Checkmk Enterprise Editions:
In the Raw Edition you have to select from predefined menus for site, host name, service and so on.
The Enterprise Editions provide more flexibilty by using cascades of filters.
This allows for very detailed selection, for example, by using regular expressions.
We have chosen an example for which you can action its configuration procedure in both Checkmk editions.
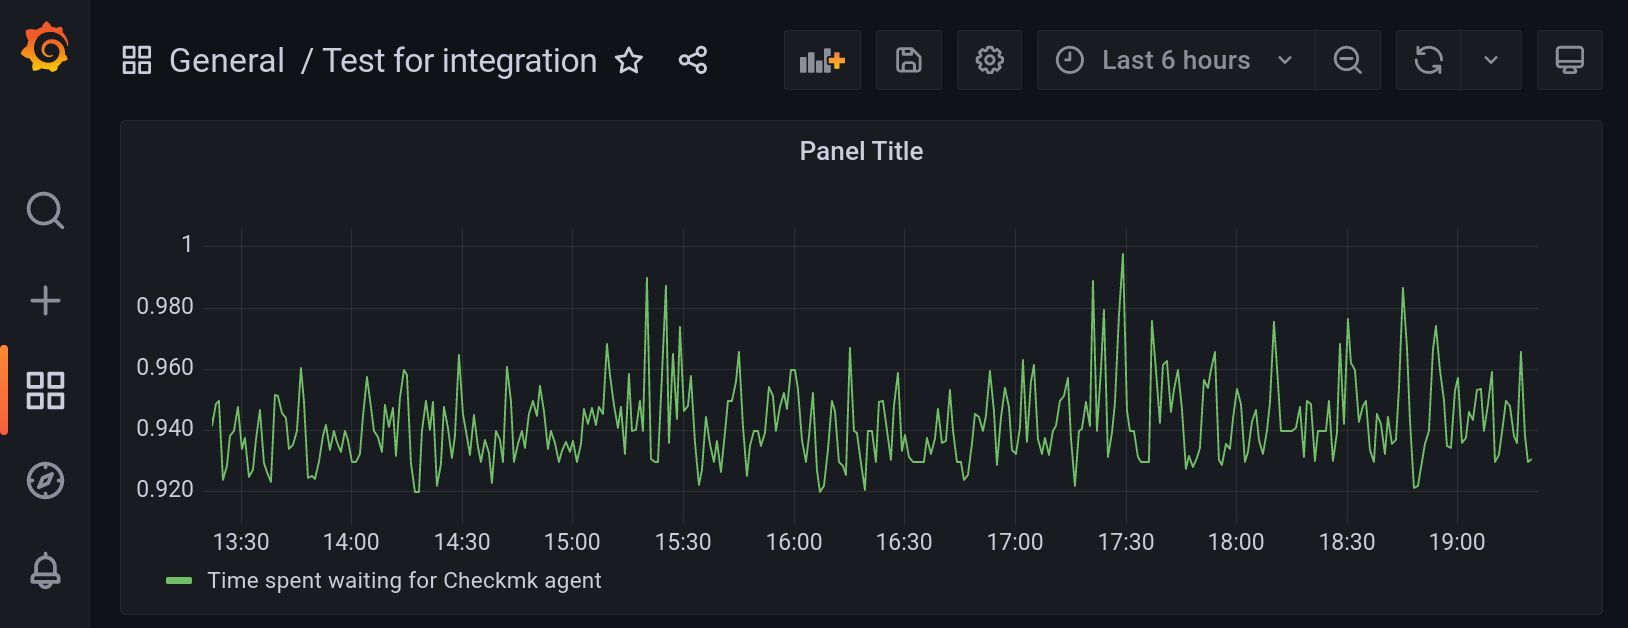
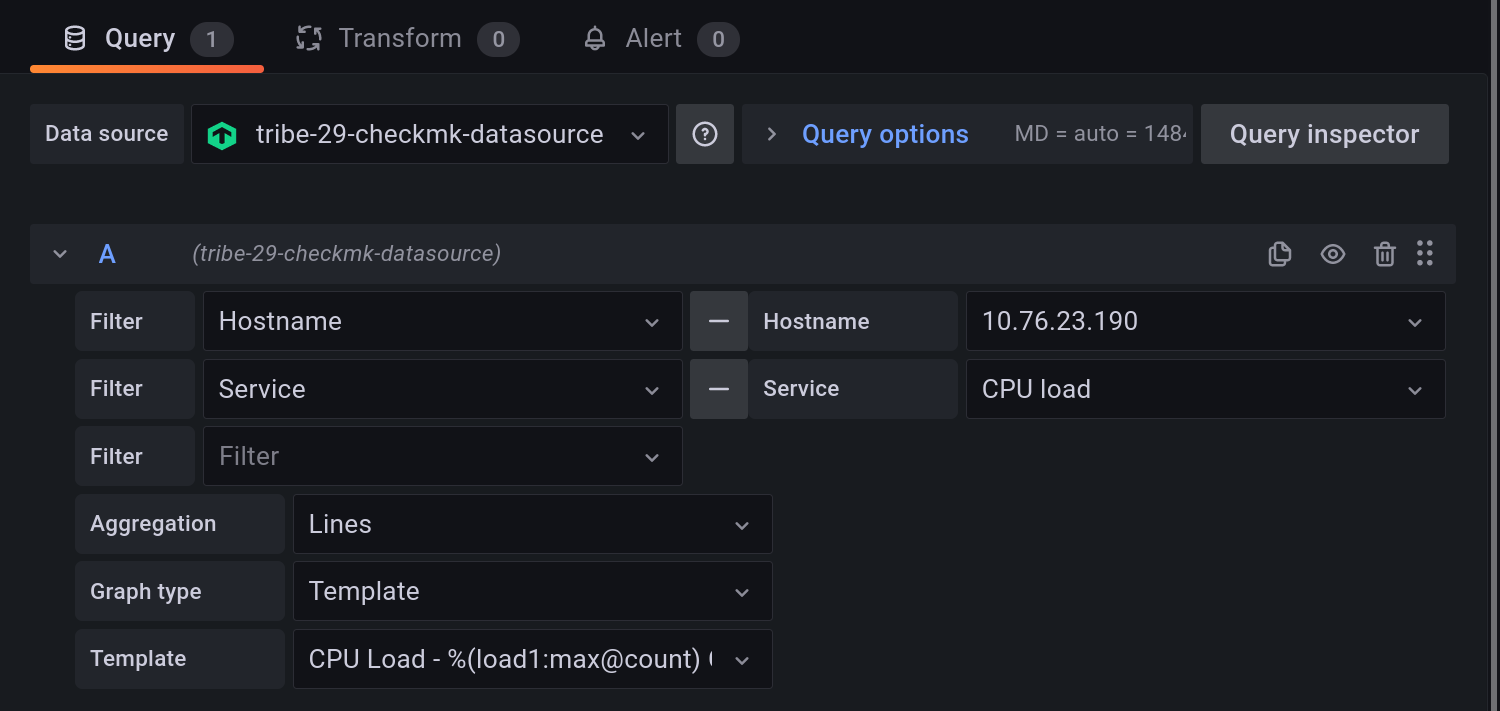
First choose the Site, then filter for the Hostname used in monitoring. For the first test select an arbitrary host that uses the Windows or Linux agent. As the Service choose Check_MK. Set the type of Aggregation to Lines. For the Graph type you have to select between Single metric or Template: Templates inherit metrics from Checkmk that may also contain combined graphs. Our screenshots show the Single metric containing the Time spent waiting for Checkmk agent:
Grafana will instantly show the result. Now click on Apply to save the graph. This brings you back to the dashboard where you click the floppy disk icon (Save dashboard) in the upper right area to save it. Afterwards you’ll be prompted to specify a title for the new Dashboard.
4.3. Displaying a predefined graph from Checkmk
The developers of Checkmk already have aggregated many corresponding metrics into combined graphs to enable users to get a quicker overview on the various aspects of a single resource. You can display the metrics from such a ready-made graph directly in Grafana.
The procedure starts in the same way as explained in the previous section, but differs at Graph type by selecting the Template entry and the Template of the service to be used.
Once you are satisfied with the selection made, click the Apply button. The graph will now be available in the selected dashboard.
4.4. Creating complex graphs
Especially in a dynamic cluster, you will often want to be able to track the entire history of a metric across all participating hosts without having to modify a graph each time a new node is added or removed. To achieve this you have several options for dynamically customizing graphs.
The first way is to filter by Host Labels or Host Tags instead of selecting individual hosts.
Another option is to use regular expressions.
You can apply regular expressions to hosts or services.
In the example, filesystem matches all services that contain filesystem — no matter how many file systems a host has mounted.
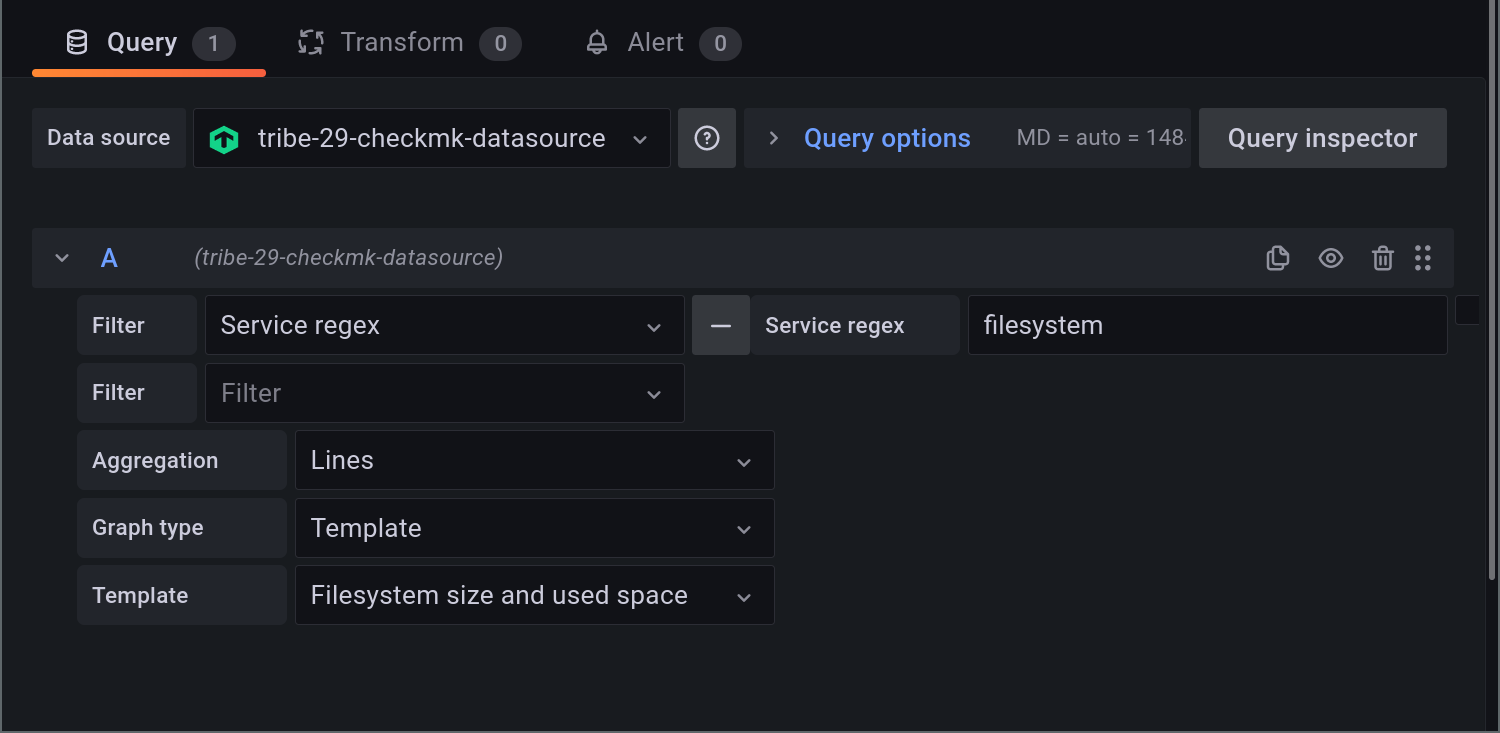
The entry filesystem.*nvme would narrow down the selection to all filesystems on NVME drives, regardless of the type of filesystem, since any string is allowed between filesystem and nvme.
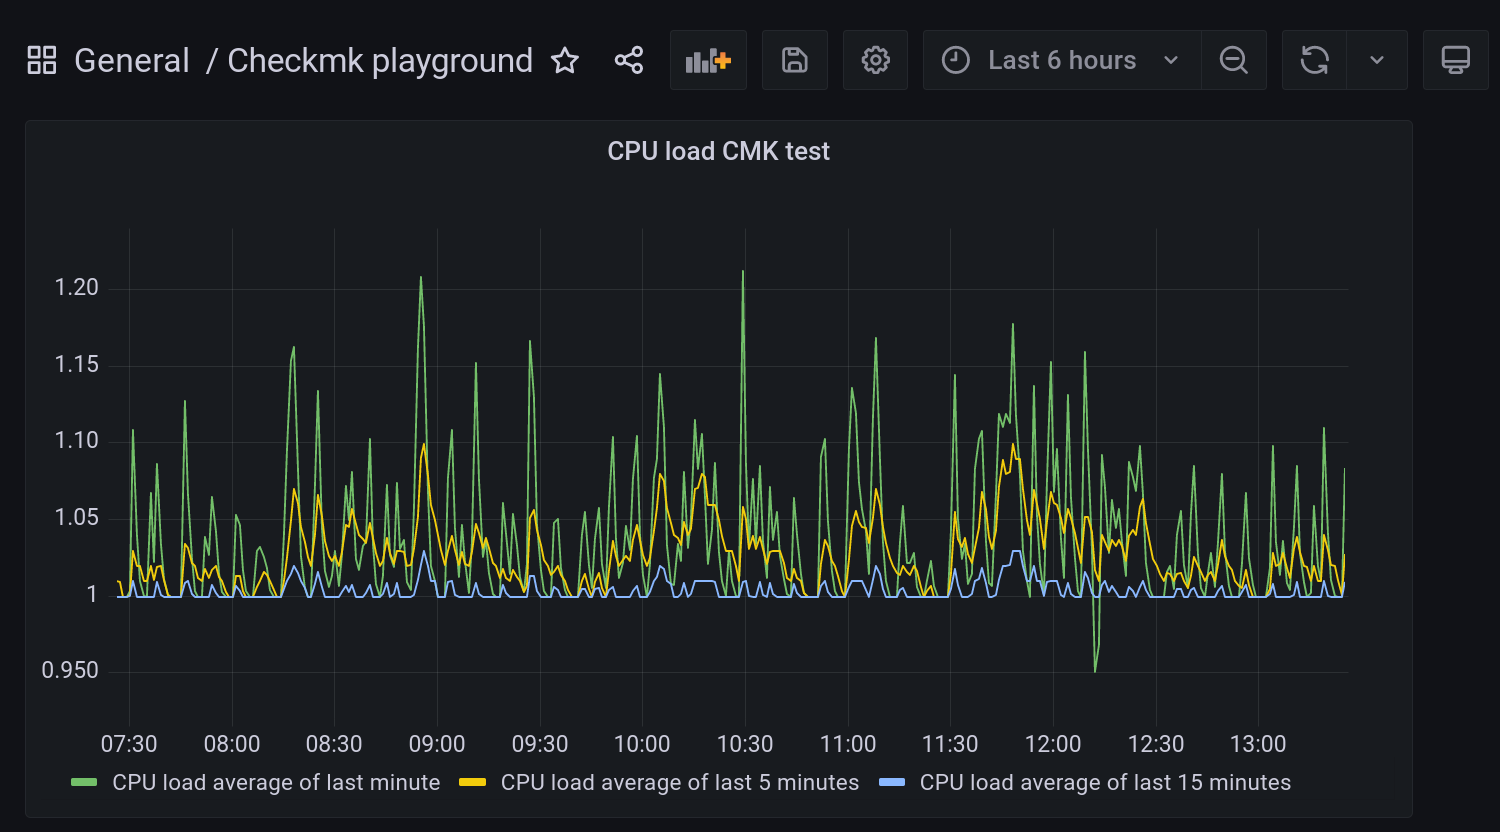
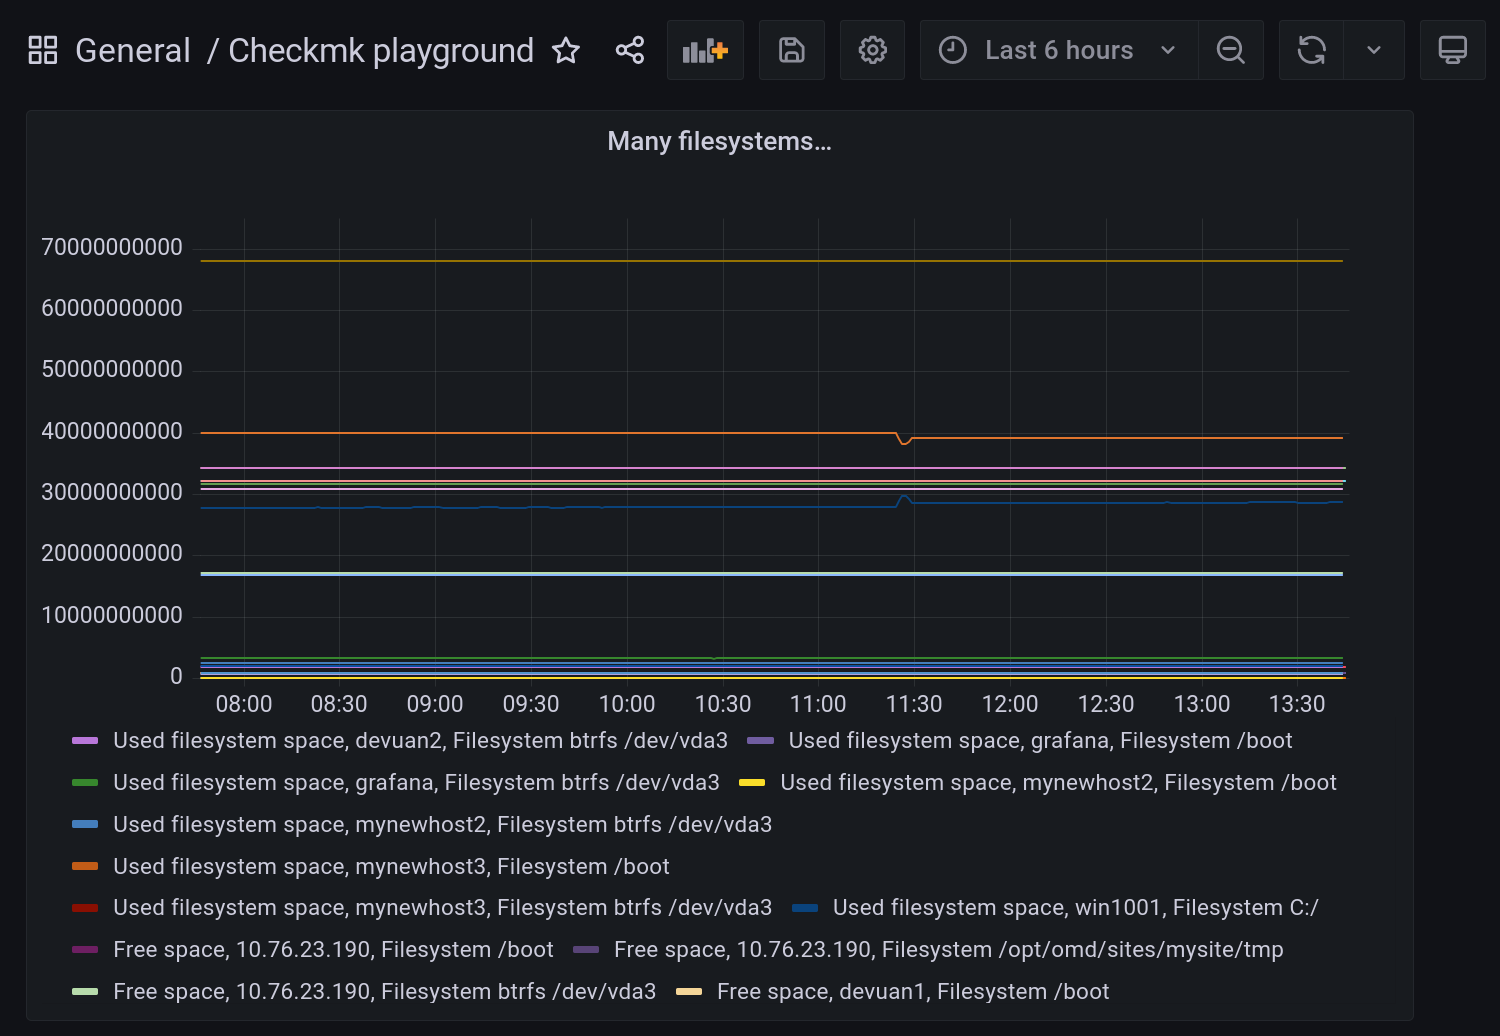
In addition to the advanced filter options, with Aggregation you can specify the representation of the metrics in the graph, and with Graph, which graph should be used as a reference. Note that metrics for a host/service will only be displayed if the host/service also has this selected graph. The example graph looks like this:
5. Changes compared to previous versions
5.1. Omitted variables
Earlier beta versions allowed the display of metric names to be controlled using variables.
Here the following variables $title, $site, $host and $service were allowed:
This feature was removed from version 2.0b1 of the plug-in because it actually duplicated a functionality that is already a part of Grafana.
In case you need for example the site name contained in the name of the metric but not as a filtering criteria, create a filter using a regular expression that uses the asterisk * to match any site.
5.2. Renaming via regular expressions
In the editing mode of each panel you find a Transform tab.
With the subitem Rename by regex you can reorder the naming of metrics or suppress information that is not needed.
Our following example searches two groups of characters that are separated by a comma and following space, swaps them and prepends Service und Host.
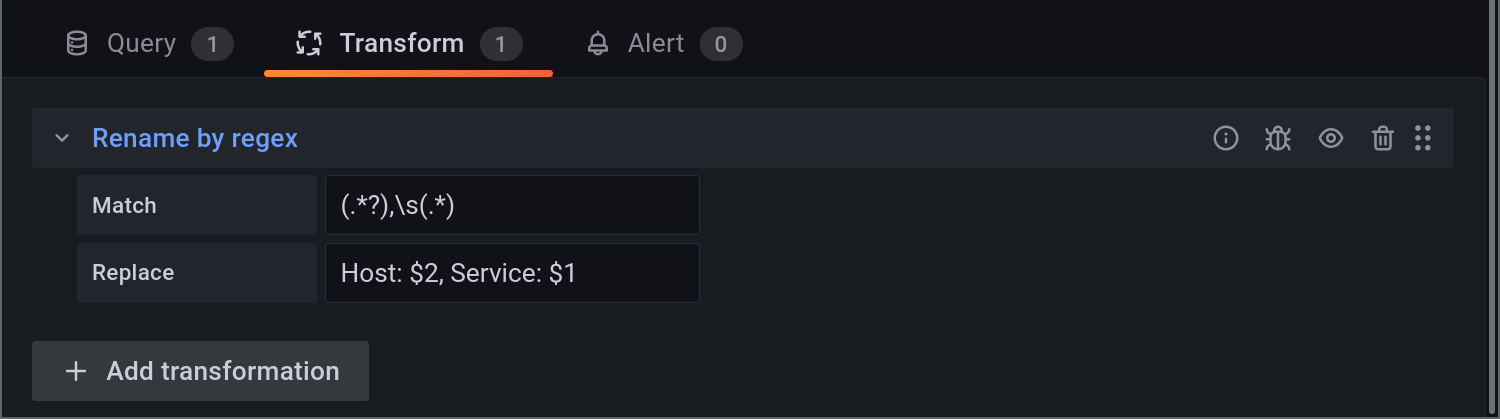
The variables $1 and $2 here correspond to the strings 'captured' in the line above (match groups or capture groups).
Grafana also allows for nested match groups.
An overview of their options is shown in the corresponding section in the regular expressions article.
6. Files and directories
| File path | Description |
|---|---|
|
Grafana checks here for (new) plug-ins. Each plug-in gets its own subdirectory. Save the Checkmk plug-in here. |
|
Configuration directory for Grafana. |
|
Central configuration file for Grafana. Here you specify which unsigned plug-ins are allowed. |