1. Status interface
Now that we have finally given our monitoring system something to do, it is time to take a closer look at the elements of the Checkmk user interface that help you in your daily monitoring or operating life. In Checkmk, this component is sometimes called the status interface because it is mostly concerned with displaying the current status of all hosts and services. This includes dashboards and views that you call up via the Monitor menu, the snapins in the sidebar, as well as the display and processing of performance metrics.
2. Overview
Prominently placed at the top of the sidebar you will find the Overview snapin:
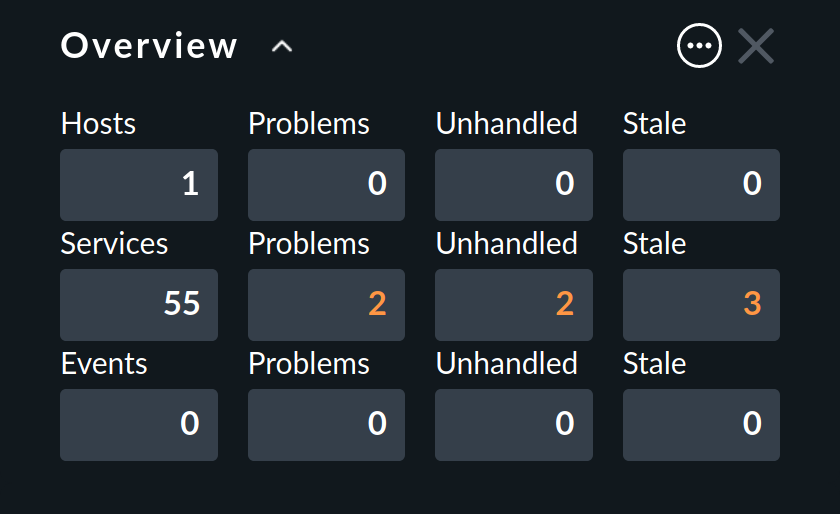
In the left column of this small table you will first see the number of hosts and services you are monitoring. The third row shows Events. These only become relevant for you if you have configured the monitoring of messages. This means, for example, messages from syslog, SNMP traps and log files. For this, Checkmk has its own very powerful module, which will be discussed in detail in the article of the same name, the Event Console.
The right column shows the number of problems that have not yet been acknowledged. Problems are objects that are currently in WARN/CRIT/UNKNOWN or DOWN/UNREACH status. Acknowledgement is a way of 'taking note' of a problem. By the way, problems of services whose host is DOWN or in a scheduled downtime are not counted here.
You can click on the number in a cell to get a list of the objects that have been counted here. This works for all cells in the Overview, by the way.
In the Overview you can also decide whether you want to see less or more information.
With the ![]() button you can switch to the Show more mode:
button you can switch to the Show more mode:
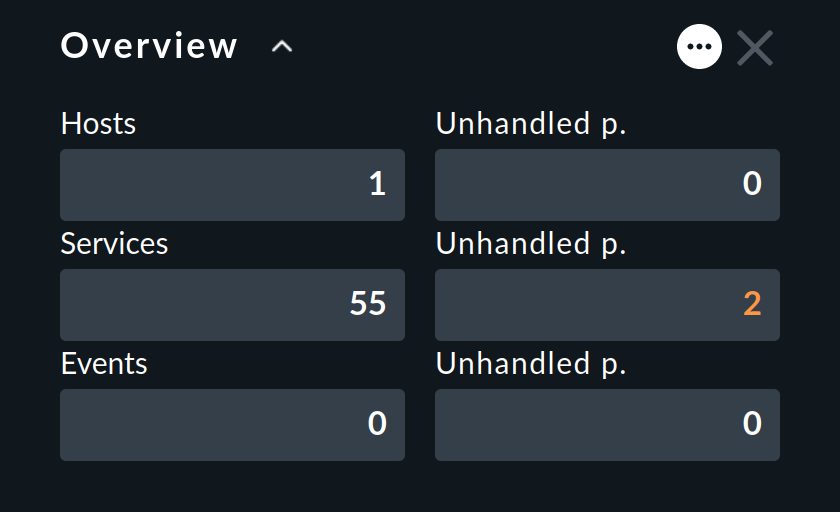
Between the two previously visible columns, the new second column now shows the count for all problems, i.e. with the addition of those that have already been acknowledged. In our example, the numbers in the second and third columns are identical because we have not yet acknowledged any problem.
Finally, the last column on the far right shows the hosts or services whose information is 'out of date' — Stale — because no up-to-date monitoring data is currently available for them.
If, for example, a host is not currently accessible, Checkmk cannot retrieve any information from its services.
However, this does not automatically mean that the services have a problem.
Therefore, Checkmk does not simply assume a new status for these services, instead it sets them to the pseudo status 'Stale'.
The column Stale will be omitted by Checkmk from the display if it would only show a 0 in all cases.
3. Monitor menu
Your basic toolbox for completing all monitoring tasks is the Monitor menu, which you can open via the navigation bar:
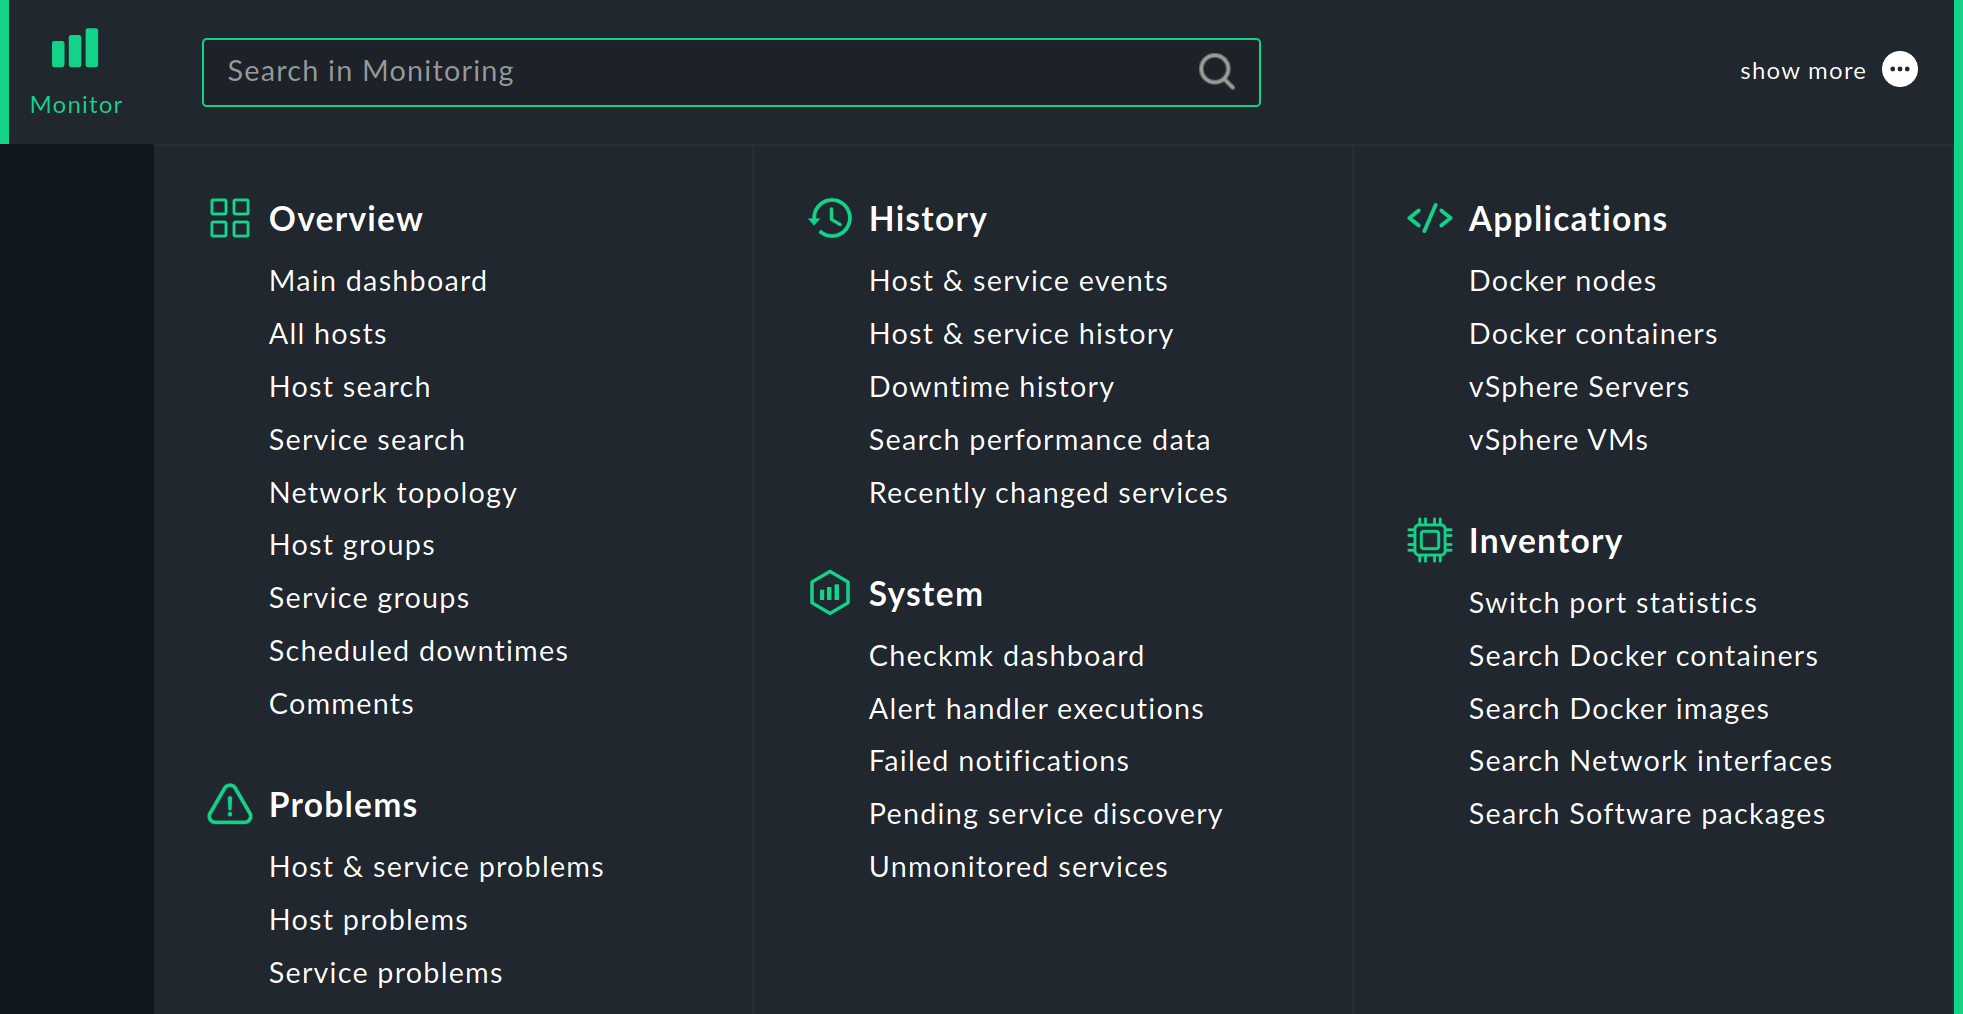
In this menu you will find the tools that will provide you with answers to your monitoring questions. The menu is subdivided according to topics. You will find the menu items listed below each topic.
After selecting one of the entries in the Monitor menu, the requested information is usually displayed on the main page either as a dashboard or as a view — each of which we will cover in more detail in this article.
Note: You can also load the contents of the Monitor menu into the sidebar — as a snapin with the title Views.
This snapin is not included in the sidebar by default.
But you can simply add it to the sidebar by clicking ![]() from the list of available snapins.
from the list of available snapins.
4. Dashboards
A dashboard presents the most important information on a topic on a single page, such as the answer to the question "What is the status of my Checkmk site?" Different visualizations of data are used and combined in a dashboard, such as views, history graphs, tables, diagrams and many other elements. The aim is to present the information from different perspectives to you in such a way that you can grasp the essentials quickly and are not distracted by unnecessary details.
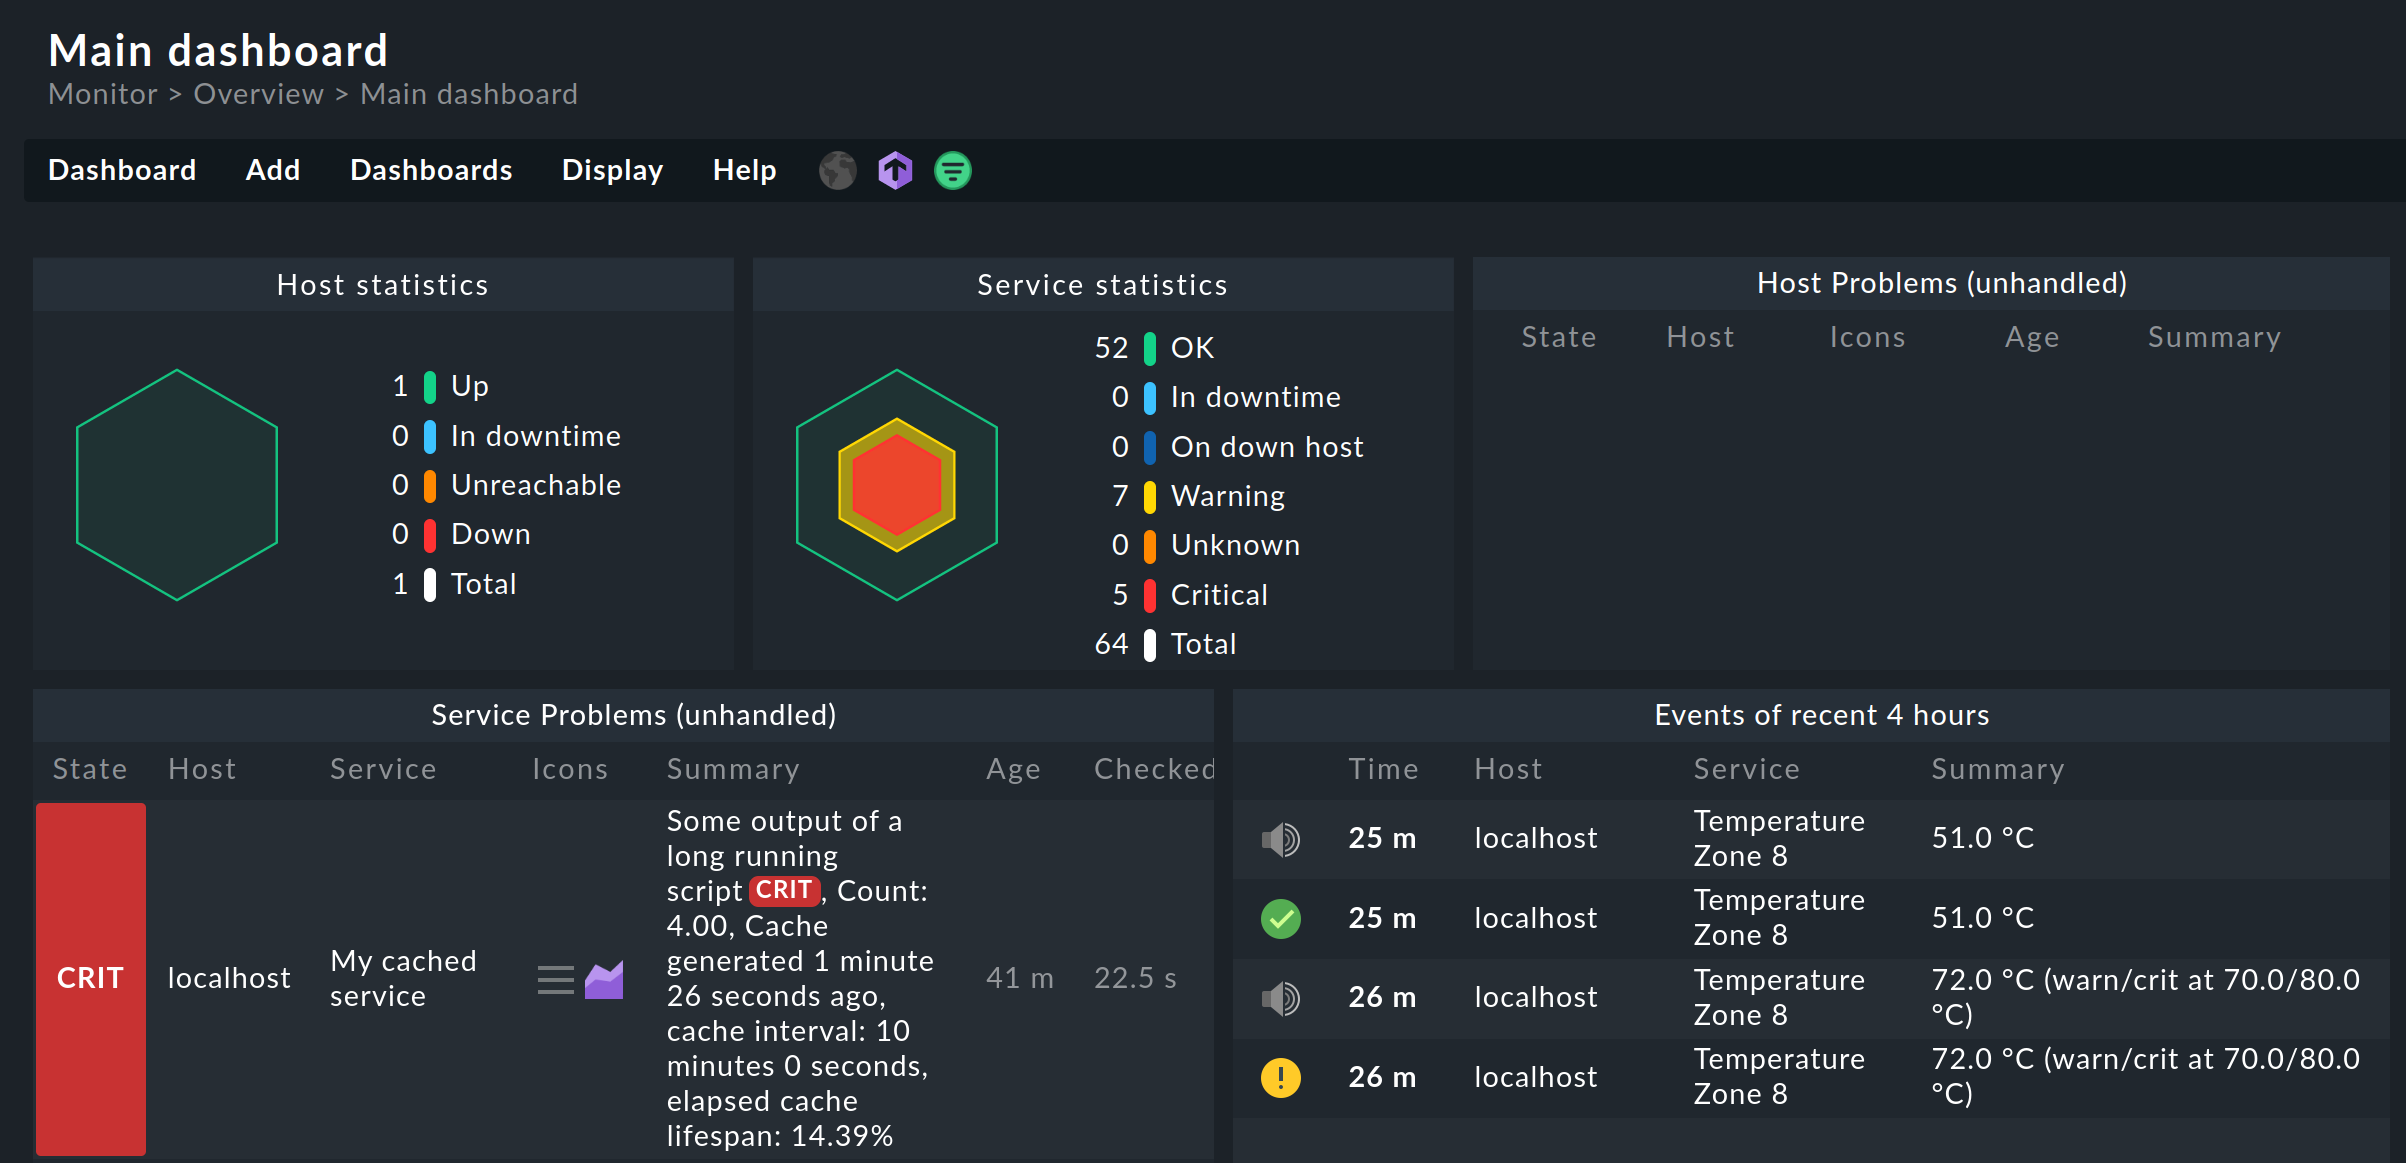
Checkmk provides several preconfigured dashboards that you can open from the Monitor menu: the Main and the Checkmk dashboard.
![]() The Enterprise Editions have a different Main dashboard than the Raw Edition.
The Main dashboard of the Raw Edition is the Problem dashboard of the Enterprise Editions.
The Enterprise Editions have a different Main dashboard than the Raw Edition.
The Main dashboard of the Raw Edition is the Problem dashboard of the Enterprise Editions.
If one of these dashboards is displayed, you can quickly switch to another: in the menu bar to the right of the Help menu you will find the icons for the available dashboards. You can also promote the currently displayed one to Main dashboard: in the menu Dashboard > Set as start URL.
A special feature of the Checkmk dashboards is that by using an intelligent algorithm they automatically adapt to the available screen dimensions and make optimal use of the screen size.
You can also use the individual elements of a dashboard, the so-called dashlets, to adapt existing dashboards and create new ones. You can learn all the relevant details for this in the article on the dashboards.
5. Views
A view offers access in monitoring to various displays of hosts, services or other objects under a certain perspective as a table.
Such a view can have a context — for example, if it shows all the services running on the mycmkserver host.
Other views work globally — for example, the view that shows you all the services that currently have a problem.
All the global views can be opened from the Monitor menu, below the respective topic, for instance All hosts, Service problems or Host & service events. After clicking on one of these menu items, the corresponding view is displayed in the main page — in the following example Service problems:
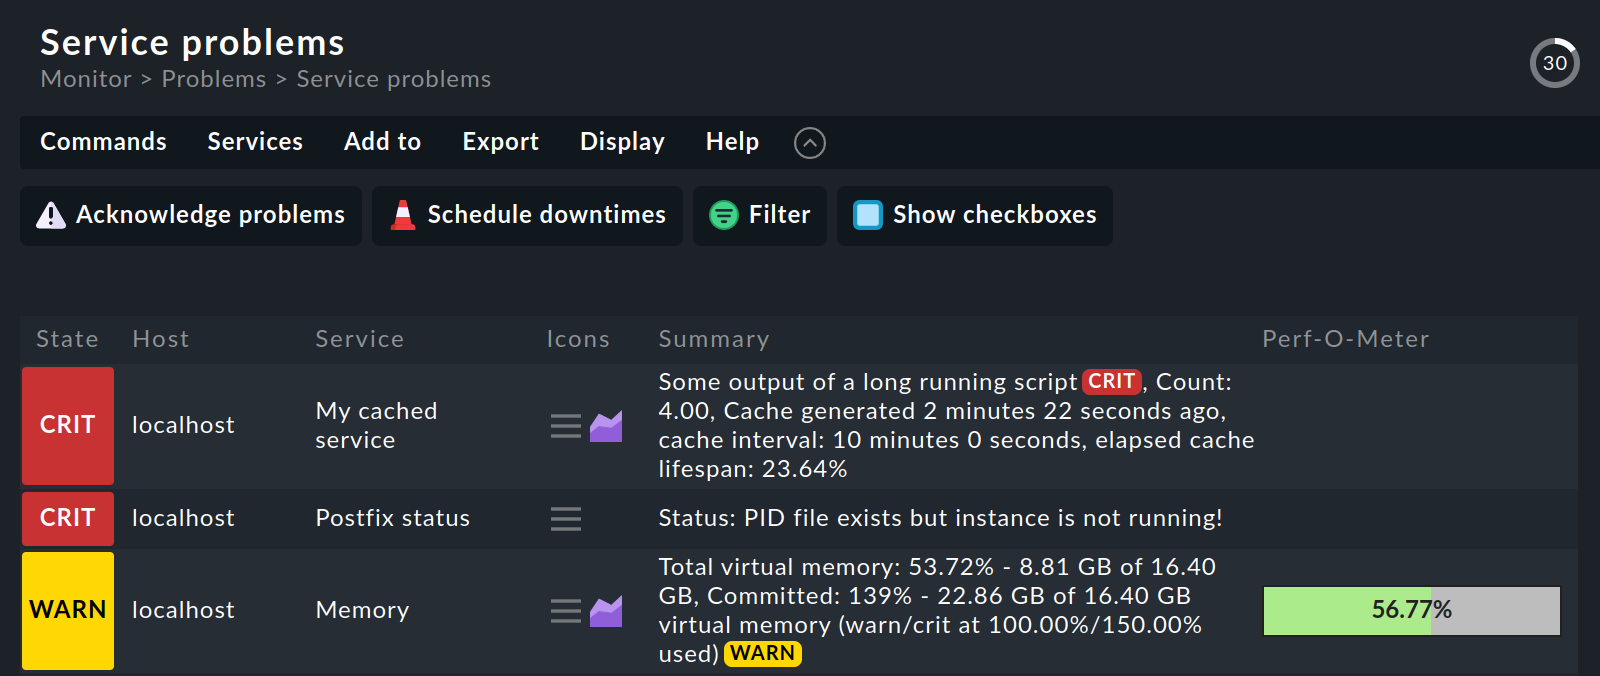
In a view you have numerous control options, among others:
You can navigate to other views by clicking on specific cells — such as the host name or one of the services in the above example.
By clicking on a column’s title, you can sort by that column.
The menu Display > Modify display options shows some settings for customizing the view. Number of columns lets you choose in how many tables the objects are displayed next to each other in the view (e.g. to make full use of your wide screen). In the example above the value is set to
1. With Refresh interval you can set the number of seconds after which the view is automatically reloaded — after all, status data can change at any time.You can reduce the number of table entries after clicking Filter with the filter bar — which is not really necessary in the example shown, but which is very helpful with long tables.
We will introduce the filter bar with a very simple example.
From the list of all services, we will filter out those with cpu in their name.
Click on the total number of services in the Overview.
On the main page, all services will then be displayed in the All services view.
Click the Filter button in the action bar.
The filter bar will appear on the right-hand side of the main page.
In the Service input field, enter cpu and click Apply filters:
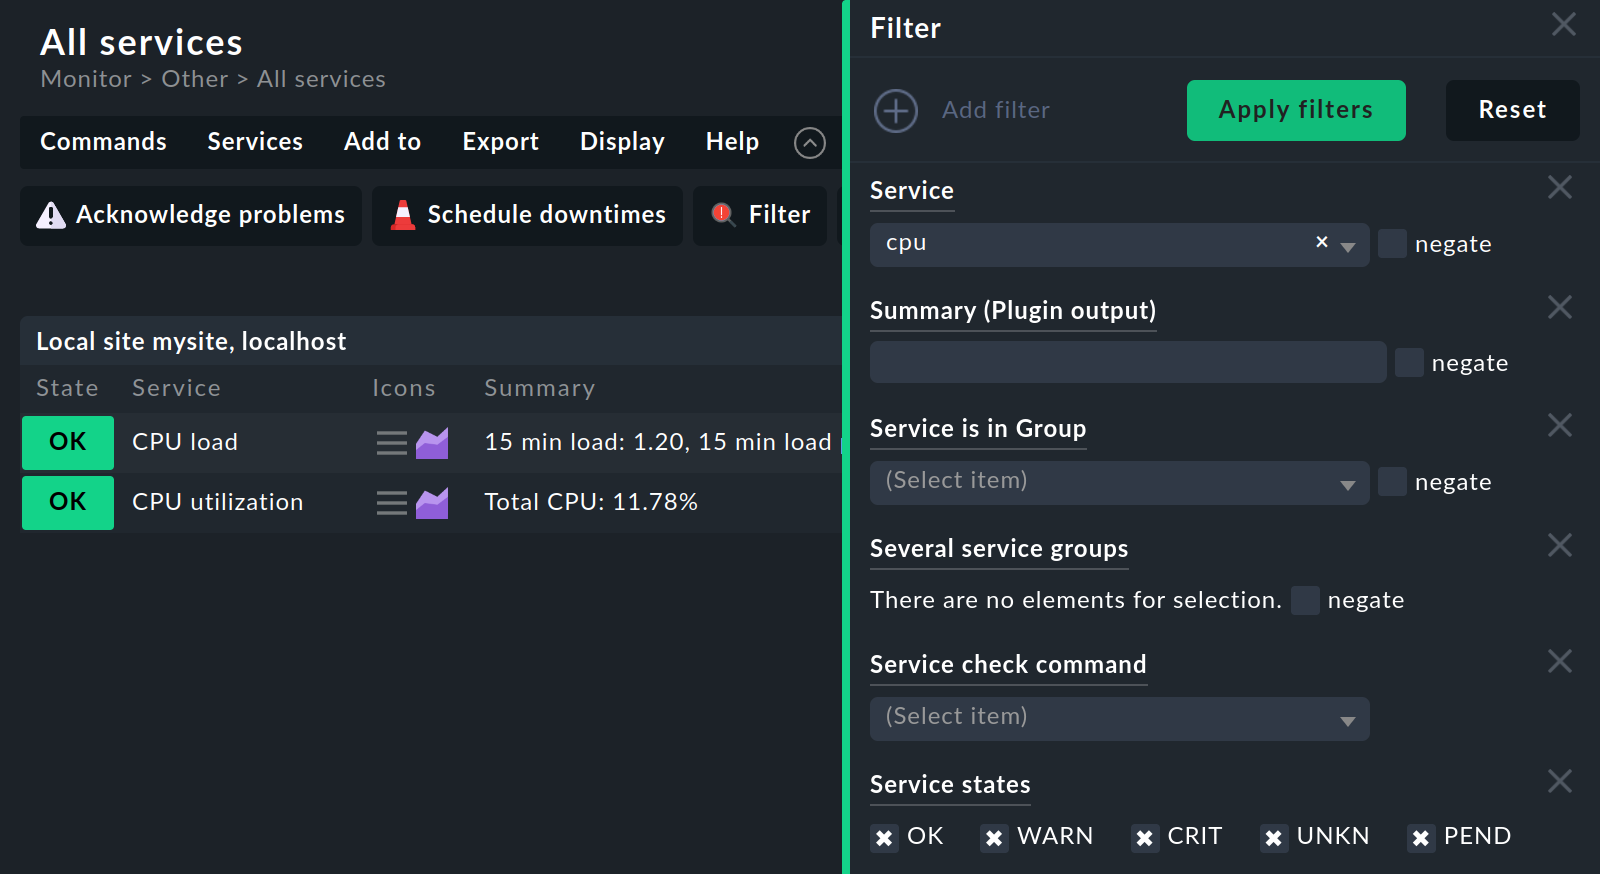
With the filter applied, we have reduced the number of displayed services to two.
The filter bar is a very powerful way of customizing views to meet your needs. The filter criteria are always context-specific and therefore match the content of the currently-displayed view. The example above shows only some criteria available for filtering services. If the default selection is not enough for you, you can use Add filter to show even more criteria and add them to the filter bar.
The filter bar is also used for the search items in the Monitor menu, such as Host search or Service search. When you select one of these search items, an empty view with an open filter bar is displayed in which you can search according to the filter criteria.
Once you have tailored the filter to show exactly what you are interested in, you can save this customized view as a bookmark — which brings us to the next topic: bookmarks.
Note: The views have many more possibilities — both for customization and for creating your own views. You can find out how to do this in the article on views.
6. Bookmarks
For pages that you visit again and again, you can create bookmarks in the sidebar with the Bookmarks snapin.
Do you really need these? After all, there are bookmarks in the web browser. Well, the Checkmk bookmarks have a couple of advantages of their own:
A called bookmark only changes the content on the main page without reloading the sidebar.
You can share bookmarks with other users.
When setting bookmarks, the re-execution of actions is automatically prevented.
At first, the Bookmarks snapin is still empty:

If you now click Add Bookmark, a new bookmark will be created for the content currently displayed on the main page:

Your personal bookmarks are stored under My Bookmarks.
If you want to go deeper into this subject, for instance, how to share a bookmark list with other users, you can do so in the article on the user interface.
7. Master control
In the Master control snapin on the sidebar, you can switch various monitoring functions off and on again individually, such as the Notifications. This latter is very useful if you are carrying out major modifications to the system and do not want to annoy your colleagues with unnecessary messages.
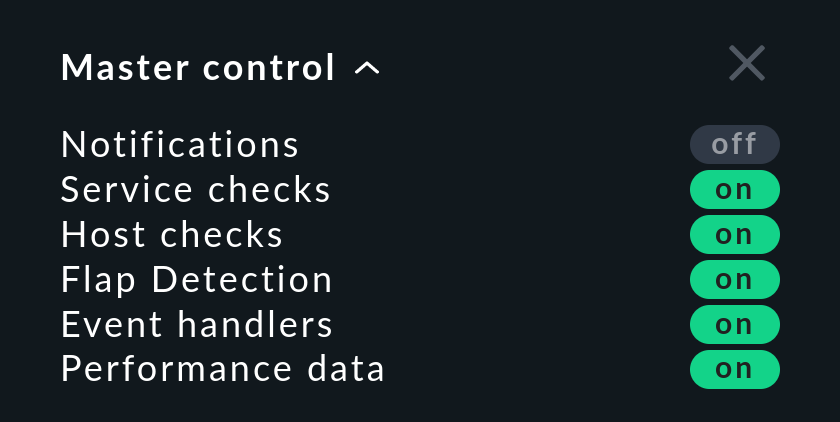
Important: Make sure that all switches are set to on during normal operation, otherwise important monitoring functions may be switched off.
8. Metrics
The vast majority of the services not only provide a status, but also metrics.
Let’s take the service that checks the file system C: on a Windows server as an example:

In addition to the OK status, we can see that approximately, of the file system’s total of 50 Gbyte, 38 Gbyte has been used — which is around 76 %. You can see this information in the Summary column. The most important value in this case — the percentage — is also visualized on the right-hand side in the Perf-O-Meter column.
But this is only a rough overview. A more detailed table of all the metrics for a service can be found by clicking on the service in its detailed view in the Service Metrics line:

But even more interesting is that by default Checkmk automatically retains the chronological sequence of all such metrics for up to four years — in the so-called RRD files. All values for the latest 48 hours are stored by the minute. The chronology is displayed in graphs like this one for the Check_MK service:
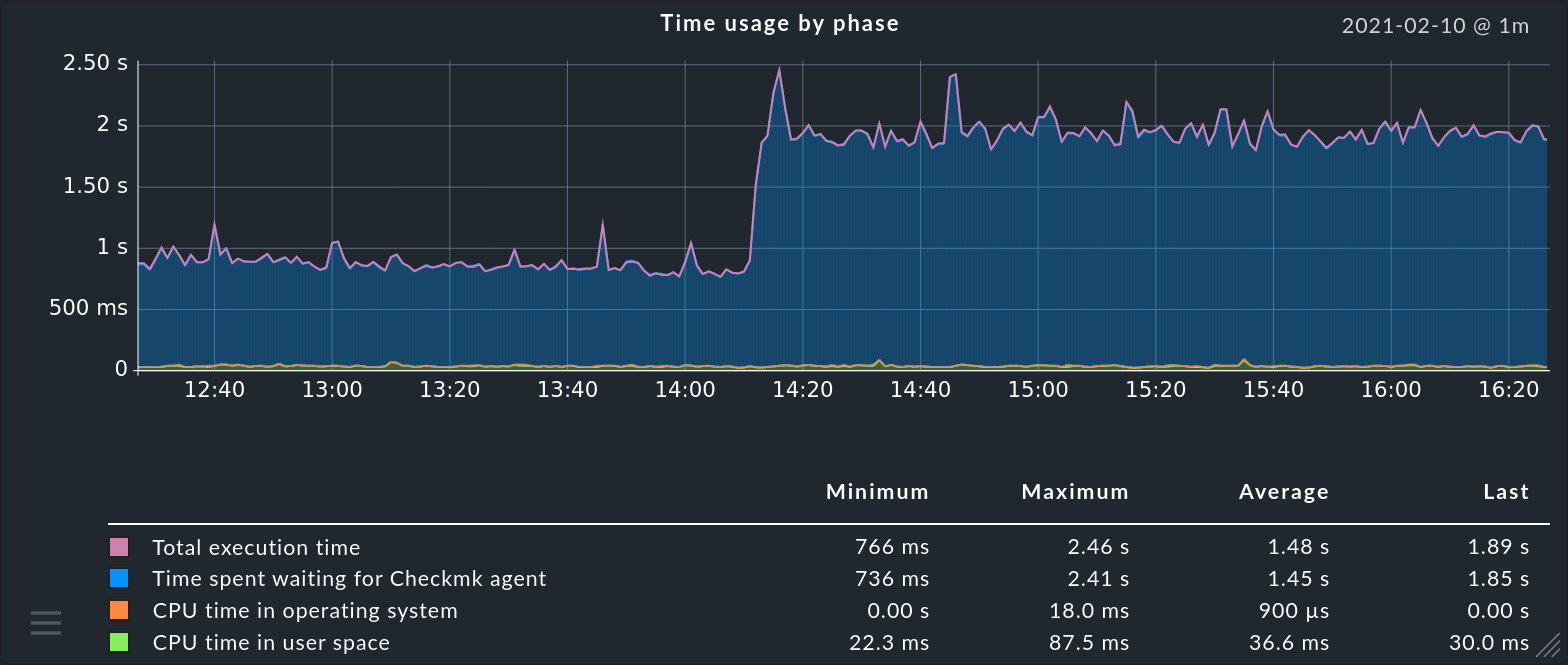
Here are a few tips for what you can do with these graphs:
Point the mouse cursor into the graph and a 'tooltip' will show the precise readings for the current time.
You can zoom into the timeline with the mouse wheel.
Click with the left mouse button anywhere on the graph and drag to the left or right to change the displayed time interval.
Drag up or down while holding the left mouse button to zoom into the vertical axis.
With the
 icon in the bottom right corner you can resize the graph.
The system for recording, evaluating and displaying metrics in Checkmk can do much more. Details on this can be found in the article on metrics.