1. Introduction
Checkmk provides many basic functions for monitoring your network infrastructure and delivers the associated metrics — such as bandwidth, packet rate or error rate. It also allows the monitoring of the state and speed of network interfaces and thresholds.
So far, so good. But what about the following questions — Who is communicating with your hosts? Which ports of your hosts are used? Who talks most often, i.e. who are the so-called 'top talkers'? Which applications are used in the network? Is my network performing well and where are the bottlenecks, if any? Are there threats, for instance from Distributed Denial of Service (DDoS) attacks?
To get answers to such and similar questions, a deep analysis of your network is necessary — which Checkmk alone cannot do. Here an analysis of the network flows is needed, i.e. the many communication relationships that take place simultaneously in the network. A network flow is defined by source and by destination (each determined by the IP address and port) and the protocol used.
Instead of adding the functions for in-depth network monitoring to Checkmk and thus reinventing the wheel, there is a more elegant solution — the integration of ntopng into Checkmk.
ntopng is the powerful and resource-efficient software for monitoring and analysing network traffic in real time as well as data from the past — so that it can provide the answers to the questions posed above. ntopng is the core of the open-source network traffic monitoring solution from the company ntop. In an ntop solution, data is usually collected from the devices via special software modules (nProbe) and forwarded to ntopng for analysis.
ntopng is related to Checkmk in more ways than one — it comes from and is rooted in the open source world. ntopng is available in a freely-available ('Community') and in several extended ('Professional' and 'Enterprise') versions. The user interface is web-based and offers the information in views and dashboards. Multiple users can be created and each user can be assigned a role. Alerting based on thresholds is supported. Lastly, the data can be fetched from ntopng via REST API.
The interaction of the products involved is shown in the following illustration:
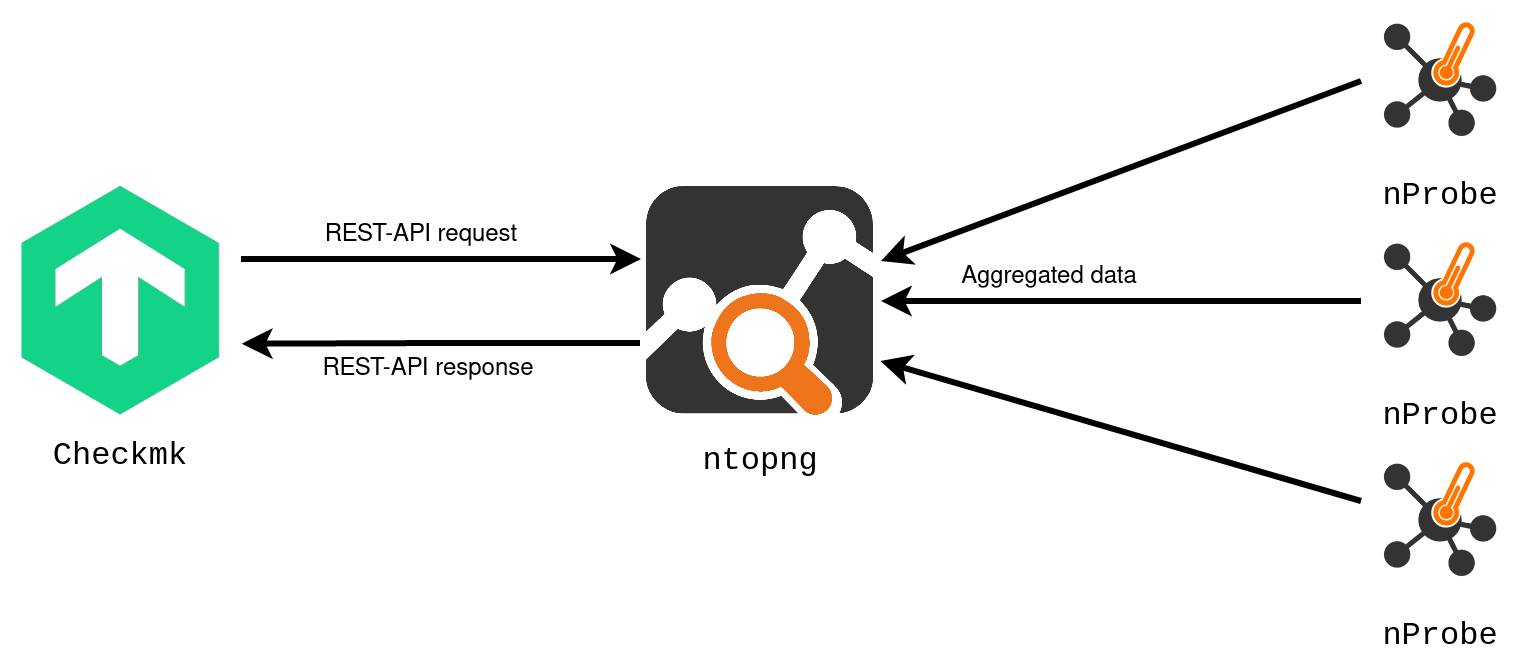
The integration of ntopng thus extends the functional scope of Checkmk by two important points — the monitoring of the network data flow, and the in-depth analysis of the network traffic.
In this context, integration means the following in concrete terms:
Checkmk and ntopng are installed and configured as independent systems on different servers. It is recommended that Checkmk and ntopng not be run on the same server.
A connection is established from the Checkmk server to the ntopng server. (Checkmk communicates with ntopng via its REST API.) The connection parameters are used to decide which data is fetched from ntopng. The assignment is made via the available user accounts of both systems.
Information from ntopng is displayed in the Checkmk user interface. This happens on the one hand in new views and dashboards in which the ntopng information is prepared for Checkmk users. On the other hand, ntopng data can be integrated into existing Checkmk views and dashboards.
2. Connecting to ntopng
![]() To use the integration of ntopng in Checkmk, you need an ntopng in a Professional or Enterprise version >= 4.2, as the ntopng REST API V1 that Checkmk and ntopng use to communicate is only supported from version 4.2 onwards.
To use the integration of ntopng in Checkmk, you need an ntopng in a Professional or Enterprise version >= 4.2, as the ntopng REST API V1 that Checkmk and ntopng use to communicate is only supported from version 4.2 onwards.
First collect the following information about the ntopng target system you want to connect to Checkmk. You must enter this information into Checkmk as ntopng connection parameters:
| Parameter | Description |
|---|---|
Host name |
The name or IP address (Host Address) of the ntopng server |
Port number |
The number of the TCP port (Port number), over which ntopng can be reached. The port is specified when ntopng is started. The default is |
Protocol |
|
User account for authentication |
Name and password of a user account of the ntopng user group Administrator (ntopng Admin User). Checkmk authenticates with the ntopng server using these credentials via the REST API. By the way, the default user account of ntopng is called |
In Checkmk, start entering the ntopng connection parameters in the Setup > General > Global settings > Ntopng (chargeable add-on) > Ntopng Connection Parameters (chargeable add-on) menu:
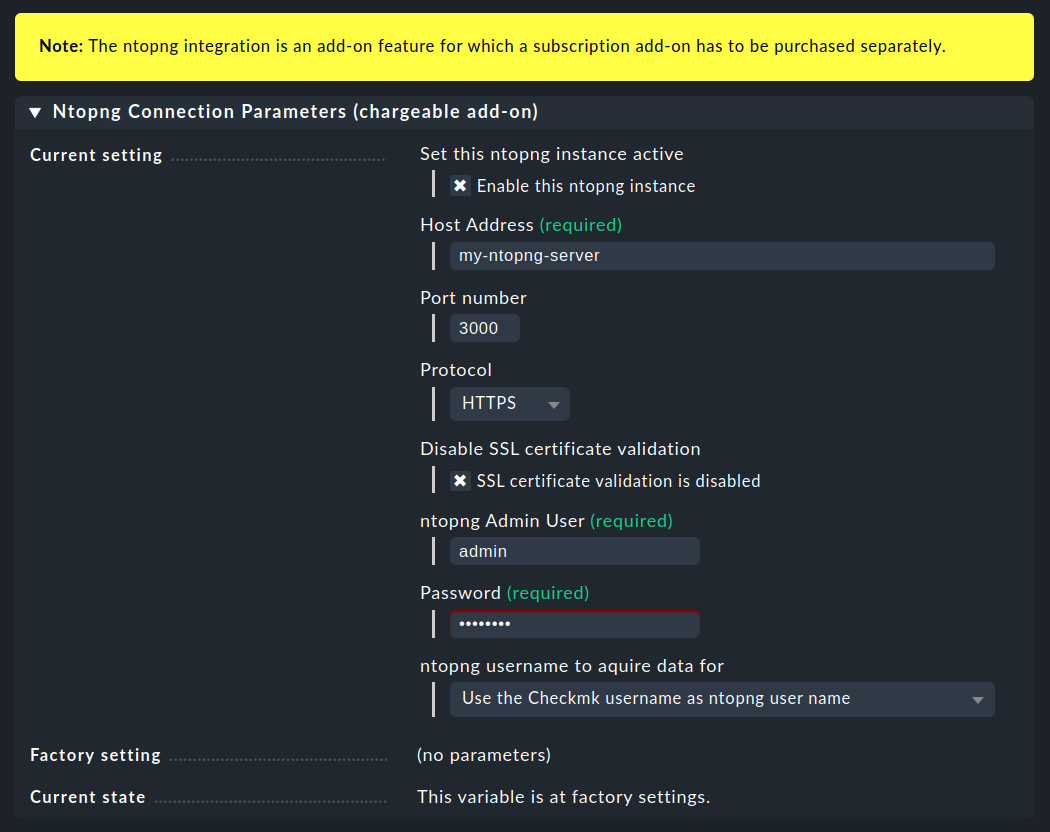
You will have obtained most of the requested parameter values by now and can therefore take them from the table above. We only need to take a closer look at one of the connection parameters: ntopng username to aquire data for. This determines who can see which ntopng data in Checkmk. The user accounts with which Checkmk authorises itself with ntopng and with which Checkmk fetches data from ntopng are defined differently. We explain the choices and the resulting differences in fetching the data in the following two chapters.
Note: The entries for the connection to ntopng are not checked for validity when saving. You will not receive error messages about invalid values until the display of ntopng information. With the first ntopng connection parameter Enable this ntopng instance you can deactivate the connection to ntopng, for instance if the ntopng server is temporarily unavailable.
2.1. Fixed assignments of Checkmk and ntopng users with the same name
The simplest solution is to give a Checkmk user access to the information he sees in ntopng under the same user name.
To do this, select the value Use the Checkmk username as ntopng user name for the parameter ntopng username to aquire data for. Checkmk will then use the current Checkmk username and retrieve the data from ntopng under that name.
For data retrieval to work via this assignment, at least one user account with the same name must exist in both Checkmk and ntopng. No matter how you think about it, it will probably be necessary to change the users in Checkmk, ntopng or even in both systems. How to create or change a user in Checkmk is explained in the article on user administration.
After you have activated the changes, all Checkmk users will see the user interface changes for ntopng as described in the chapter on displaying the ntopng information, for example the extension of the Monitor menu. However the ntopng data will only be visible to those Checkmk users who have a user account on the ntopng counterpart. The other Checkmk users will be able to open the ntopng-specific pages, but will only receive blank pages or an error message that the login data is invalid.
This is the simplest option, but also an inflexible one.
2.2. Flexible assignment of Checkmk users to ntopng users
Checkmk and ntopng have similar concepts in their user administration — both systems can have multiple users, and each user is assigned a role. In Checkmk these roles are called Administrator, Normal monitoring user and Guest user, while ntopng has the Administrator and Non Privileged User roles. These assigned roles are used — among other functions — to decide which information a user can access.
Instead of the rigid 1:1 assignment described above, you have the option of deciding for each Checkmk user whether you want to give them ntopng data and — if so — from which ntopng user they should receive it.
Since the users are assigned different roles in both systems, you can control very precisely who is allowed to see what of ntopng in Checkmk, for example like this: You do not assign an ntopng user to a Checkmk Guest user who is not interested in network traffic, so the ntopng-specific extensions of the Checkmk interface are hidden for this user. Assign an ntopng Non Privileged User to a Checkmk Normal monitoring user and a network trainee. Assign an ntopng Administrator to a Checkmk Administrator and network expert.
The procedure for flexible allocations is as follows:
In the Ntopng Connection Parameters (chargeable add-on) select the value Use the ntopng username as configured in the User settings for the ntopng user name to aquire data for.
After you have saved the ntopng connection settings, a new field will appear in the settings of each user (Setup > Users > Users) under Identiy, e.g. as shown below for the user cmkadmin:
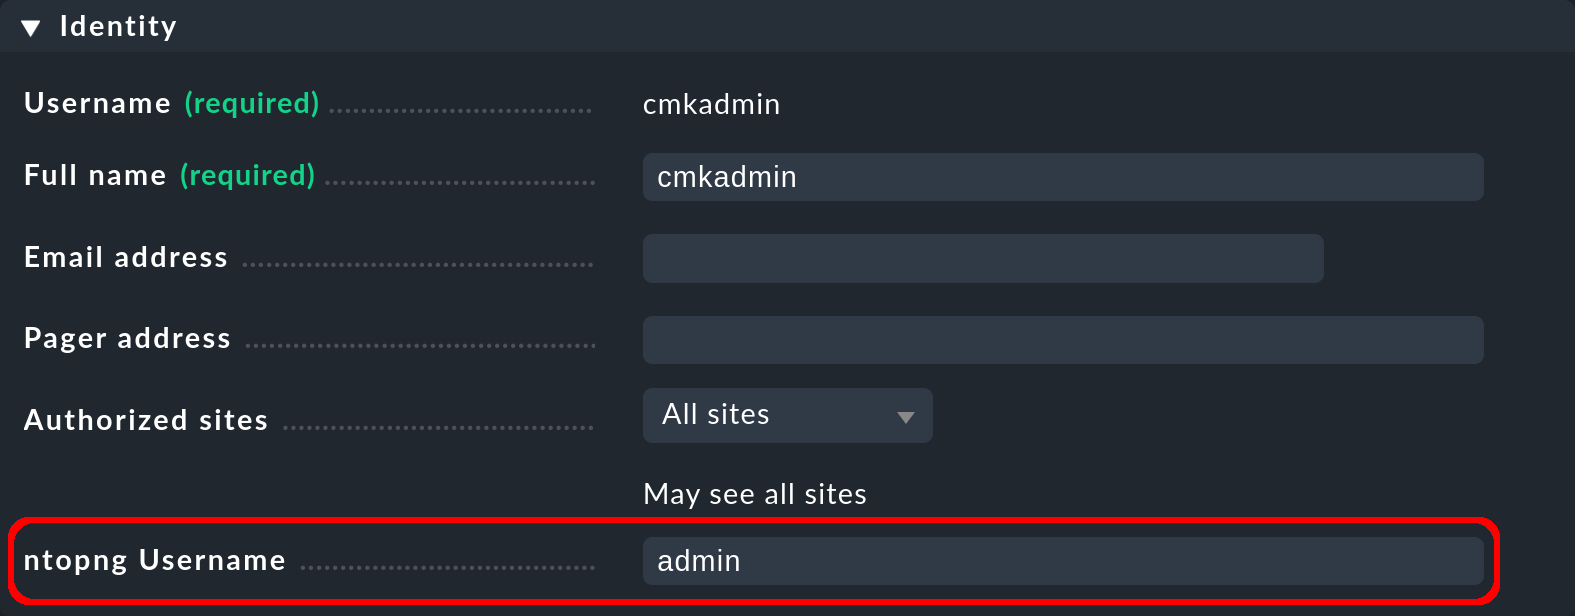
In the ntopng Username field, enter the ntopng user name whose information is to be displayed to the current Checkmk user. If this field is left empty (which is the default), the ntopng-specific extensions of the Checkmk interface are hidden for the Checkmk user. Finally, activate the changes.
3. Displaying the ntopng information
Once the requirements described in the chapter connecting to ntopng have been met, you will now have access to the ntopng data in Checkmk. To do this, log in to Checkmk under a user account that is assigned to an ntopng user account.
The following is an overview of where and how you can access the ntopng information in the Checkmk user interface.
3.1. Network statistics in the Monitor menu
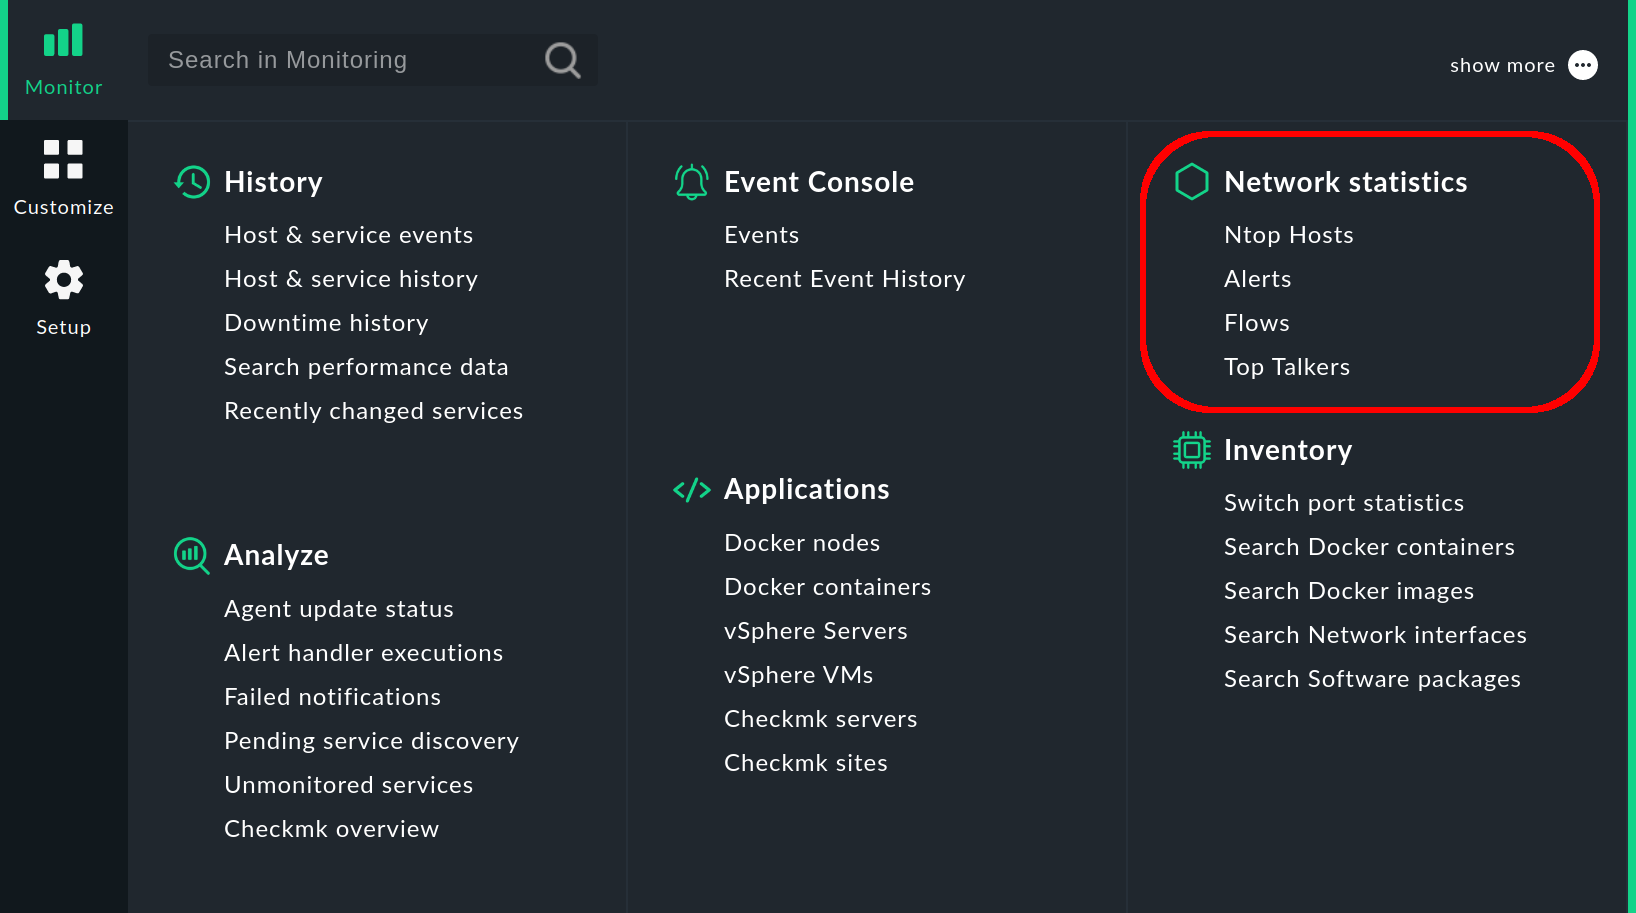
The most noticeable change can be found in the Monitor menu, which contains the new Network statistics topic with entries for a view and several dashboards with ntopng data, which we will introduce in the next chapters.
3.2. The Ntop Hosts view
Checkmk and ntopng manage not only their users but also their hosts independently. However, if a host in Checkmk is also set up in ntopng, it will be displayed in the Ntop Hosts view, which thus shows the intersection of Checkmk and ntopng hosts.
Select Monitor > Network statistics > Ntop Hosts:
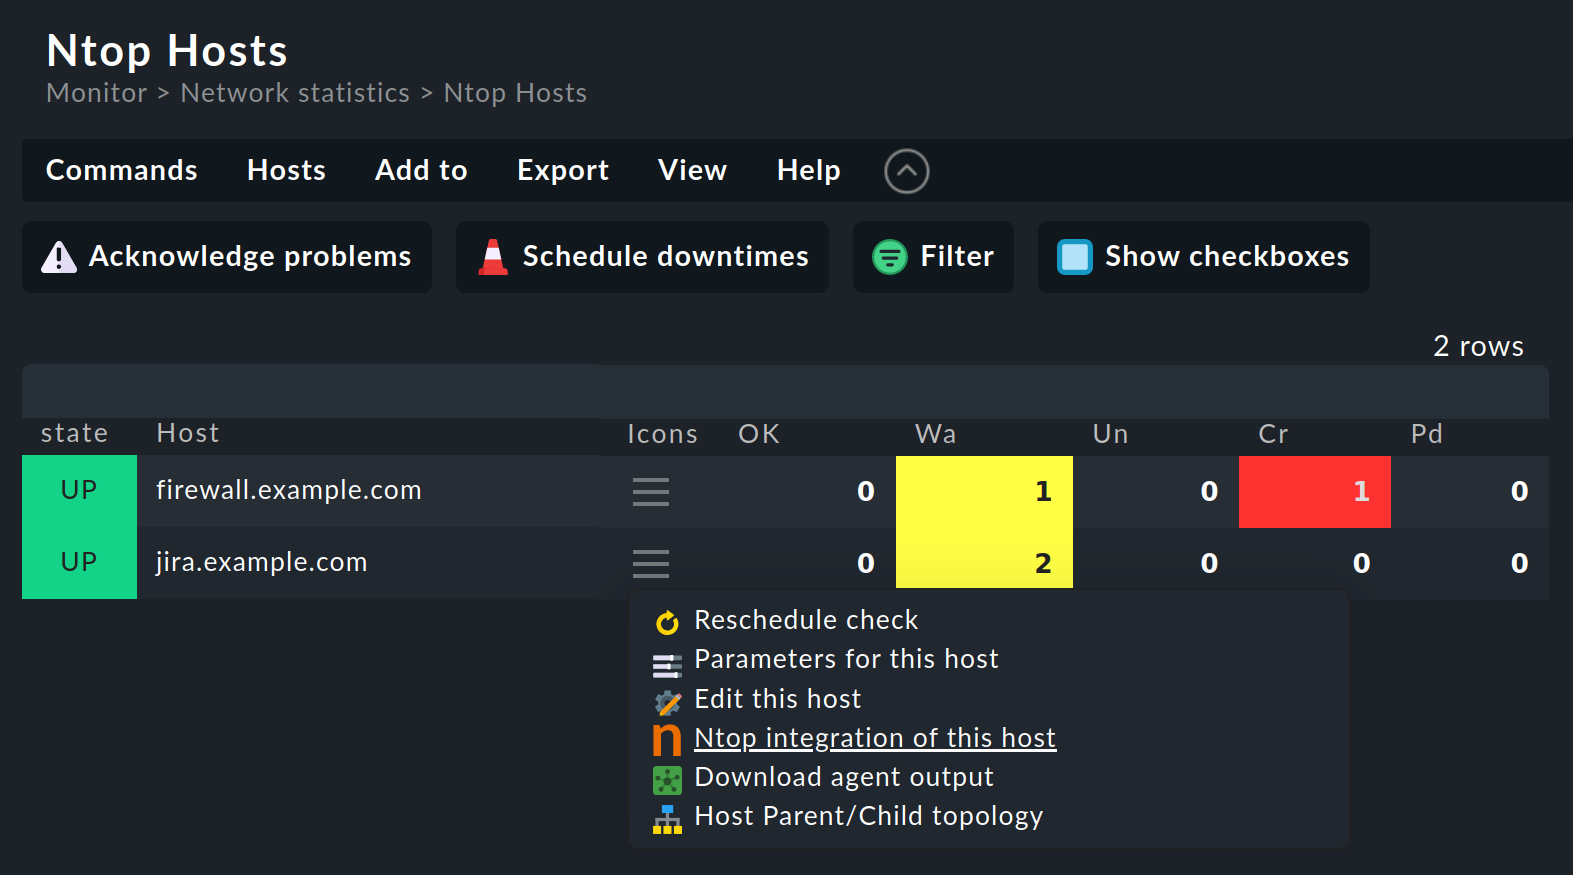
The Ntop Hosts view provides a quick overview of all hosts that are set up in both systems. In the example above, there are two common hosts. One ntopng host shows the entry Ntopng integration of this host in the action menu. By the way, this entry is not only available in this but also in all other host views in the monitoring, for instance in the All hosts view.
3.3. Network statistics for a host
For an ntopng host, click the action menu item Ntopng integration of this host and you will get the host-specific page Network statistics and flows:
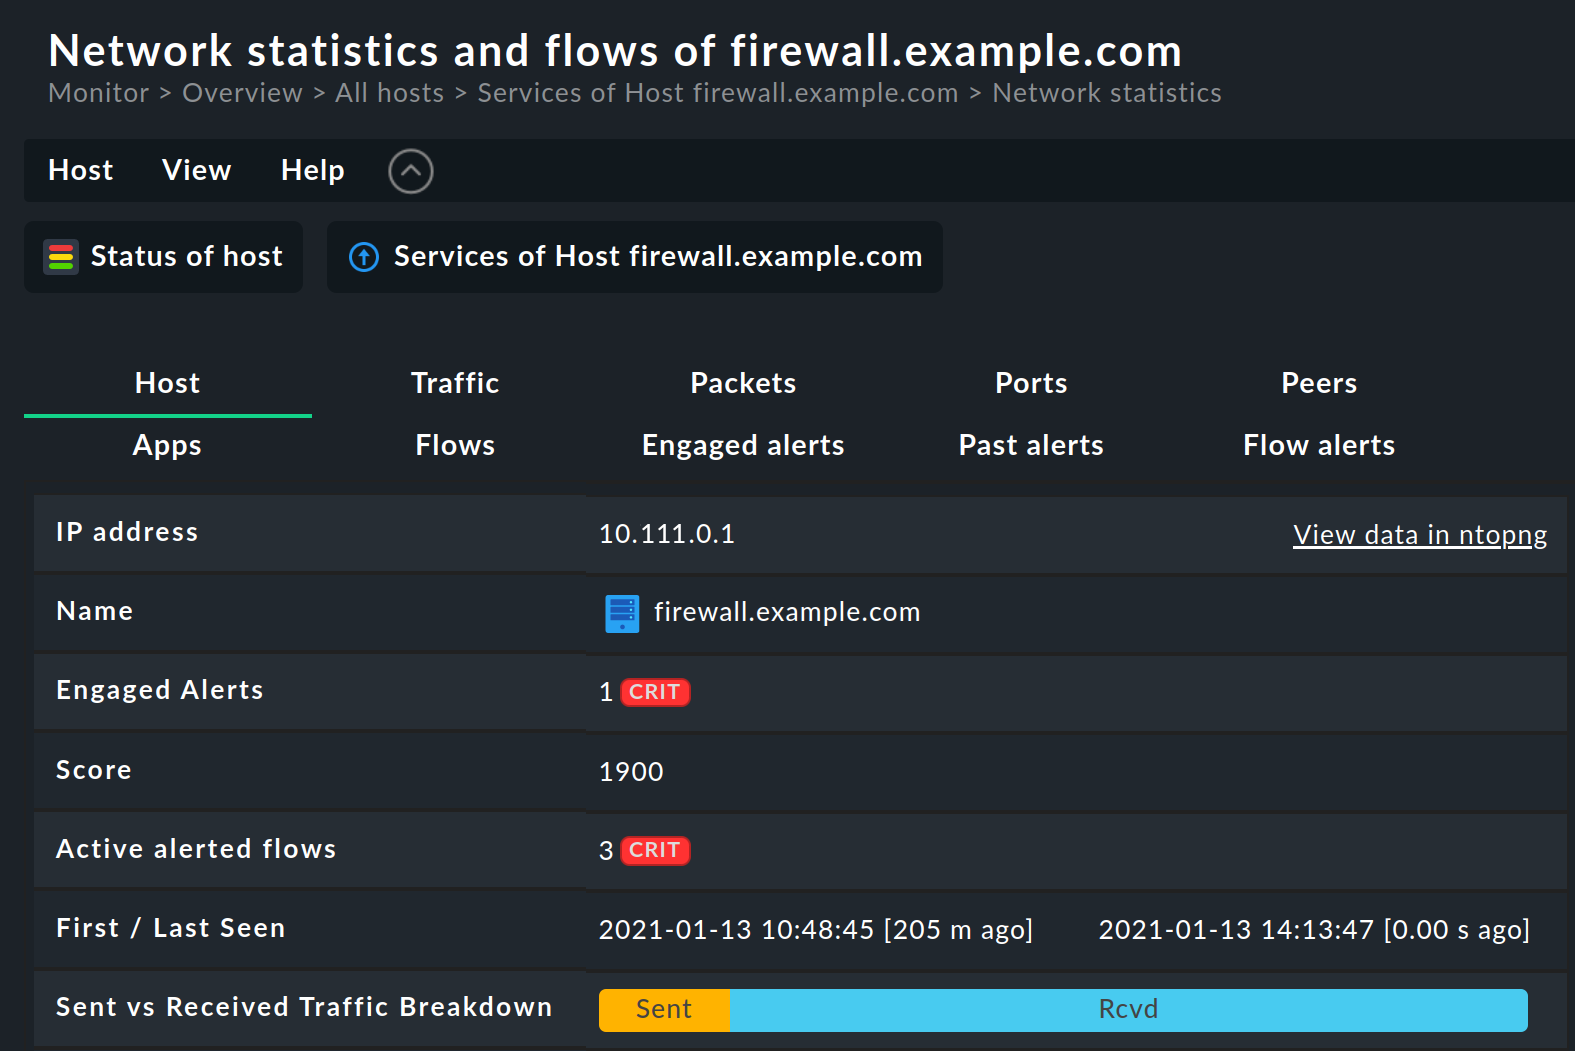
On this page, the network data from the selected host is presented from different perspectives under the following tabs:
Host: Basic information for the host and a summary of the most important information from the other tabs
Traffic: Information on the layer 4 protocol (TCP and UDP) for an overview as a pie chart and detailed as a table
Packets: Distribution of flags in TCP connections. Flags indicate a certain state of the connection or provide additional information. The most frequently used flags are SYN (synchronisation), ACK (acknowledgement), FIN (finish) and RST (reset).
Ports: Traffic statistics grouped by client and server ports
Peers: An overview of the most frequently contacted peers (meaning partners) and the most frequently used applications — as graphics and a table. The graphic elements can be filtered by clicking on them.
Apps: Amount of traffic divided by applications and summarised categories. The layer 7 applications are determined by a deep packet inspection. In the application table, the application names are linked and lead to an ntopng page with detailed information.
Flows: Table of the data flows that have the selected host as a start or end point. For more information, see the chapter Flows Dashboard.
Engaged Alerts, Past Alerts, Flow Alerts: tables of active alerts, past alerts and flow alerts. For more information, see the chapter Alerts Dashboard.
In each tab, you can use the View data in ntopng link to access the associated ntopng page, which will take you to the ntopng Host Details.
Tipp: You can also access the Network statistics and flows page from the Services of Host and Status of Host views by selecting the tab that opens the page. Both views, when called for an ntopng host, provide the ntop menu in their menu bar, which contains entries for each individual tab.
3.4. Status of a host
On the Network statistics and flows page, click Status of host in the action bar to open the Status of Host view.
In this view a wide variety of host-specific information is displayed in a table, which can be extended by ntopng-specific entries. This will show information that you are already familiar with from some of the tabs on the Network statistics and flows page — partly due to lack of space, however, only a selection of this information will be displayed.
To use the ntopng-specific entries, you must Customise the view. In the menu, select Display > Customize view. On the Clone view page, the columns of the table contents can be defined.
You can add the following ntopng-specific entries:
Hosts: Ntop hosts details: Shows the most important information under the Host tab.
Hosts: Ntop protocol breakdown: Shows the log table in the Traffic tab.
Hosts: Ntop ports: Shows the client and server pie charts of the Ports tab.
Hosts: Ntop top peers: Shows the application pie chart of the Peers tab.
3.5. The Alerts dashboard
The Alerts dashboard gives you an overview of all alerts in ntopng.
Select Monitor > Network statistics > Alerts:
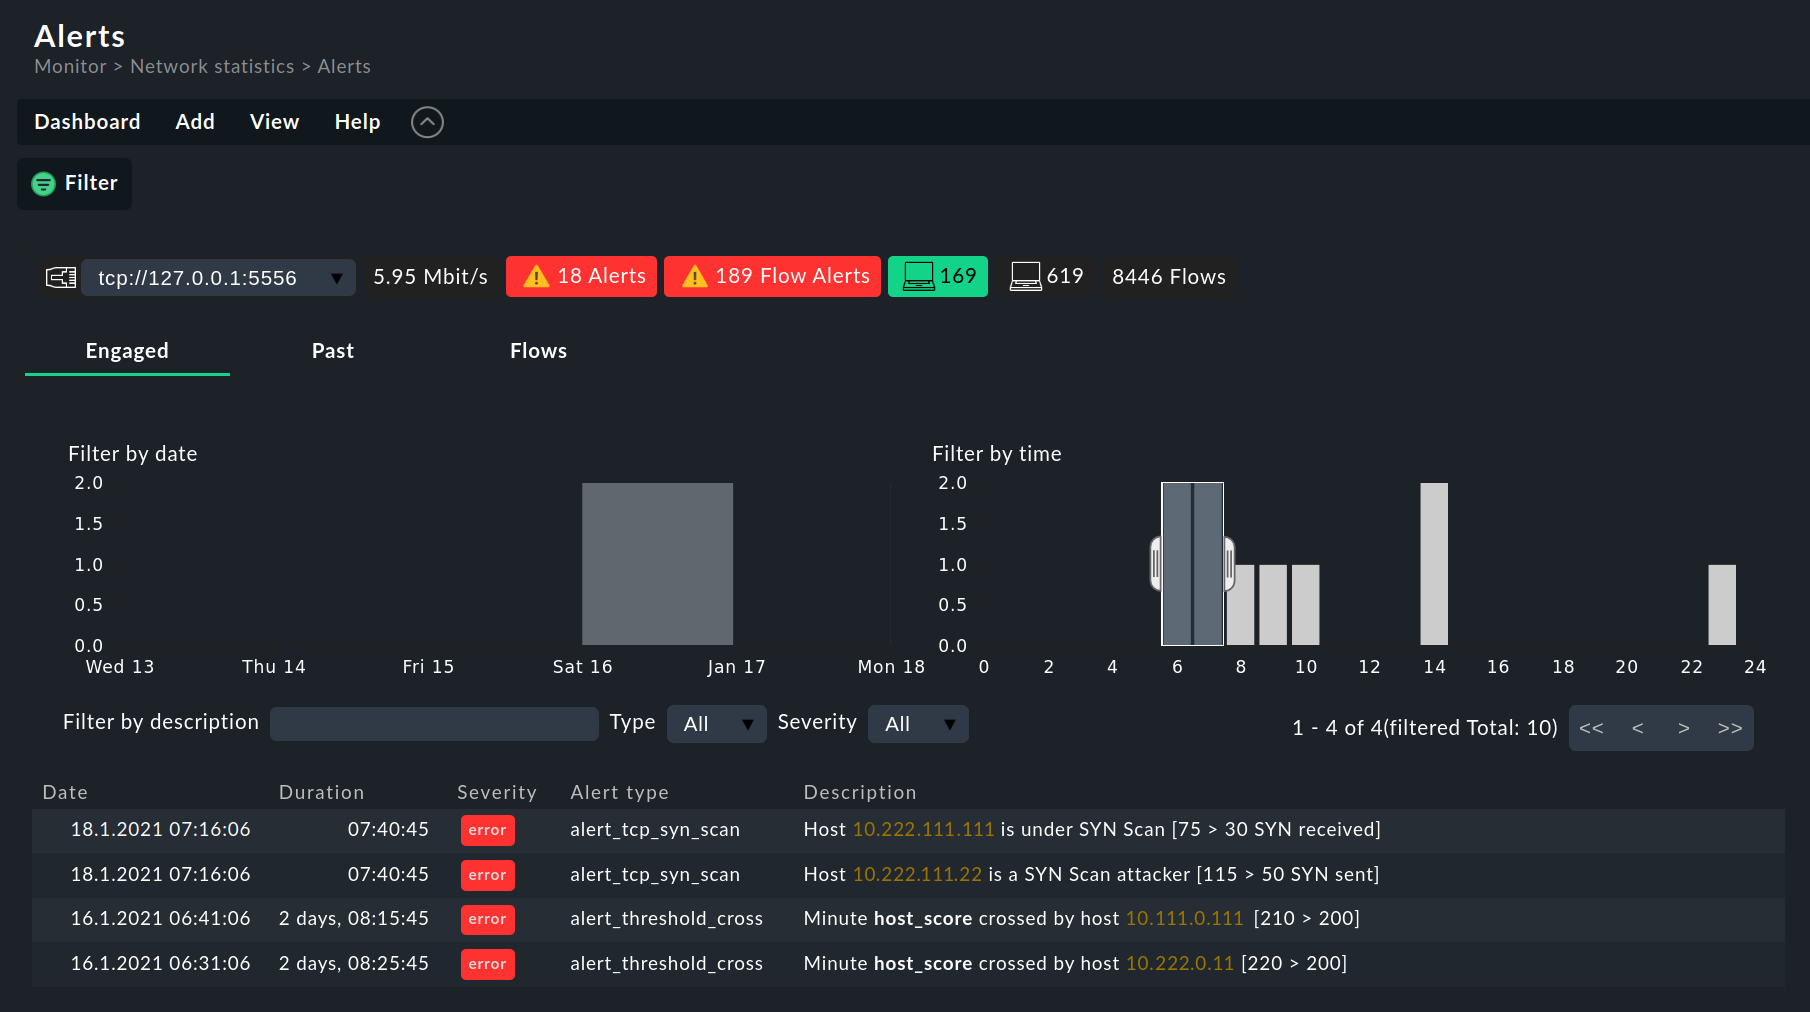
The first line shows a summary of all hosts set up in ntopng, with the number of current alerts (Alerts and Flow Alerts).
You can switch between the alert tables with the following tabs:
Engaged: Table of active alerts (engaged alerts). ntopng generates alerts to report the exceeding of thresholds.
Past: Table of old alerts that are no longer active (past alerts).
Flows: Table of flow alerts, a special category in which ntopng reports abnormal or suspicious flows. Flow alerts are always linked to events. They are collected in their own category and do not appear in the tables of active or past alerts.
In all tabs, there are two bar charts above the table with a breakdown by date and time, which you can use to filter the table: By dragging with the mouse, select a time interval in one diagram — or successively in both. The filter defined in this way is immediately applied to the alert table. To switch off the filter, click outside the marking in the diagram.
Note: This dashboard is similar in structure to the three alert-specific tabs on the Network statistics and flows page (see the chapter Network statistics for a host).
3.6. The Flows dashboard
The Flows dashboard gives you an overview of the data flows in ntopng. A data flow is a connection via the Layer 4 Protocol between the starting point and the end point, each determined by IP address and port. A data flow can only be displayed after the data transmission has been completed. For this reason the display of data flows is always a look into the past — even if it was only a few seconds ago.
Select Monitor > Network statistics > Flows:
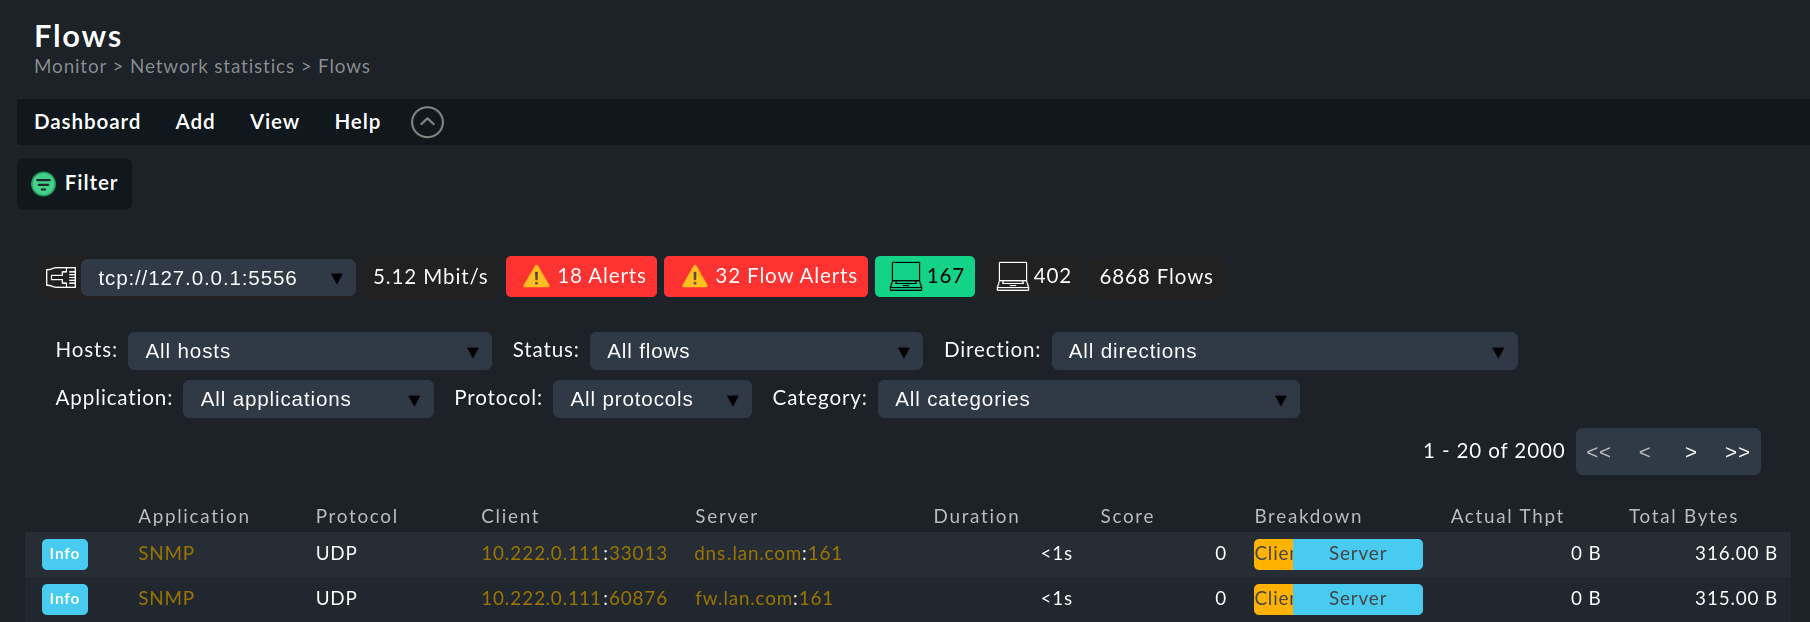
The first line, as with the Alerts dashboard, shows a summary for all of the hosts set up in ntopng.
The table is essentially identical to the Flows table in the ntopng interface.
Note: This dashboard is similar in structure to the Flows tab on the Network statistics and flows page (see the chapter Network statistics for a host).
3.7. The Top Talkers dashboard
The Top Talkers dashboard shows you in real time which hosts in ntopng are generating the most network traffic.
Select Monitor > Network statistics > Top Talkers:
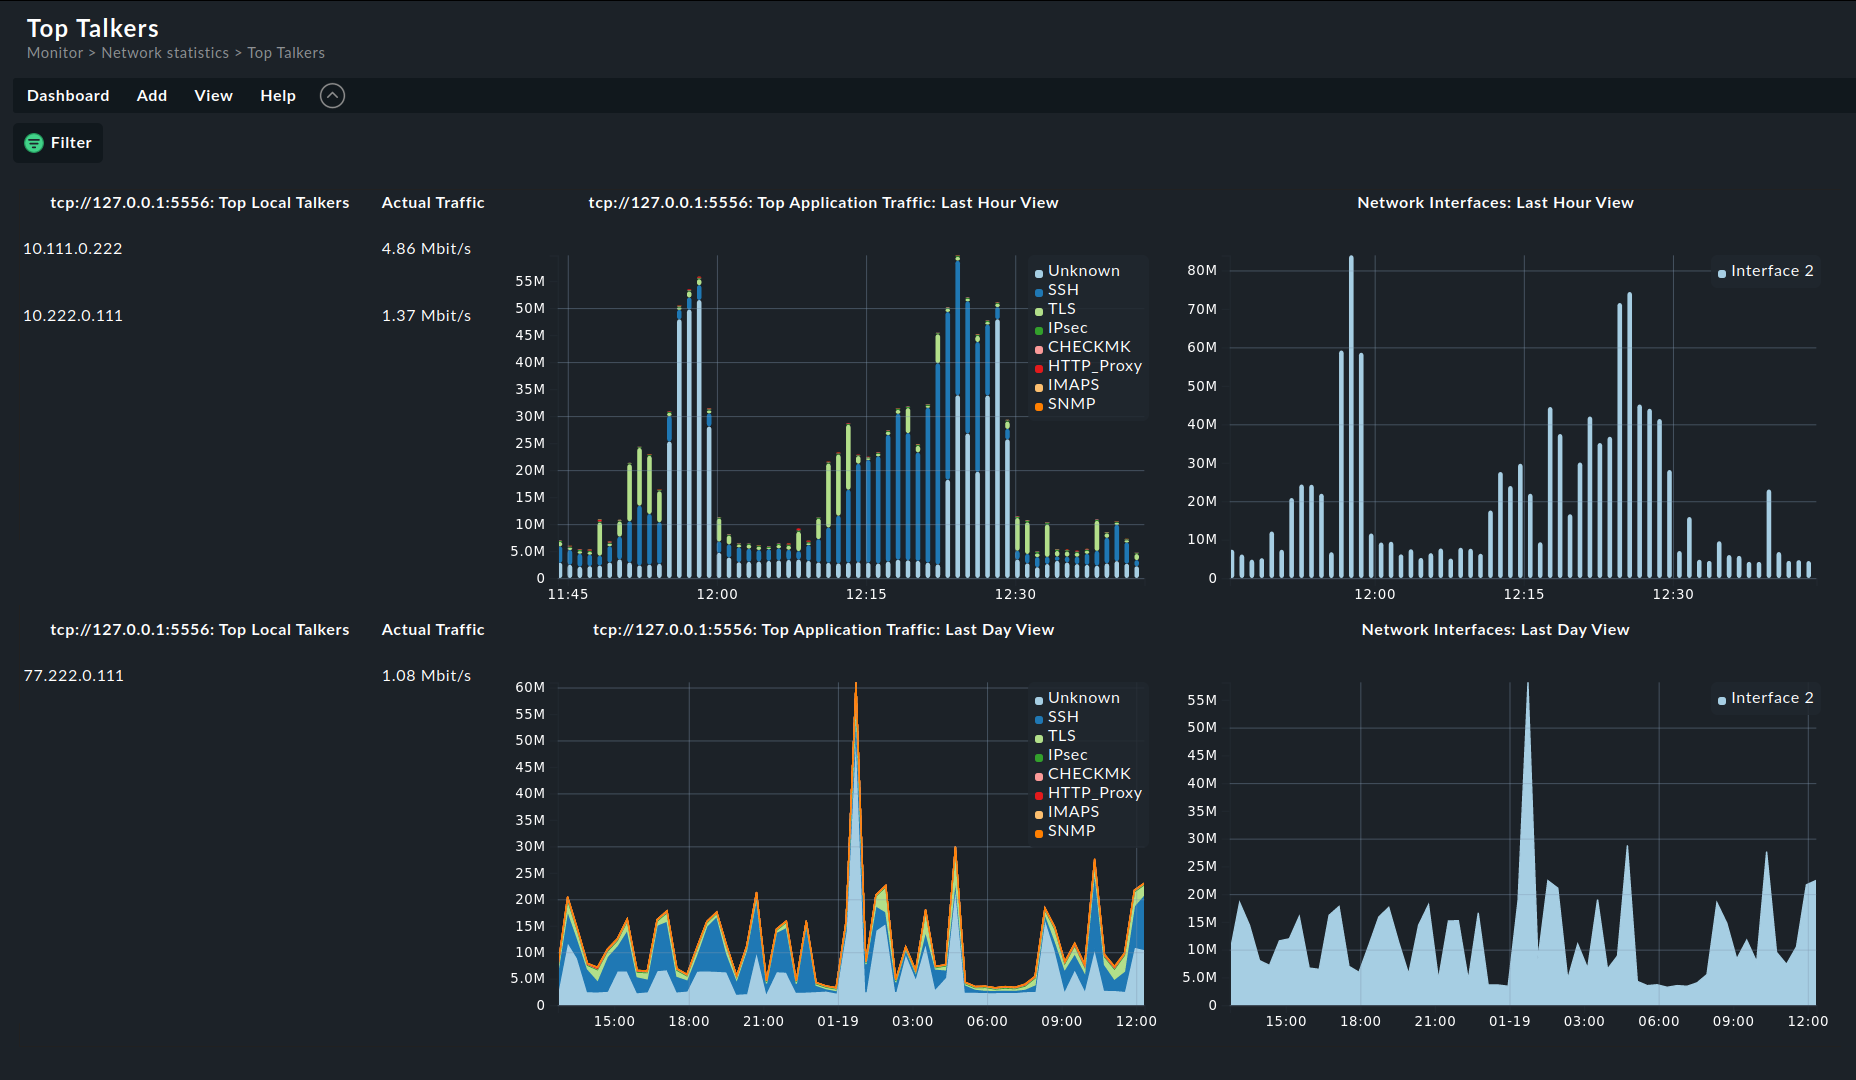
In the left part of the dashboard, the current 'Top Talkers' are listed, sorted by the volume of the data traffic they are exchanging. The upper section shows the hosts in the local network, the lower section the destinations in remote networks.
In the diagrams you also get an overview of the data traffic in the applications (left) and the monitored interfaces (right), during the last hour (top) and for the preceeding 24 hours (bottom). The entries in the legend displayed in each diagram are clickable and can be used to filter the data.
Note: This dashboard is similar in structure to the Traffic Dashboard in the ntopng interface.
3.8. Dashlets
The Alerts, Flows and Top Talkers dashboards presented in the last chapters all consist of only one dashlet each.
When editing a dashboard, you can use these ntopng dashlets to customise existing dashboards or to create new ones. You can get started with the dashboard configuration in the Dashboards > Customize Dashboards menu. When editing a dashboard, you will find the ntopng dashlets, as well as the other dashlets, in the Add menu.