1. Introduction
Once your Checkmk server has been set up and configured, sooner or later questions will come up: Can the configuration be performed more quickly? Can it be optimized? Can the system be made more secure?
One approach to answering these questions is to review and consequently optimize the site setup on the Checkmk server. The more performant your system is, the faster and more effectively it works. So the more reliably you can secure your site, the more confident you can be when working with it.
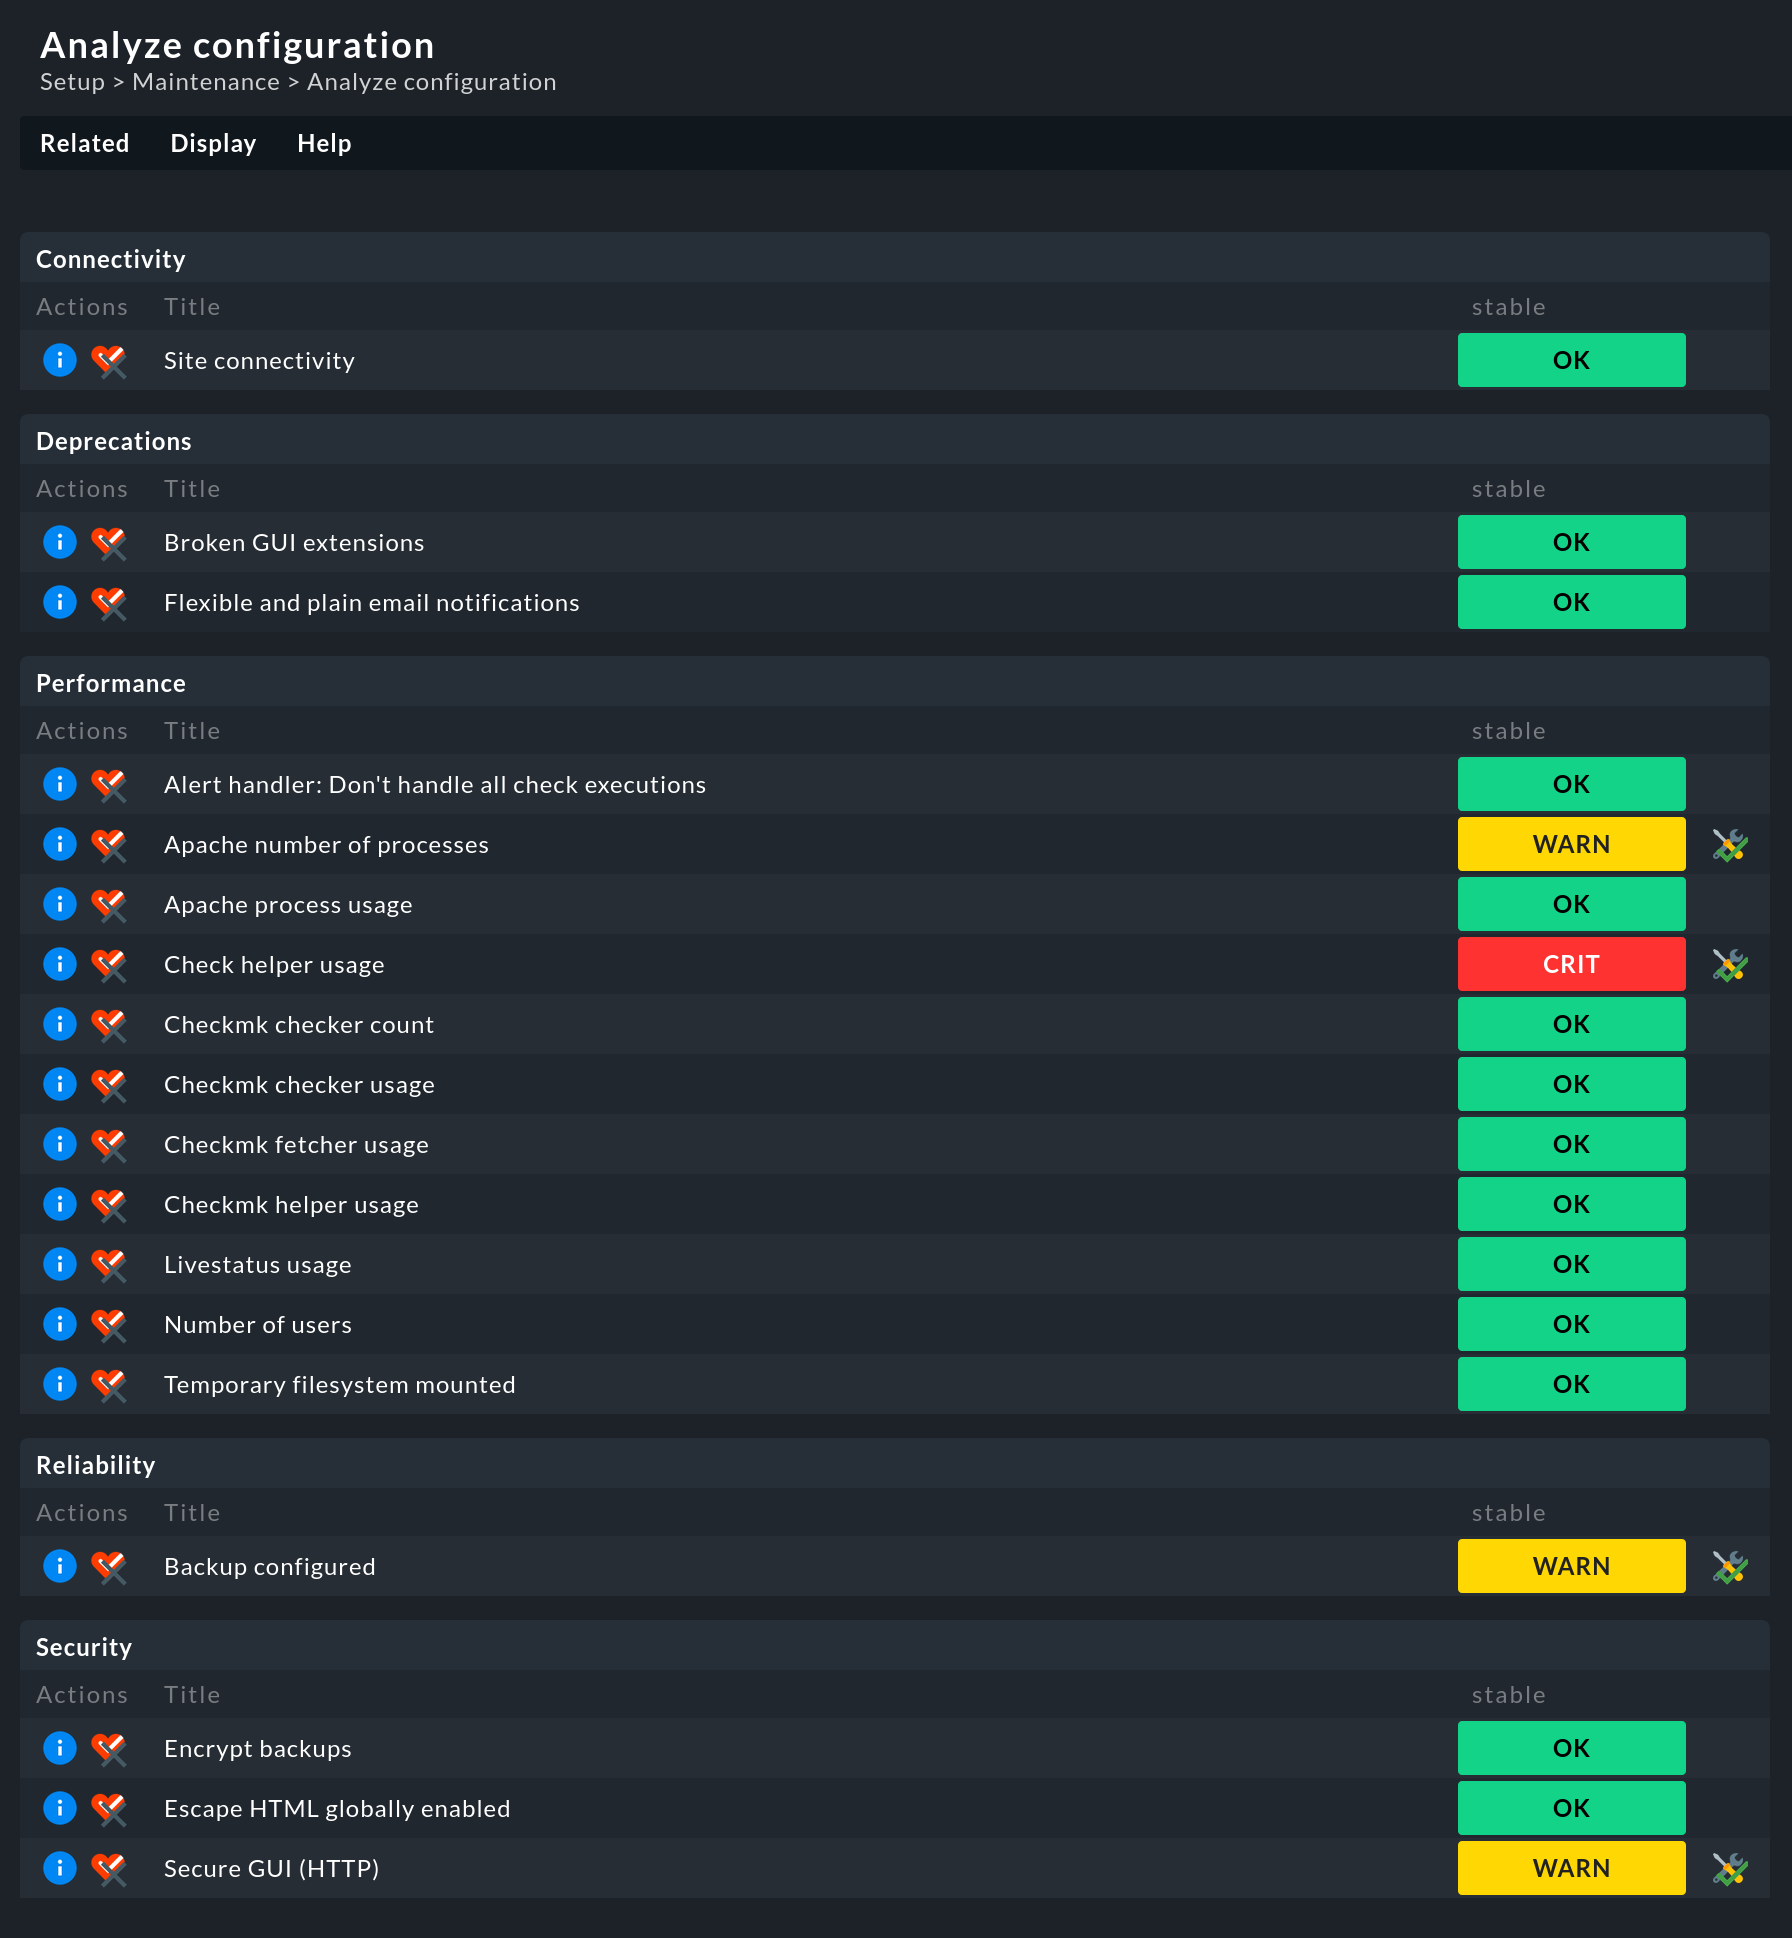
Checkmk quickly and clearly analyzes the essential parameters associated with the current site as well as any attached sites in the case of a distributed monitoring.
The hosts and services within your site(s) are not affected by these checks, they are still shown in the views of hosts and services. The results of the site checks covered here are displayed on the Setup > Maintenance > Analyze configuration page.
Note: When Analyze configuration is called, the current state of all checks is always assessed and displayed. Therefore, after calling the menu item it may take a little while before the page with the results is displayed:

2. Interpreting the analysis
The analyzed site data are divided into different categories as so-called 'checks'.
Each check has a colored status display. A check can have the following states in the analysis:
| State | Color | Description |
|---|---|---|
OK |
green |
The check is completely fine. All checked values are considered optimal. |
WARN |
yellow |
The check is basically fine, but Checkmk has identified potential for improvement. |
CRIT |
red |
The check has detected critical values. These should be examined and fixed if necessary to ensure a smooth operation of Checkmk. |
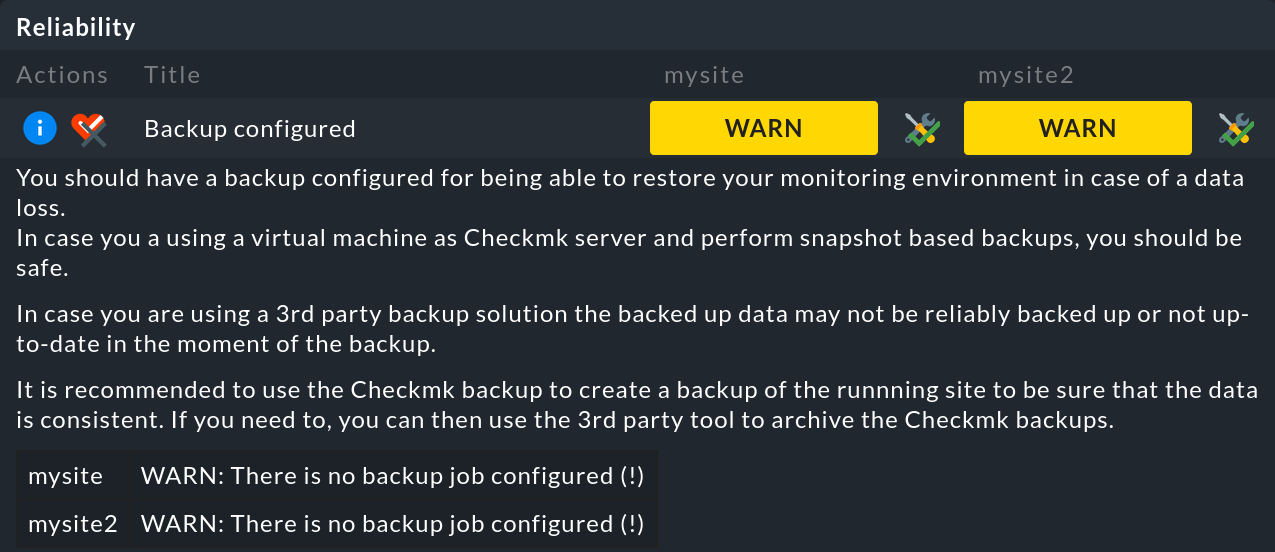
Let’s consider the Backup configured check with two sites in a distributed monitoring:

This check is in a WARN state, so an ![]() button appears after the WARN for acknowledging this.
This button also appears for checks in the CRIT state.
Acknowledgement causes the yellow or red color of the state to disappear.
The entry itself remains, but becomes visually more discreet.
If the check is acknowledged, the button changes to the
button appears after the WARN for acknowledging this.
This button also appears for checks in the CRIT state.
Acknowledgement causes the yellow or red color of the state to disappear.
The entry itself remains, but becomes visually more discreet.
If the check is acknowledged, the button changes to the ![]() representation.
This button can also be used to cancel the acknowledgement.
representation.
This button can also be used to cancel the acknowledgement.
In general, it makes sense to check the system environment for all parameters.
However, if you do not want to run individual checks (again), you can disable any of the checks by clicking on the associated ![]() button.
For example, turn off the Backup configured check if your organization uses a different solution for backup creation.
button.
For example, turn off the Backup configured check if your organization uses a different solution for backup creation.
3. The checks in detail
For each check, clicking on the associated ![]() button will give you more details on the detected values, an assessment of the status, as well as hints for optimization.
button will give you more details on the detected values, an assessment of the status, as well as hints for optimization.

Much can be readily understood and acted upon based on this. For the following topics the User guide offers additional supplementary articles:
| Category | Check | Additional information |
|---|---|---|
Connectivity |
Site connectivity |
If you are using distributed monitoring, a message may be based on unstable or slow connections. |
Deprecations |
Flexible and plain email notifications |
By default, in new Checkmk installations the notifications by rules are already enabled. Otherwise, enable them by setting Global settings Notifications > Rule based notifications to on. |
Performance |
Check helper usage[1] |
|
Checkmk checker count[1] | ||
Checkmk checker usage[1] | ||
Checkmk fetcher usage[1] | ||
Checkmk helper usage[1] | ||
Livestatus usage |
||
Number of users |
||
Reliability |
Backups configured |
|
Security |
Encrypt backups |
|
Secure GUI (HTTP) |
In addition, the article on Security provides an overview of other security-related matters relevant to Checkmk.
