1. What are reports?
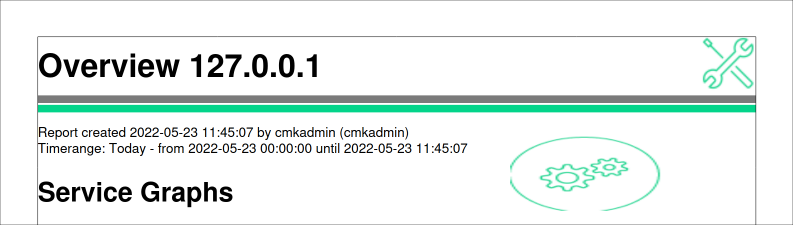
![]() A report in Checkmk is intended to provide an overview of the data, content, and state in Checkmk in printable form.
It is a compilation of different elements (views, availability tables, graphs, body text, logos) into a printable PDF document.
A report in Checkmk is intended to provide an overview of the data, content, and state in Checkmk in printable form.
It is a compilation of different elements (views, availability tables, graphs, body text, logos) into a printable PDF document.
Reports in Checkmk are easy to use:
No external tools like Jasper, DB or similar are needed.
The PDF file is cleanly created with vector graphics.
Reports can be managed using templates and inheritance.
The report scheduler sends reports periodically on demand.
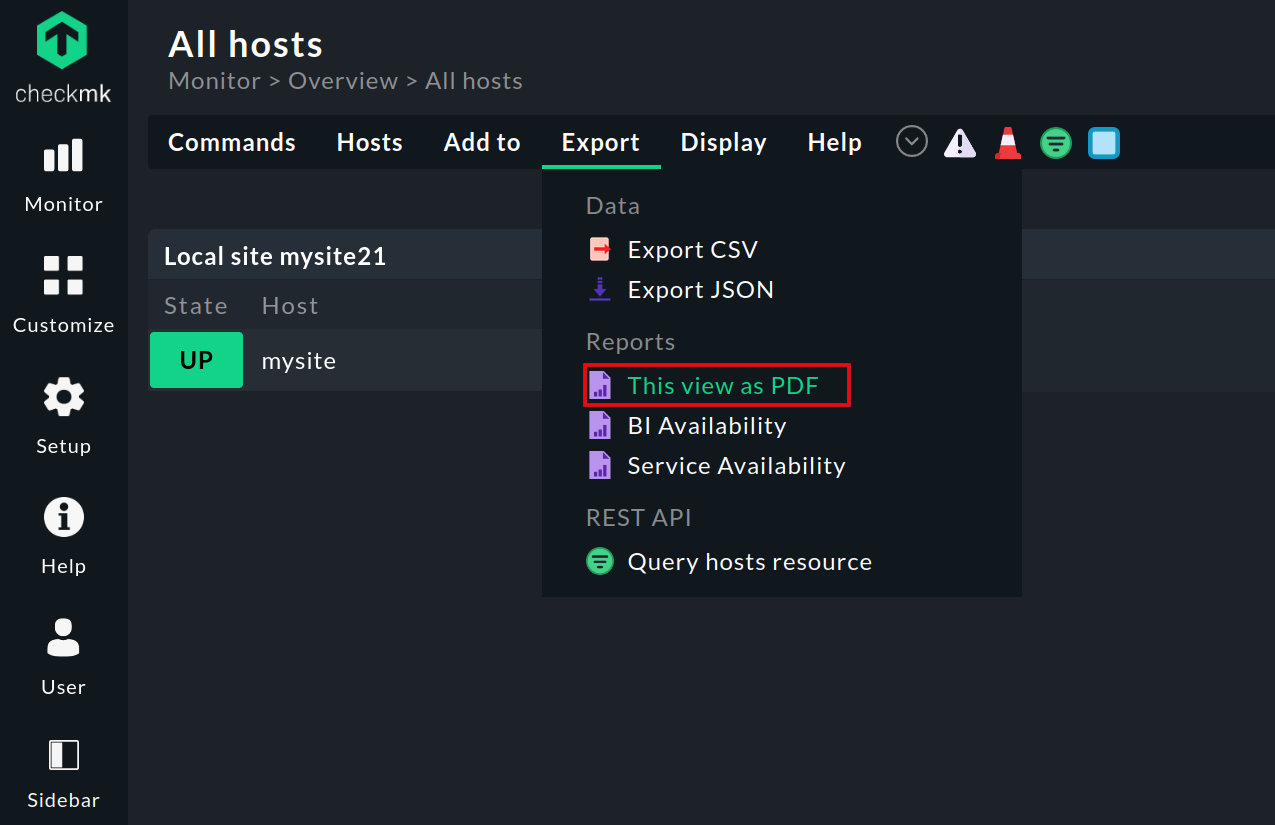
Instant reports are generated via Export > This view as PDF.
2. Built-in reports in Checkmk
The ![]() Checkmk Enterprise Editions provide some built-in reports.
You can either use these directly to get reports from Checkmk, or use them as templates for own reports at any time.
Checkmk Enterprise Editions provide some built-in reports.
You can either use these directly to get reports from Checkmk, or use them as templates for own reports at any time.
Just like views and dashboards, reports supplied in Checkmk cannot be modified. But you can clone/copy any existing reports as many times as you like, and modify each to suit your needs. The procedure for creating simple but also complex reports is described below.
An overview of all reports in Checkmk, built-in and custom, can be found at Customize > Business reporting > Reports (you may need to click show more first):
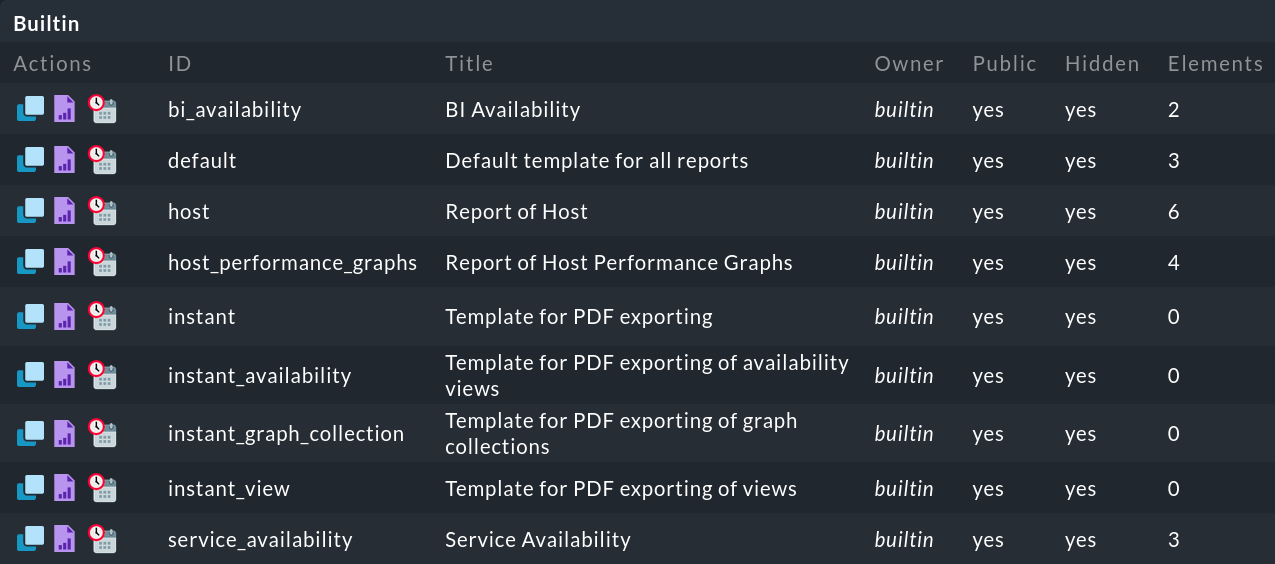
On the left side, the following icons are available for editing:
|
Copy report |
|
View preview |
|
Open report scheduler |
3. Launching reports
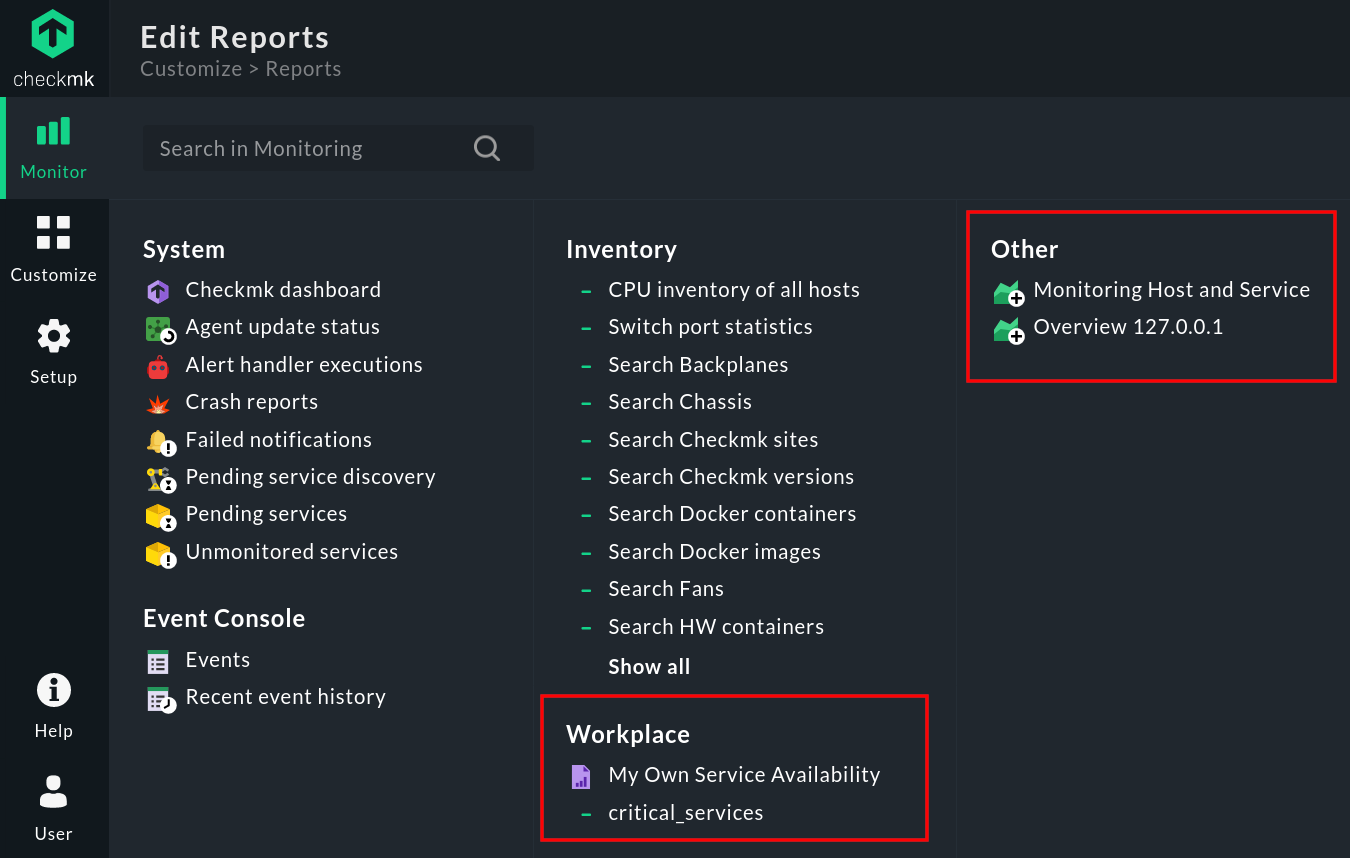
Reports can be launched at various points in Checkmk, depending on their context and purpose. For example, designated reports can be called from the Monitor menu in the navigation bar
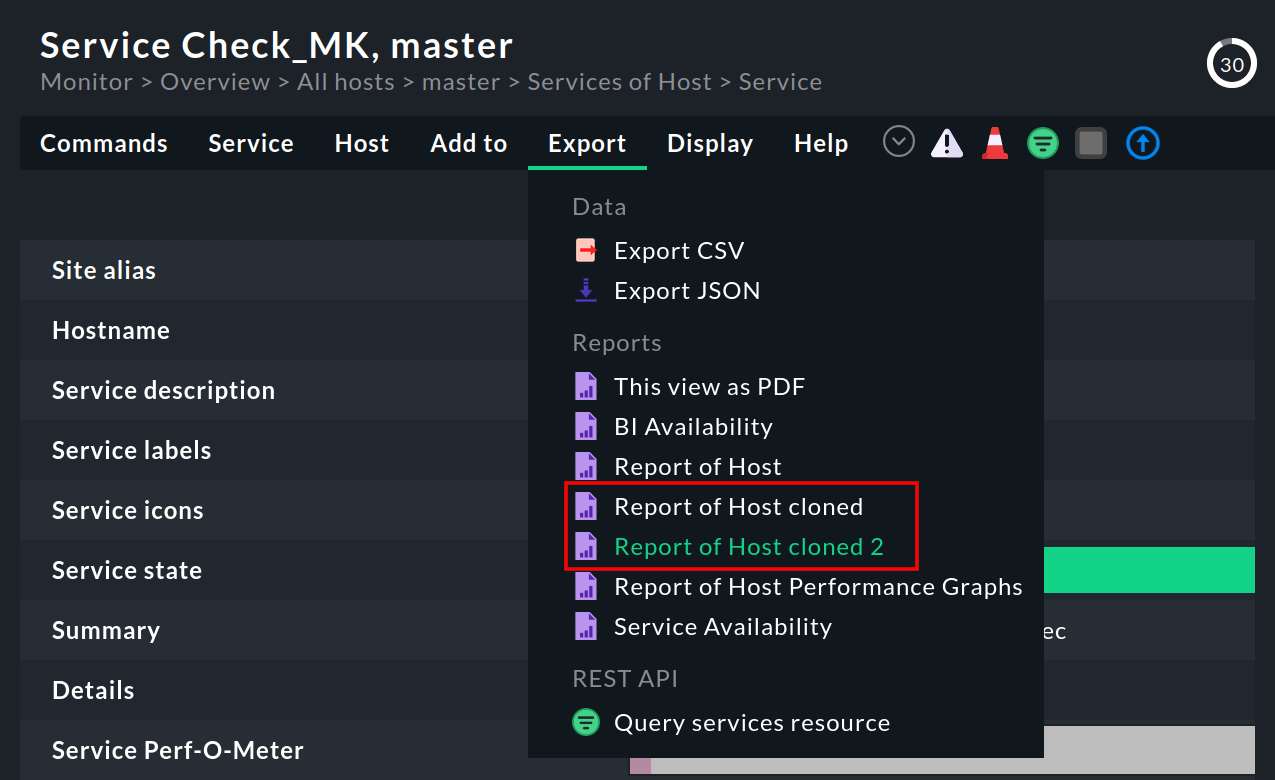
Contextually, you can find the reports in the Export menu of the various views:
The Reporting snapin in the sidebar gives you quick access to all reports that have been designated for display in the Monitor menu and sidebar, and the report scheduler (Scheduler):
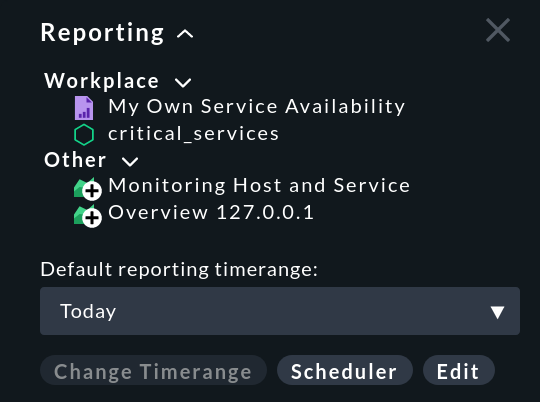
There are three buttons in this snapin:
Change Timerange |
Change time range for instant reports |
Scheduler |
|
Edit |
Open list of existing reports |
3.1. Context for reports
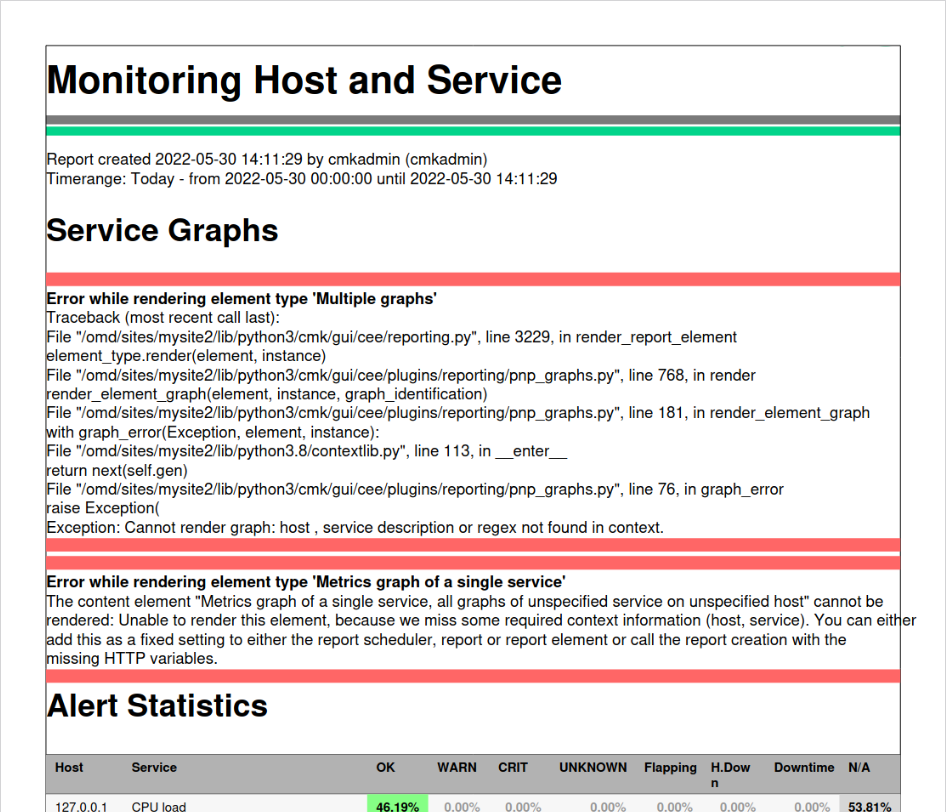
To give reports a context, i.e. to fill them with data of specific hosts and services, there are several possibilities. As a result, reports have to be called in different ways to contain meaningful information. If the context is missing, i.e. specifying which hosts and services should be included in the report, you will only get error messages highlighted in red instead of correct output:
The difference is where the context is specified:
Context specified (via report properties): The report can be called from anywhere, it is always filled with correct information.
Context not given: Call via Export menu in the different views, context is provided by the (filtered) view.
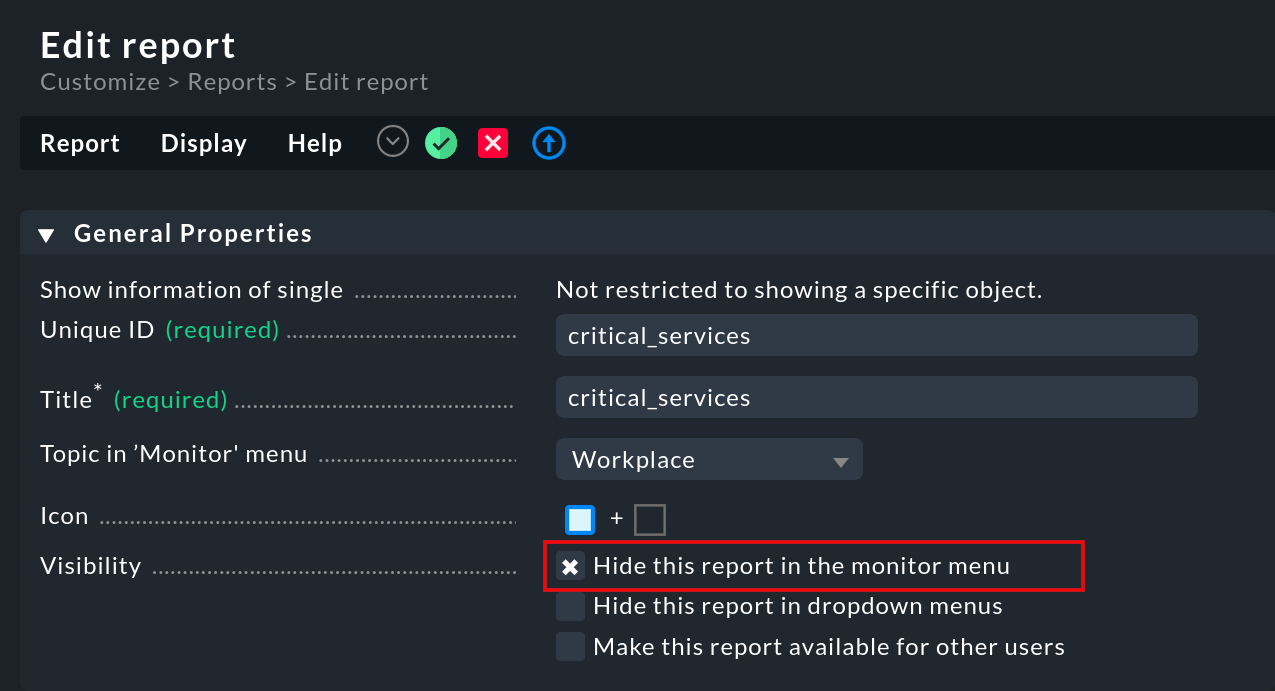
Now think again about the Reporting snapin mentioned above: this takes you directly to the rendered reports without any further preselection / restriction etc. - so actually only those reports that have a built-in context make sense here. Reports whose context is only created via (filtered) views can therefore be safely excluded from the Monitor menu as well as the snapin via the Hide this report in the monitor menu option.
4. Creating a first custom report
Based on the existing reports and report templates, you can create your first custom report relatively quickly and easily. We will explain how to do this in a moment. More in-depth information around more complex reports will follow below in the text.
The fastest way to create a report is to copy an existing report and then customize it.
For example, if you want to create an overview of the availability of services on a specific host, the host named mycmkserver, do the following.
First, open the report overview with Customize > Business reporting > Reports:
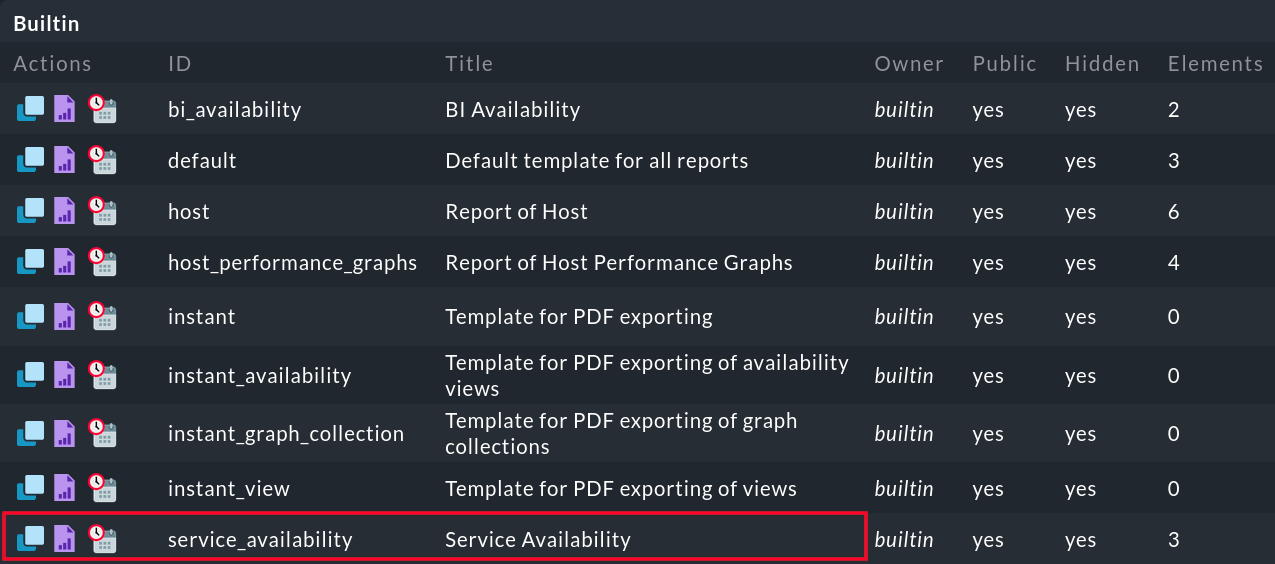
Clicking ![]() in front of the report service_availability will take you to the basic settings of your report copy:
in front of the report service_availability will take you to the basic settings of your report copy:
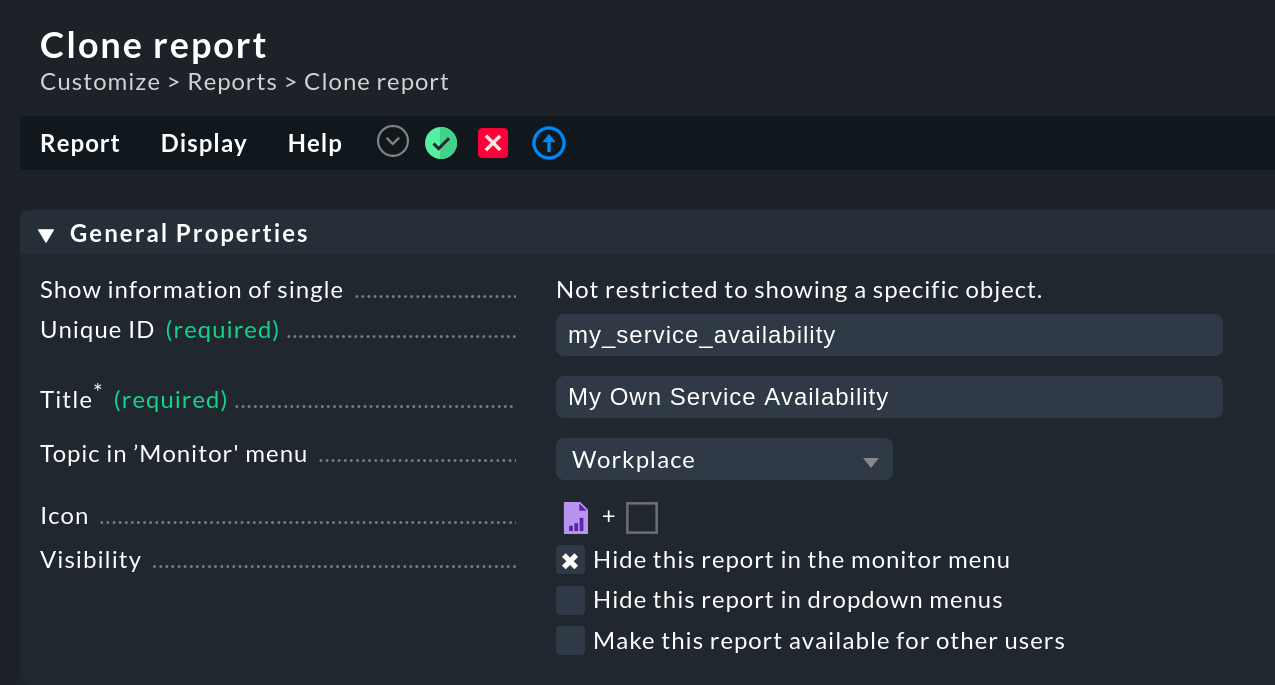
Enter the desired texts for Unique ID and Title. We won’t deal with the other options in this box, as well as the Report Properties, until we get to the more complex reports.
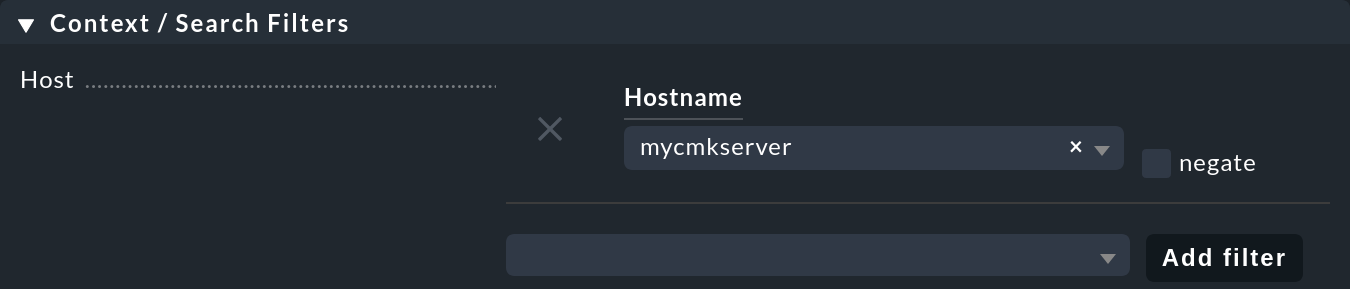
For now, it’s enough to scroll down to the Context / Search Filters box. For Host, select Hostname. Now, once you click Add filter, you can select the appropriate host from the list of host names:
Click ![]() to save your report and return to the reports overview page.
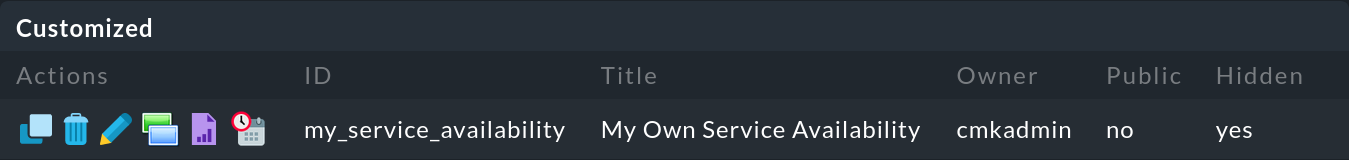
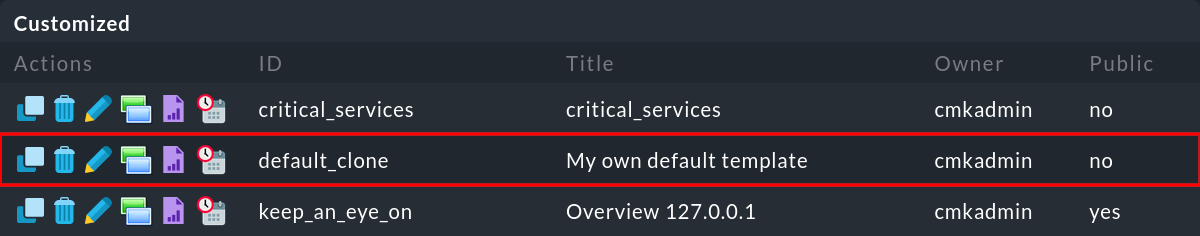
In the section Customized you can now directly access your new report by clicking on the title:
to save your report and return to the reports overview page.
In the section Customized you can now directly access your new report by clicking on the title:
4.1. Editing functions
You can use the following functions to edit your own reports:
|
Copy report |
|
Delete report |
|
Edit report settings |
|
Edit report contents |
|
Display preview |
|
Schedule regular report |
A description of the different possibilities follows in the subsequent sections.
4.2. Creating a new report without a template
Things get a little more complex now if you want to create a completely new report instead of a report copy. As an example, below you will create a simple overview of all problematic services of your site, i.e. all services in WARN, CRIT or UNKNOWN status. This overview will be titled ‘critical_services‘.
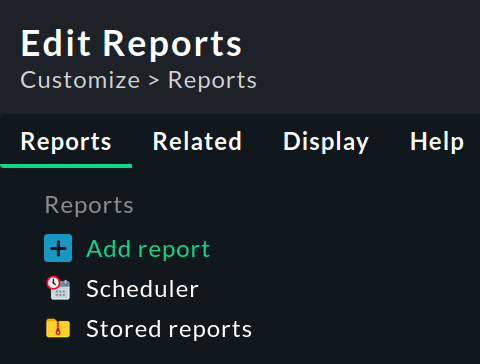
You create a new report on the Edit Reports page via Reports > Add report.
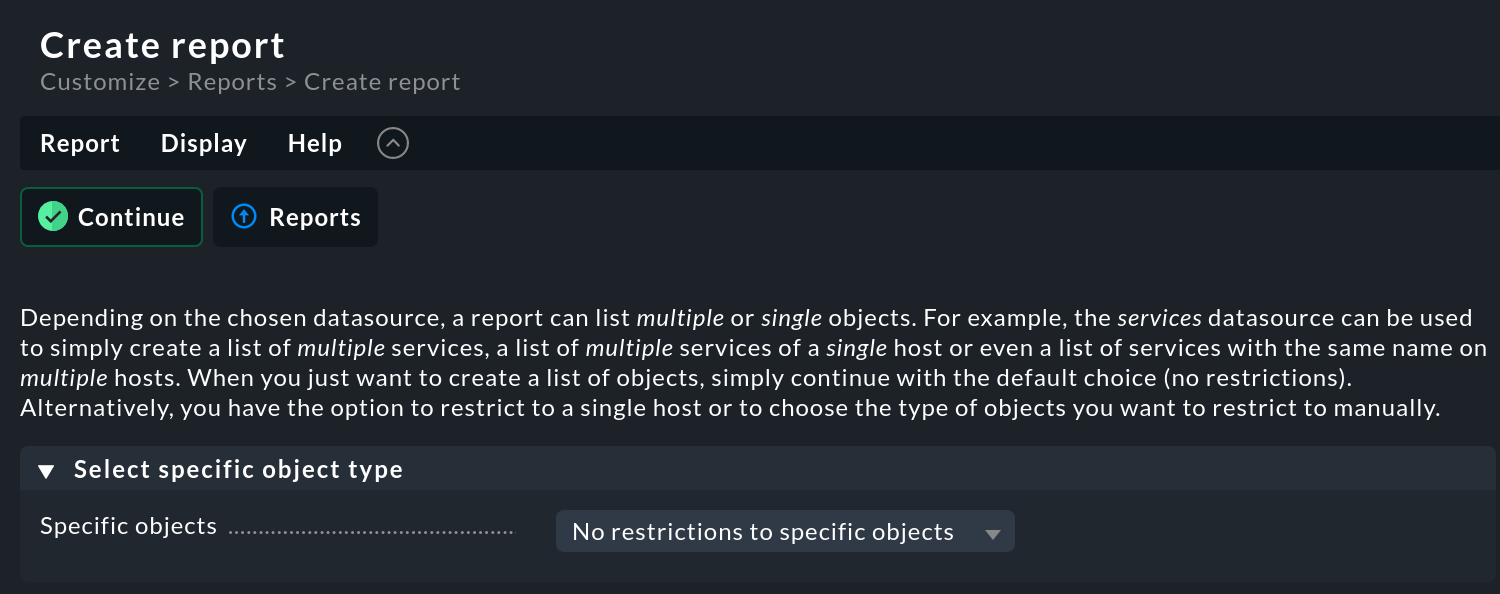
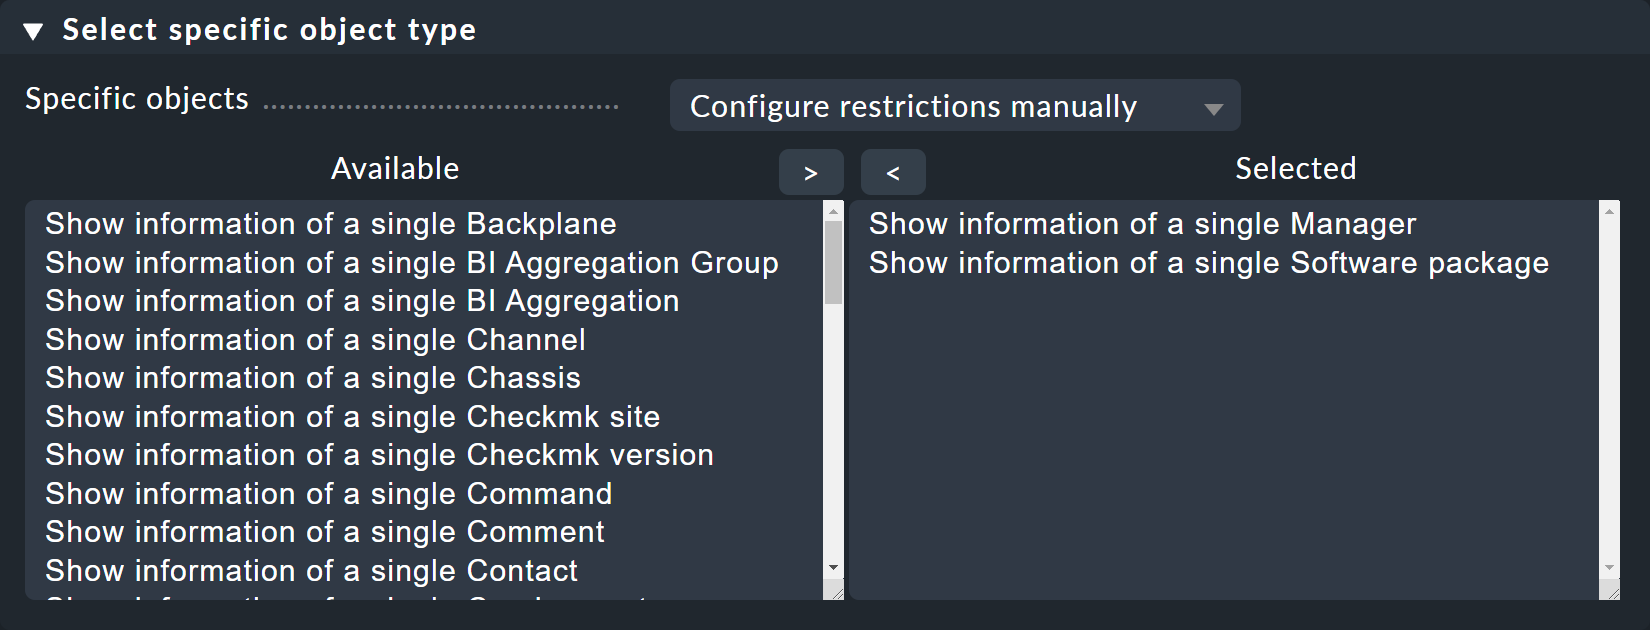
In the first step, leave the filter Select specific object type on the selection No restrictions to specific objects
and go directly to the next selection with ![]() Continue.
Continue.
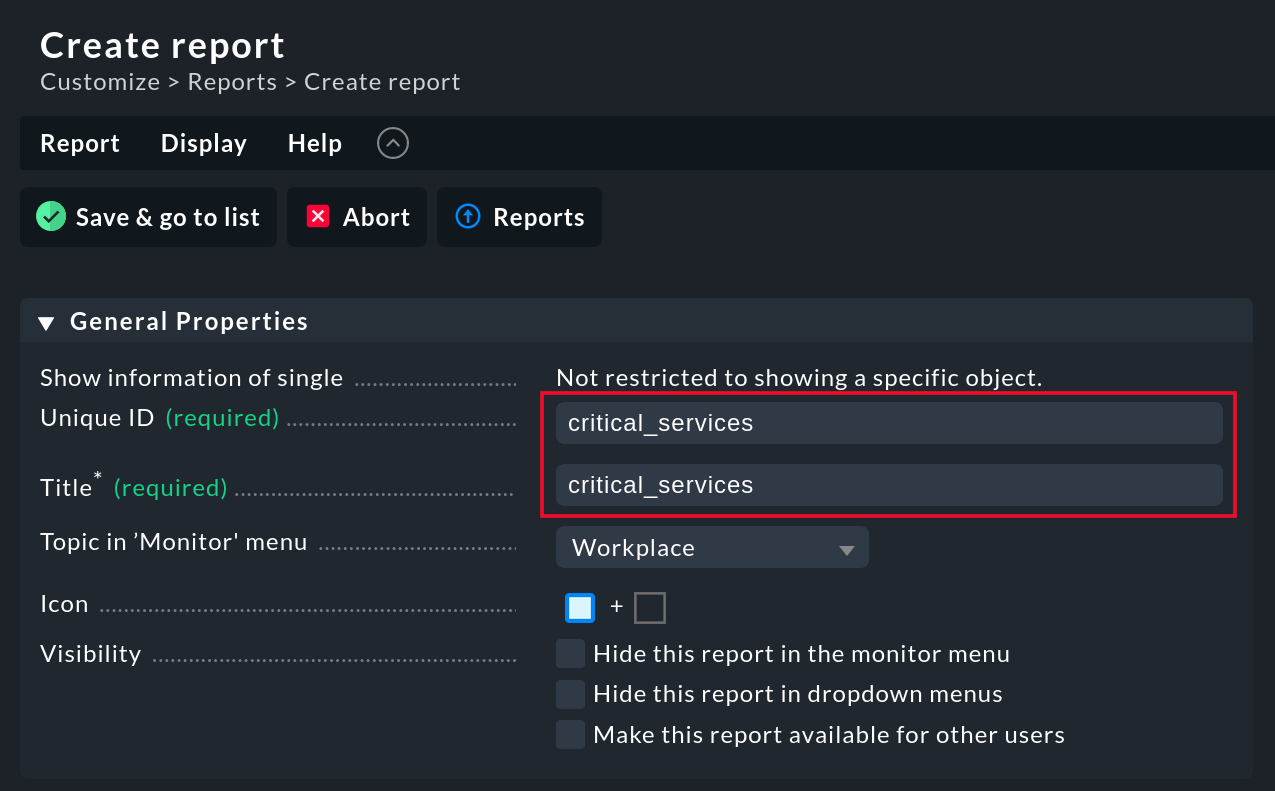
As with copying an existing report, first specify Unique ID and Title:
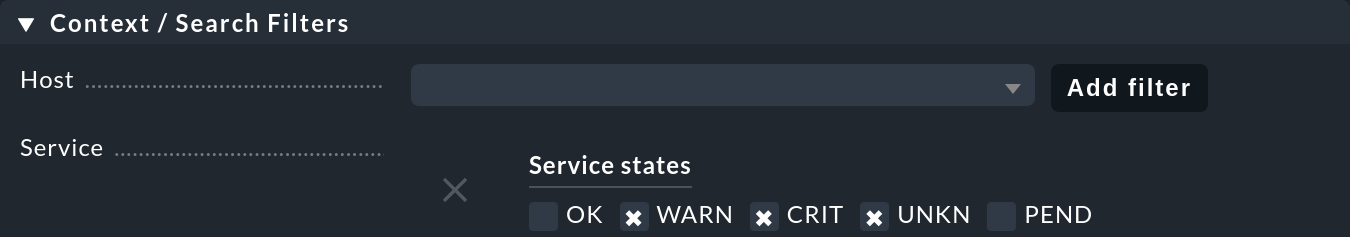
In the Context / Search Filters section, now select the Service states under Service. After clicking Add filter you can set the desired states:
With ![]() Save & go to list the new report will be added to the Customized section of the reports overview list.
Save & go to list the new report will be added to the Customized section of the reports overview list.
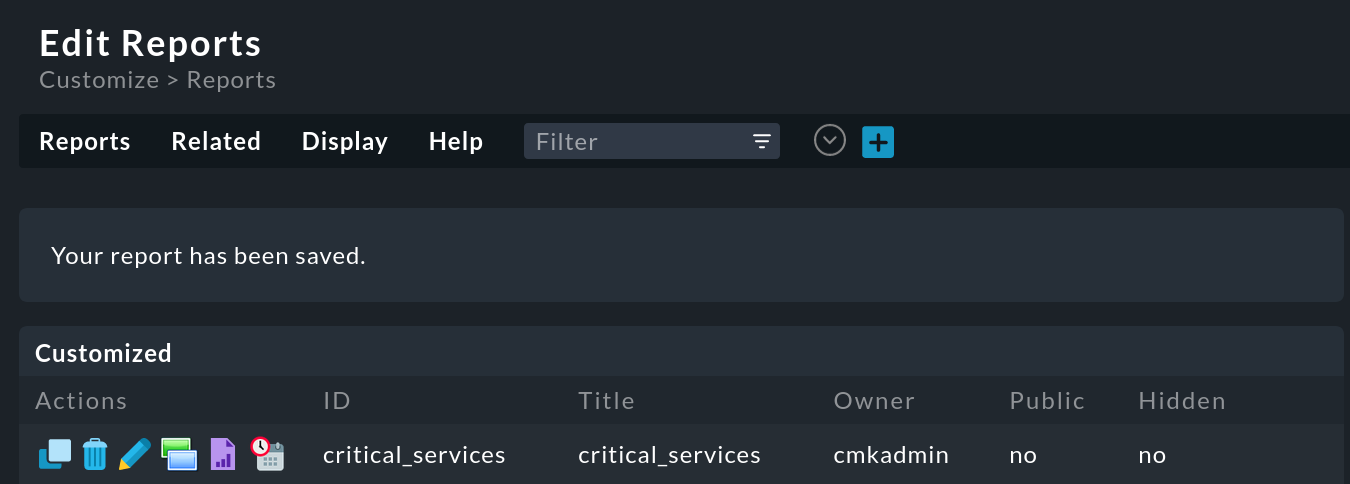
If you now call up this report in joyful anticipation, the result is sobering. The report page has an initial layout and also a heading, but is otherwise empty. Not exactly the result to impress your boss with …

So now you need to define the design of the content for the report.
The ![]() will take you to the content definition for the report.
The selection of report elements is done in three stages, each with a click on
will take you to the content definition for the report.
The selection of report elements is done in three stages, each with a click on ![]() Continue in between.
Continue in between.
Start by clicking Add content.
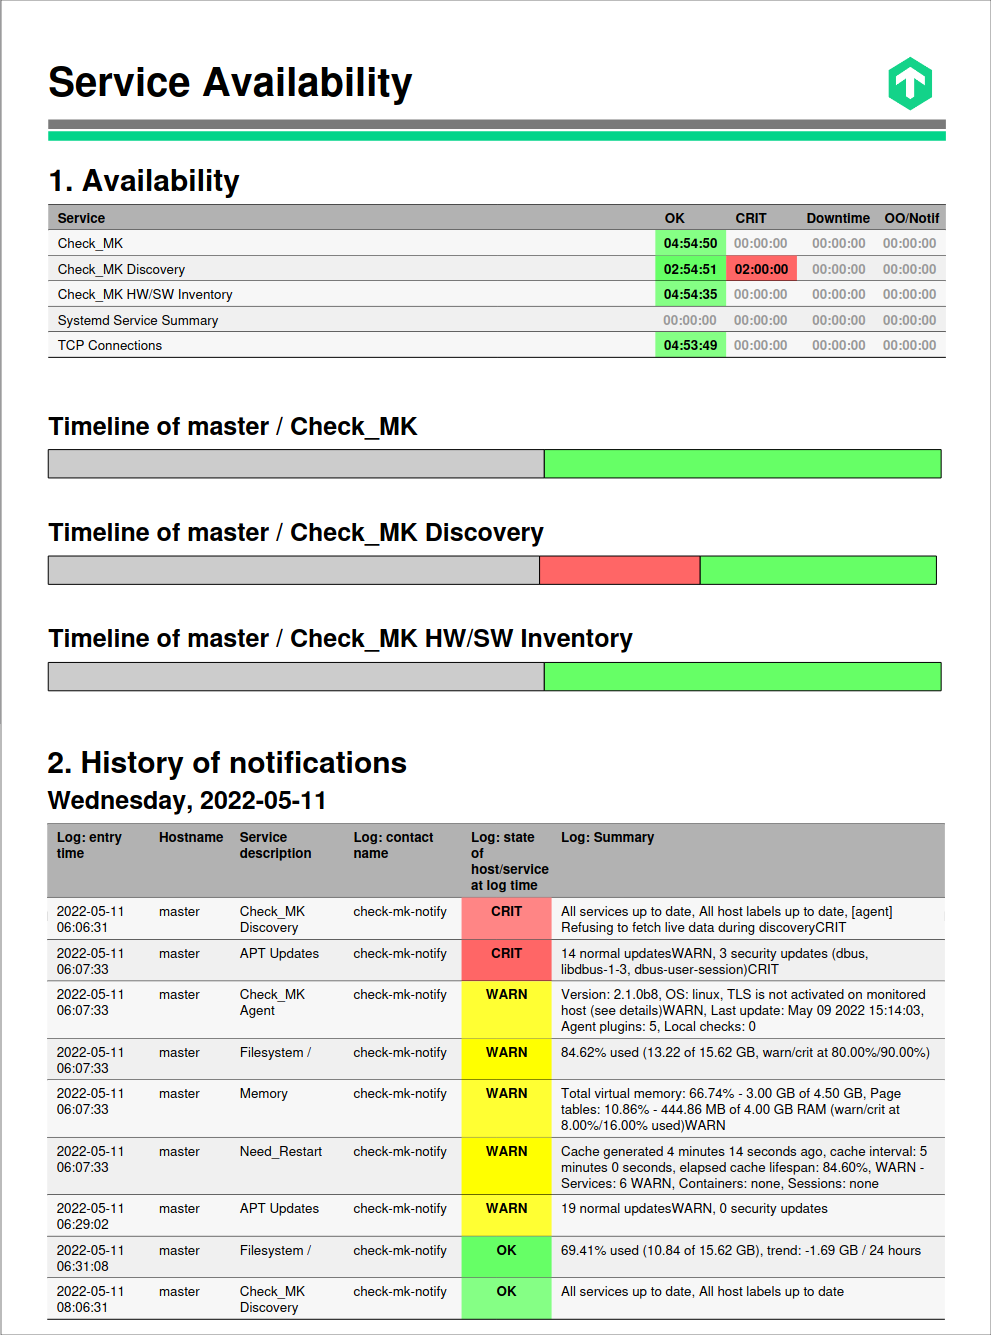
For this example in Step 1 select the element type Availability table.
Set Step 2 to All services and Step 3 to No restrictions to specific objects.
Leave the other options on the following page unchanged for the moment.
Instead, click directly on ![]() Save.
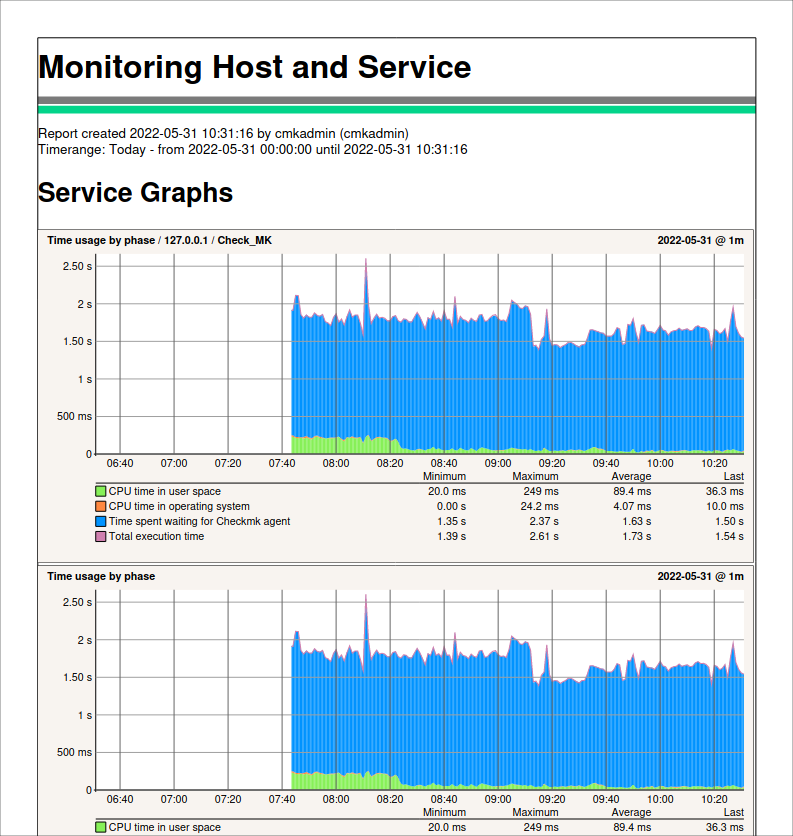
Now view the preview of your report:
Save.
Now view the preview of your report:
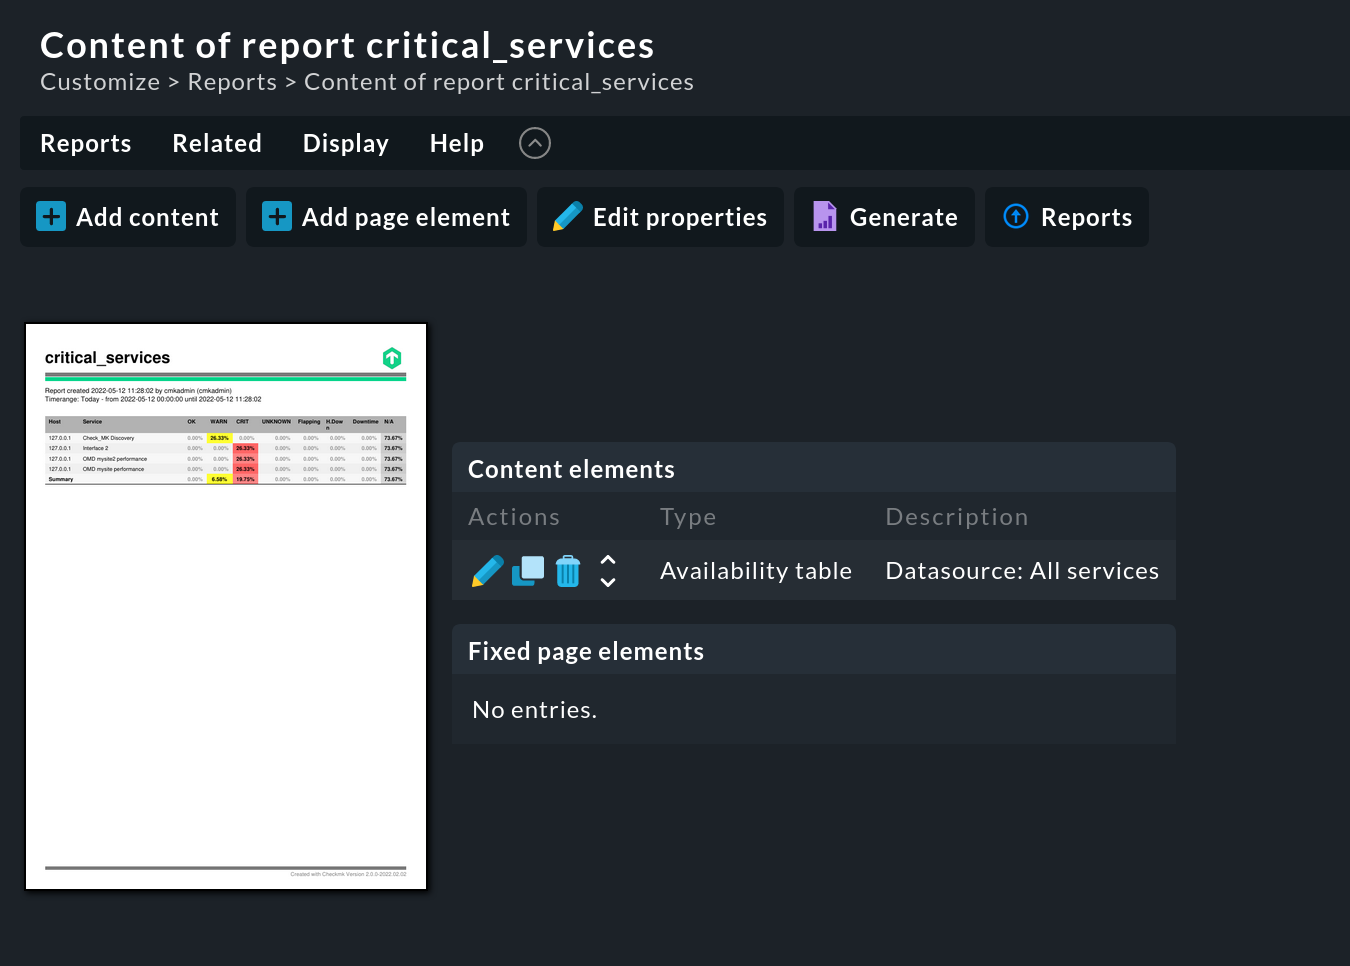
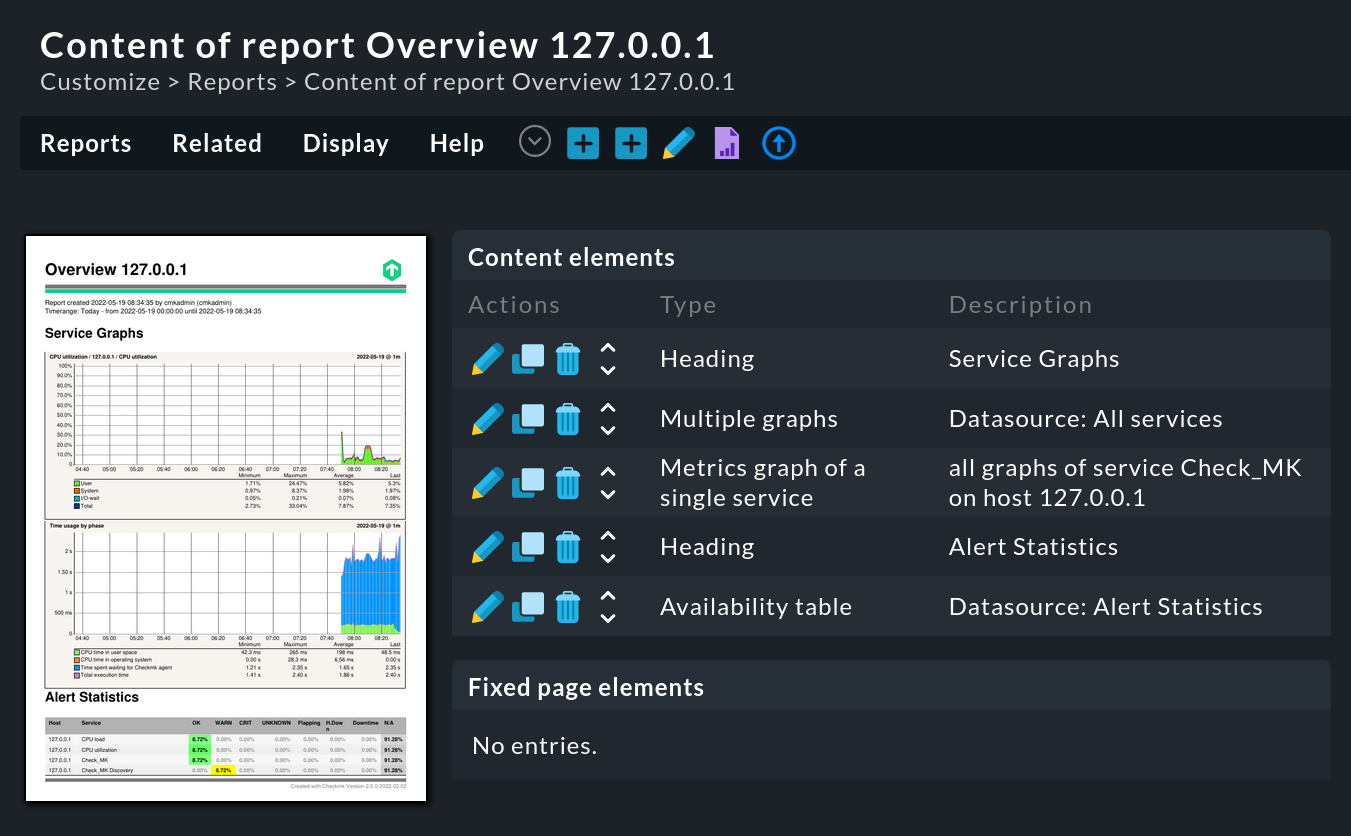
On the left you can see the preview, here for the report critical_services.
To the right, the elements of the report are displayed in a list.
These elements can be ![]() edited,
edited, ![]() copied,
copied, ![]() deleted and
deleted and ![]() reordered.
reordered.
You can now flexibly extend this simple, self-created report with additional elements (see below) and call it up at any time, e.g. from the sidebar.
5. Building complex reports
In the previous sections you have seen how to create initial reports with little effort, either as a copy of an existing report or completely new. These are great ways to achieve initial success. Most of the time, however, it doesn’t stop at such simply structured reports. More complex presentations, a mixture of different content, a custom layout, etc. are the next logical step.
The many possibilities can best be shown with an example:
5.1. Setting basic settings
In almost every step of the report creation there is the possibility to adjust the content to your needs.
In the first step, you can set a filter and limit the report to a specific host or data source from the start, such as network interfaces, BI aggregations, sensors, and so on:
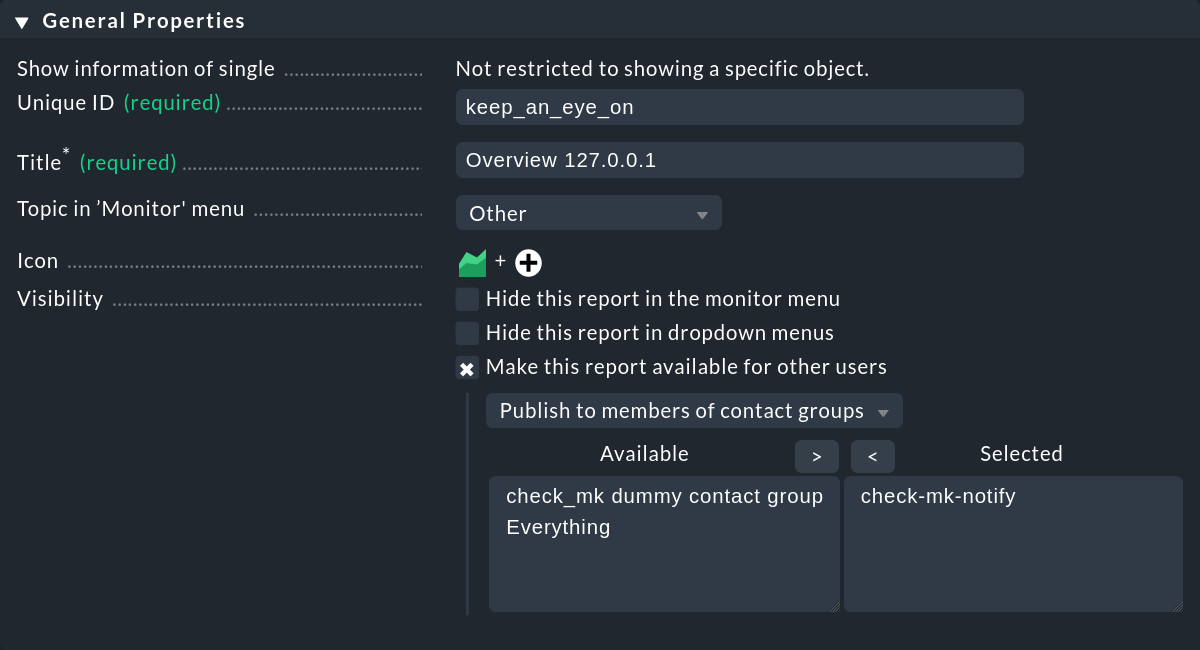
Next, enter the Unique ID and the Title again.
For the title you can also use the provided macros (=text modules).
Next, choose a Icon with which the report should be visible in the menus.
By setting the Make this report available for other users option to the contact group, in the example check-mk-notify,
you give the associated group members the ability to independently access the report at any time and get information on their own.
In the Context / Search Filters box, extensive filtering options are available as usual, from specific hosts to individual Docker containers to values from Oracle monitoring.
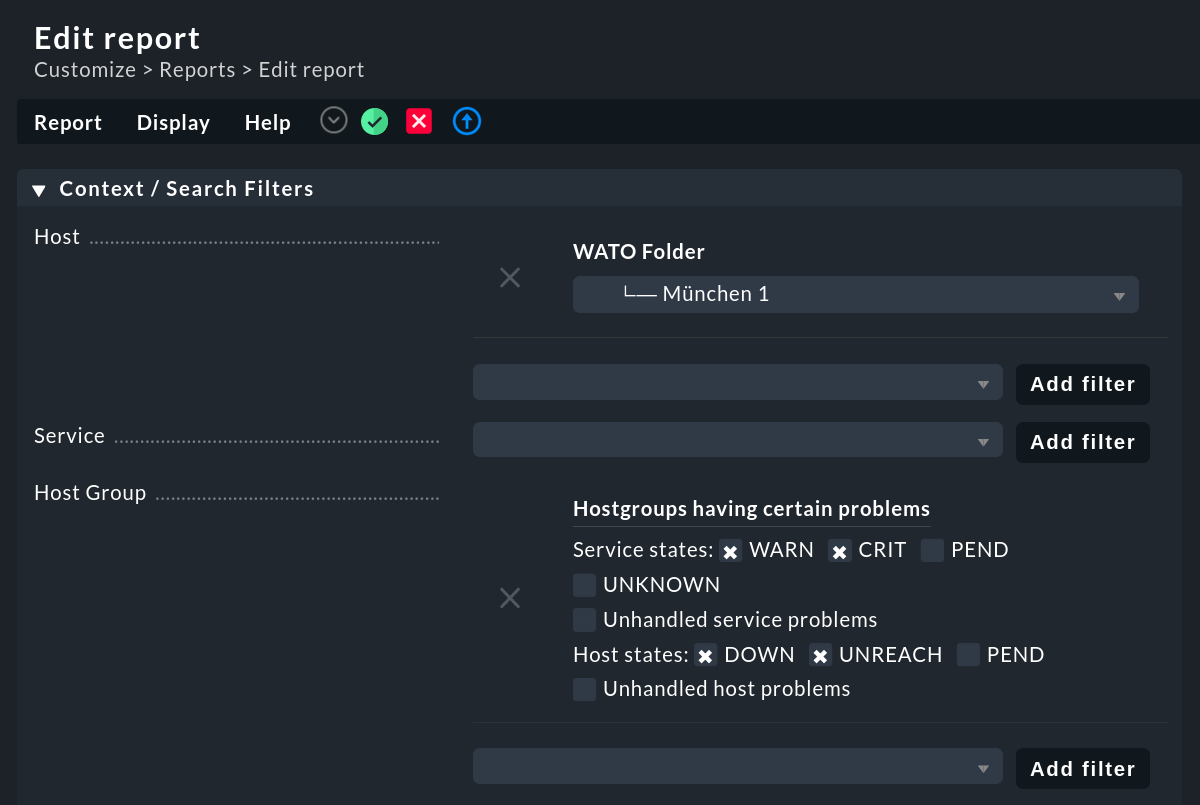
For this example, the host selection is limited to one folder and additionally to specified host issues. This restriction speeds up data retrieval, especially in more complex environments.
With Save & go to list you get to the report overview. The next step is to define the report content.
5.2. Defining report content
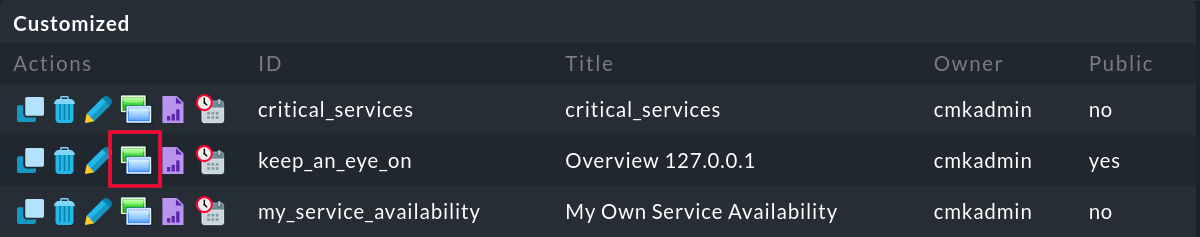
Using the ![]() you get to the report content:
you get to the report content:
Open report content editing with Reports > Add content. Use this to add tables, graphs, tables of contents, or text (also via macros or HTTP) to the report, for example. These contents appear one after the other and thus also determine the final length of the report.
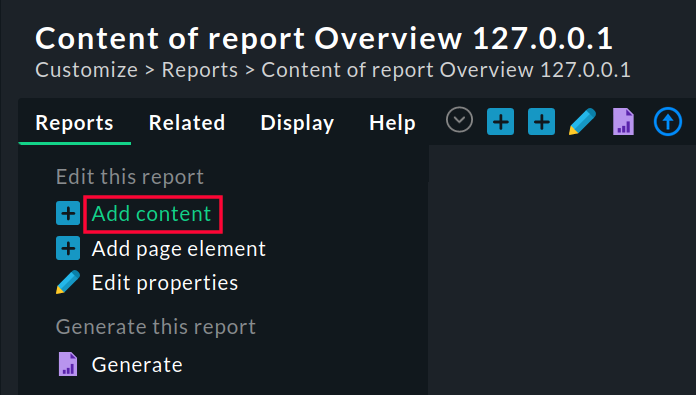
In Step 1, select the element you want, for this example Multiple graphs. This will give you, depending on your other settings, multiple graphs of the same type one below the other. For example, you can map the direct comparison between the states of multiple hosts.

Continue with ![]() Continue.
As the data source for the graphics, select All services in step 2 for this example, i.e. all services running on the hosts:
Continue.
As the data source for the graphics, select All services in step 2 for this example, i.e. all services running on the hosts:

Continue with ![]() Continue.
In step 3 you could now limit the amount of data to be displayed.
This is not needed for the current example.
Again, switch to the next selection with
Continue.
In step 3 you could now limit the amount of data to be displayed.
This is not needed for the current example.
Again, switch to the next selection with ![]() Continue.
Continue.
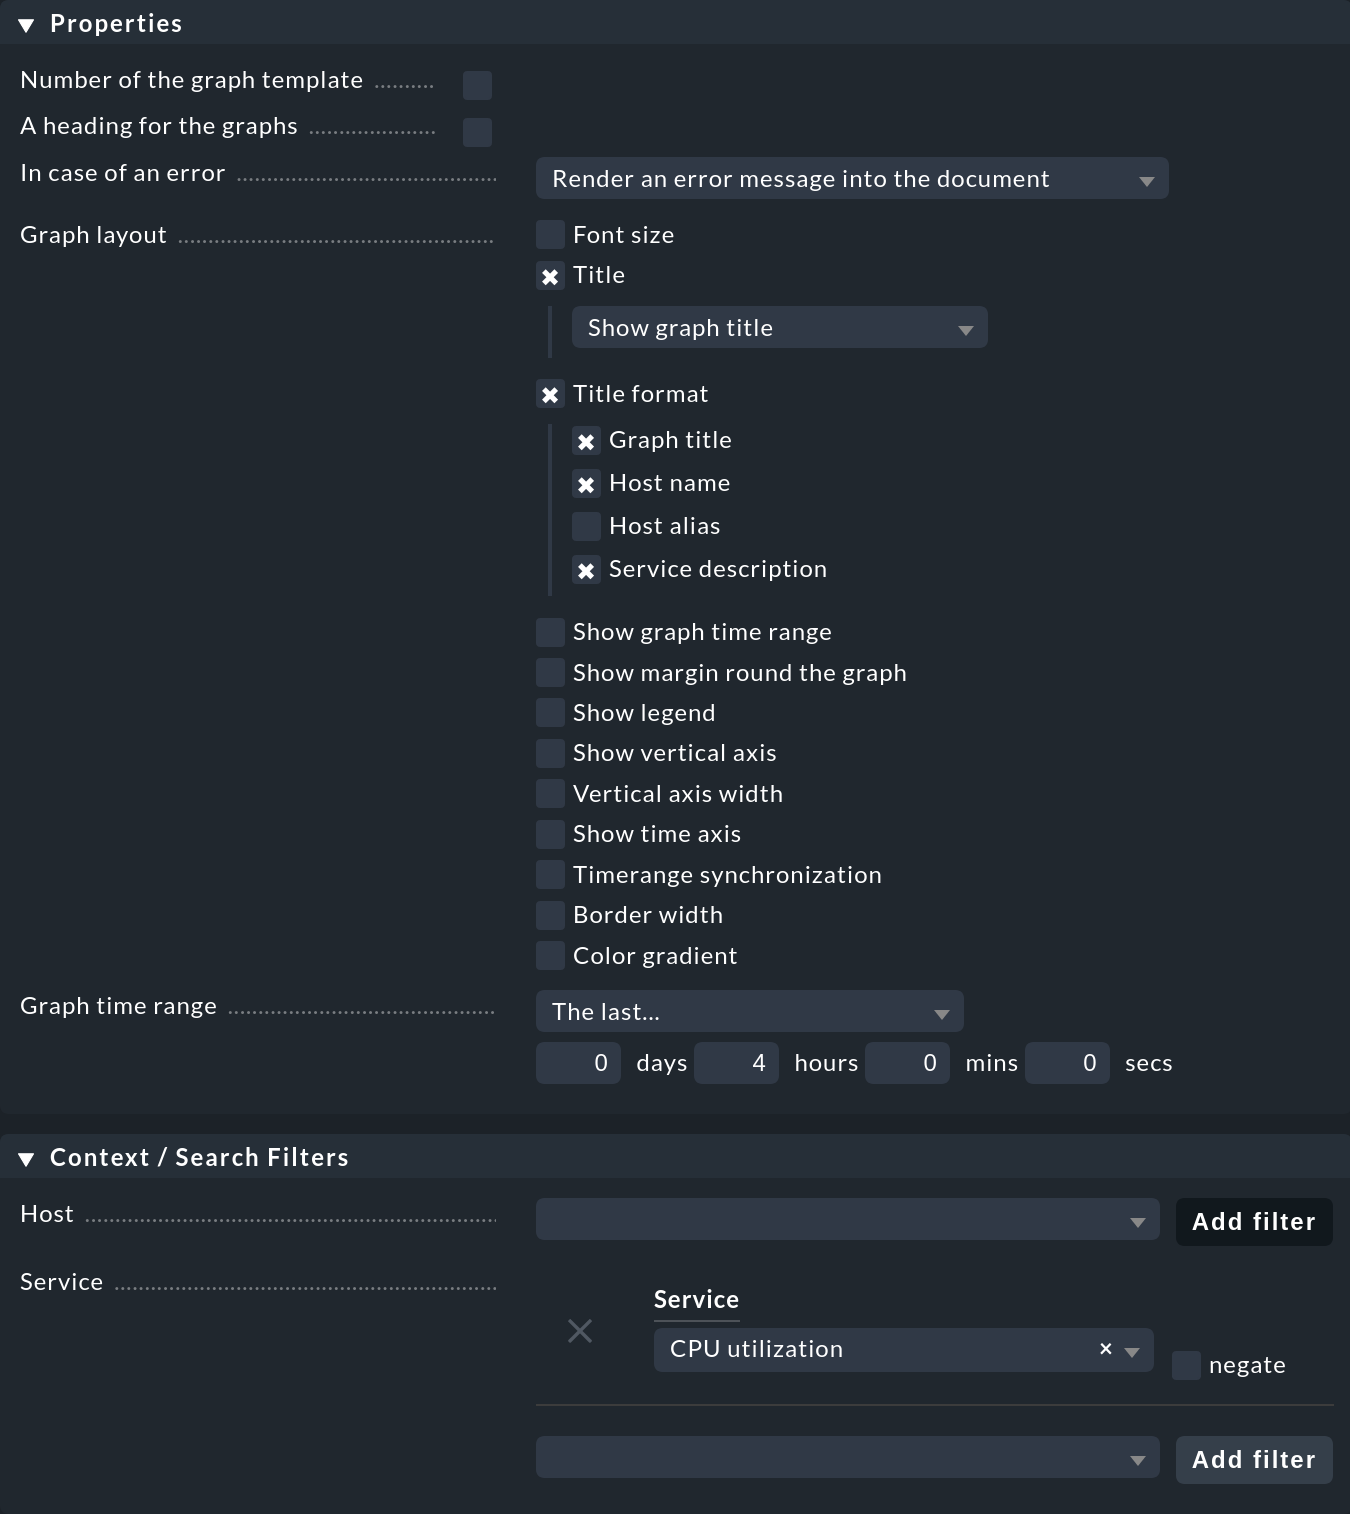
For the sample report, in the Properties box, under Graph layout, specify that you want to see a title for each of the graphs, consisting of the graph title, host name, and service description. In addition, set the displayed time range to four hours under Graph time range.
In the Context / Search Filters box, you limit the report to specified host or service characteristics. Here you select the CPU utilization for the Service this time.
By clicking ![]() Save you have completed the first report element.
Save you have completed the first report element.
For the second graph in the example, start again with Reports > Add content and in Step 1 select Metrics graph of a single service.
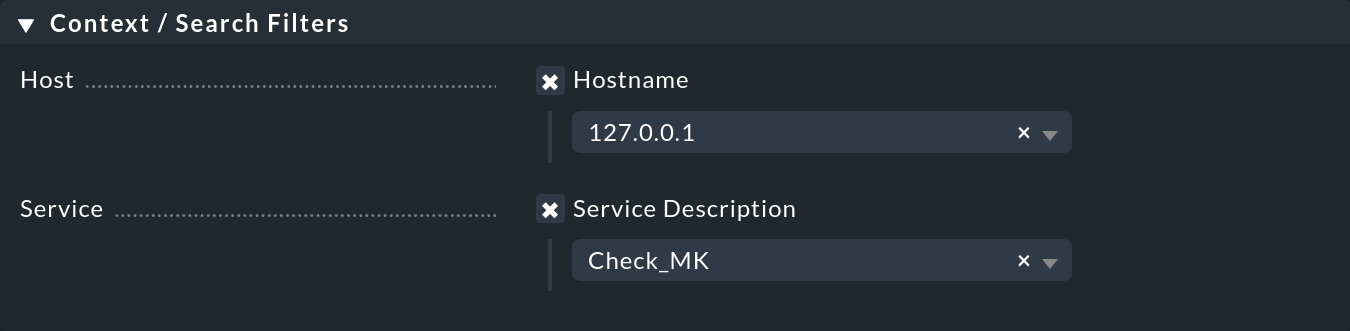
Switch to Step 2 with ![]() Continue and restrict the search filters to host name and service description:
Continue and restrict the search filters to host name and service description:
By clicking ![]() Save the second report element is also ready.
Save the second report element is also ready.
The third element you create is an overview of current alerts. The procedure remains the same:
Call Reports > Add content
Step 1: Select the Availability table element
Step 2: Data source Alert Statistics
Step 3: Restrict to a single host
No further options in the following step
With a click on ![]() Save this report element is also finished.
Save this report element is also finished.
To make the display cleaner, add headings:
Open Reports > Add content to edit the report content.
In Step 1 select Heading as element type.
Switch to Step 2 with ![]() Continue.
Optionally, specify a hierarchy level for the heading.
Enter the heading at The text.
Continue.
Optionally, specify a hierarchy level for the heading.
Enter the heading at The text.

Click ![]() Save to return to the overview.
However, the new heading is now below the graphics in the order.
Therefore, in the list of content items, use the
Save to return to the overview.
However, the new heading is now below the graphics in the order.
Therefore, in the list of content items, use the ![]() icon to drag the heading to the desired position in the list.
icon to drag the heading to the desired position in the list.
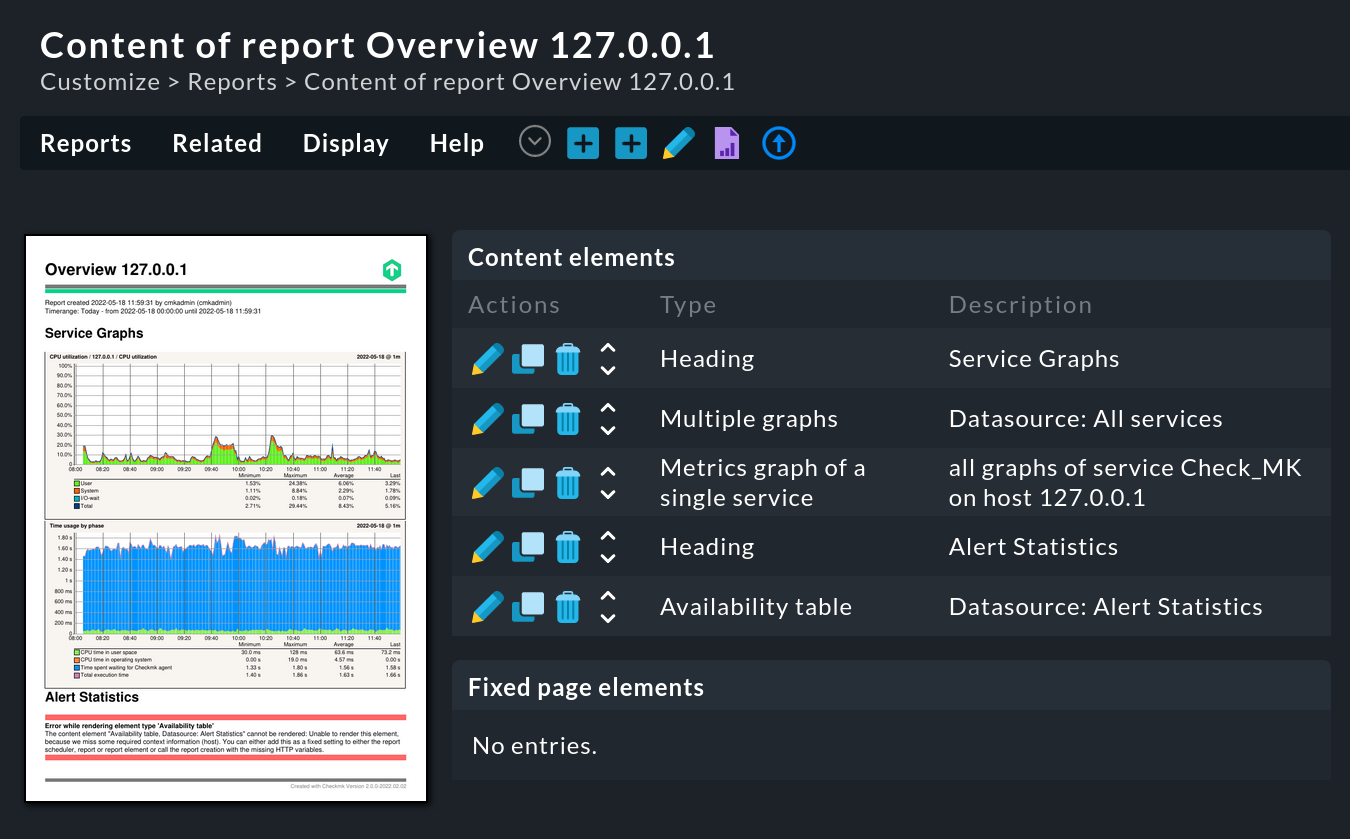
Tip: In the preview, you may see red lines and error messages instead of real data — because in these places the report in the editor lacks context, here, for example, the specification of a host that would only be revealed by calling the report from an appropriate view. If you want to see a usable preview, simply filter for a specific host in the report settings in the Context / Search Filters area in the meantime. This makes designing much easier.
5.3. Visual design of the report
To structure the report, there are complementary design elements: Horizontal line, image, page frame and a single line of text. You can display these building blocks on all or specific pages of your report.
For the example report, insert a frame around the report.
Again, the definition is done step by step, each continued by clicking ![]() .
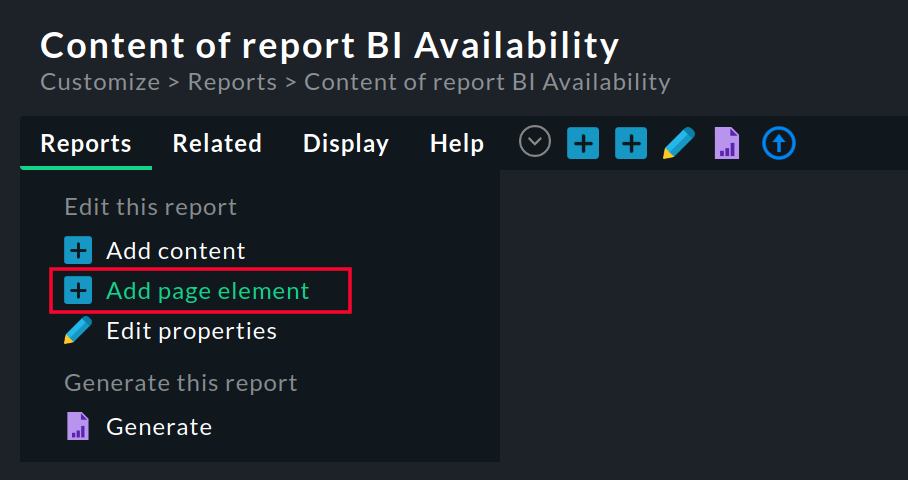
Start with Reports > Add page element.
.
Start with Reports > Add page element.

Since the frame should be visible on all pages, the next step requires no changes:

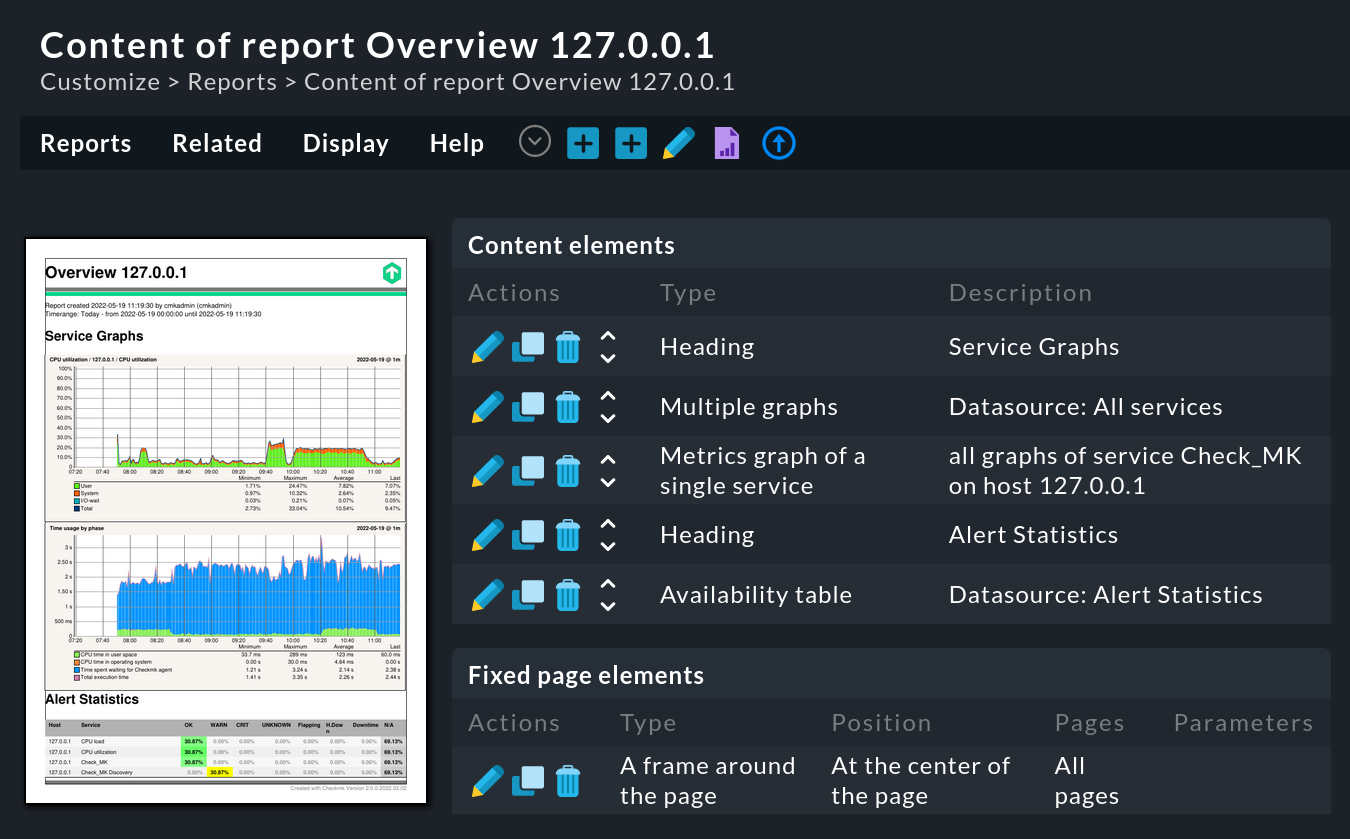
The new page frame is now displayed in the overview, both in the preview on the left and in the static page elements table on the right.
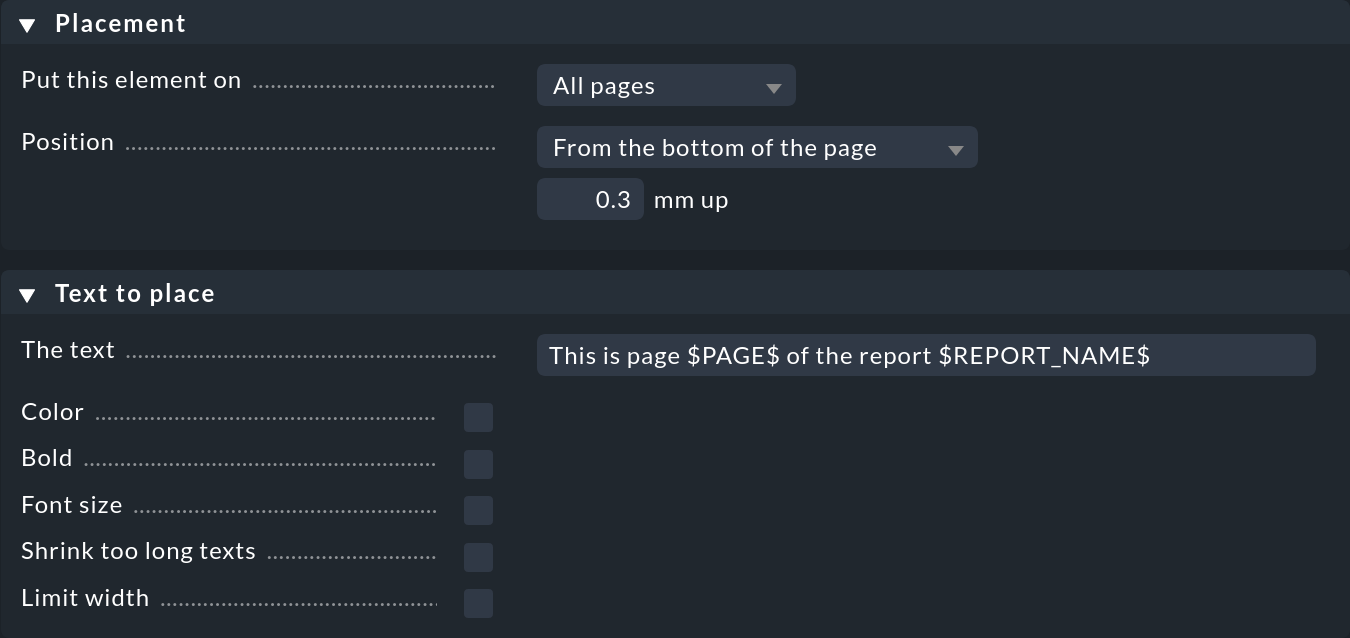
Tip: You can also use the macros (=text modules) available in Checkmk, for example, to create another footer with page number and name of the report. To do this, select the page element One line of text and in the second step specify the position at the bottom of the page as well as the text including the desired macros:
5.4. Customizing the layout
Reports look more appealing right away with a higher-quality appearance, e.g. with the company logo added.
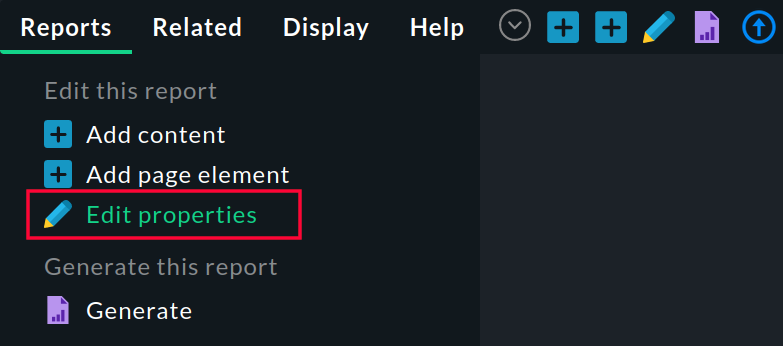
Open the report settings with Reports > Edit properties:
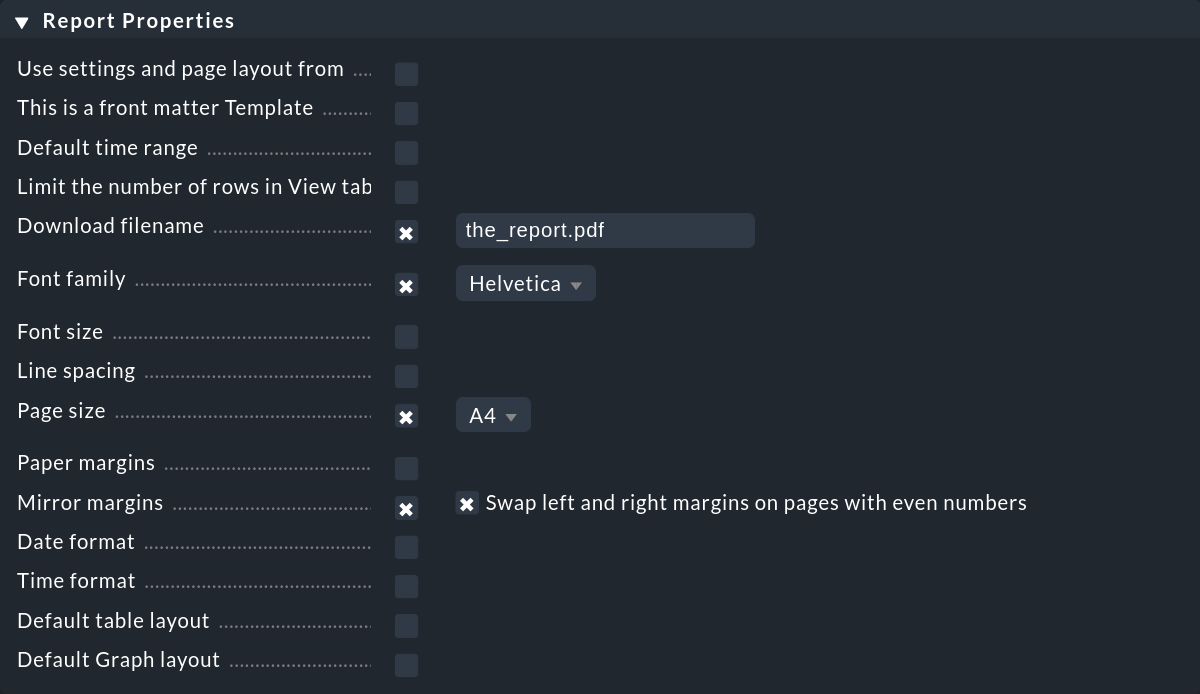
In the second box, you will find the Report Properties. This is where you configure values for font, page format, time and date settings, report layout, and file name for downloads.
Copy your company logo to the ~/local/share/check_mk/reporting/images/ directory and save it as logo_mk.png file.
From now on this logo will be displayed on all reports.
Note: Currently, you customize the existing report template to suit your needs. Alternatively, you can create a complete, new report template according to your company specifications, e.g. to reflect the company’s corporate design.
Inserting an additional image
Images that you want to use as design elements in your reports must have been previously stored in the ~/local/share/check_mk/reporting/images/ directory.
Click the Add page element button in the report creation.
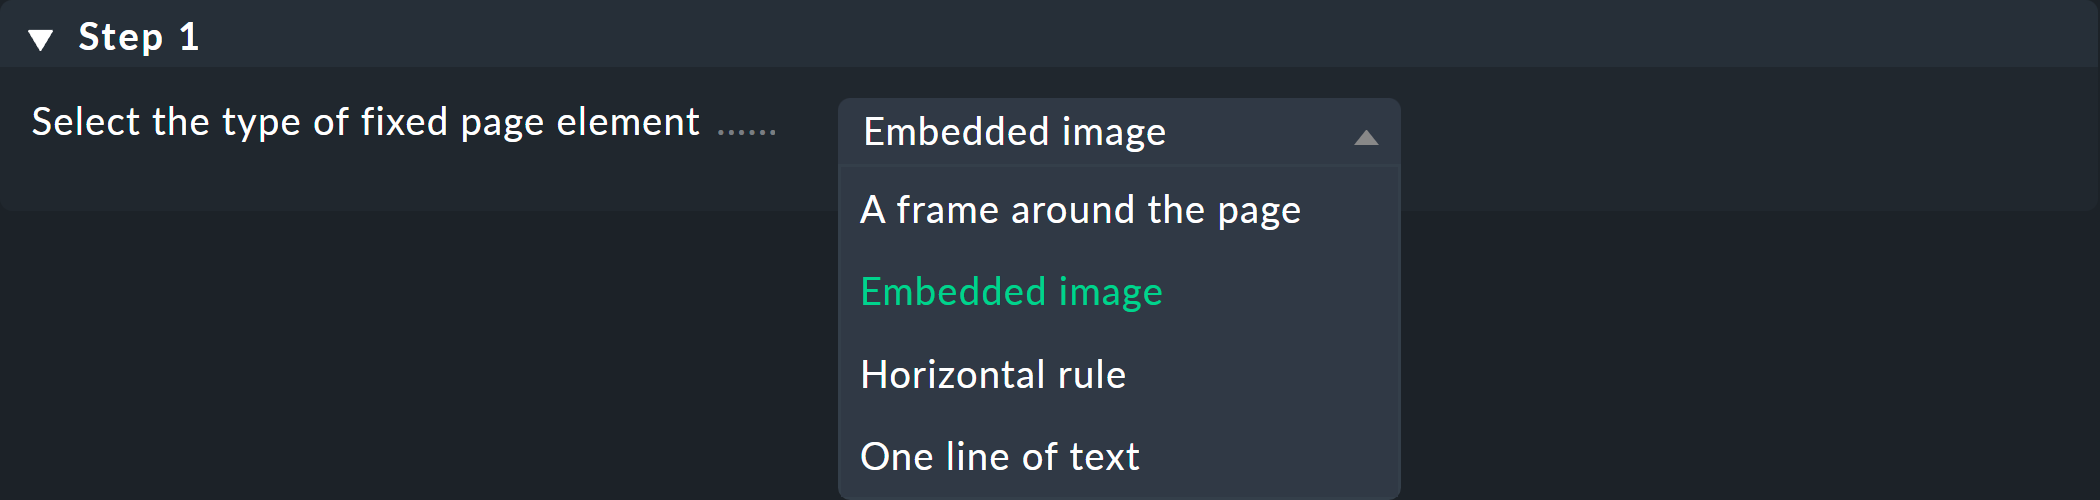
In the following Step 1, select Embedded image as type and continue with ![]() Continue.
Continue.
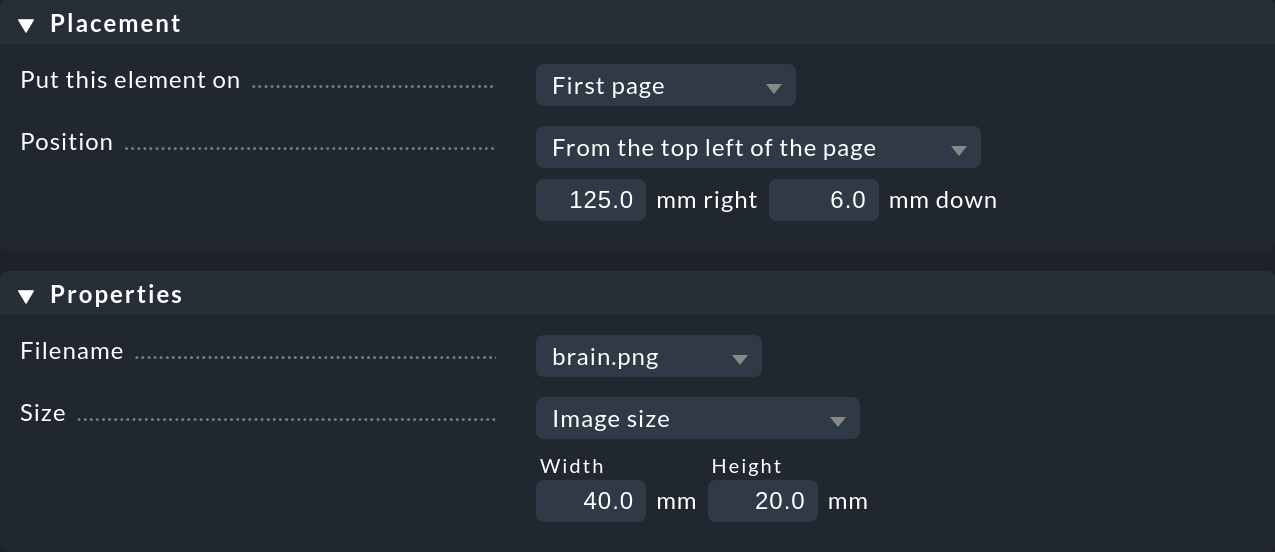
The following dialog is used to set detail settings such as position, file name and size.
When you are done with all settings, save with ![]() Save.
After that you will get to the report overview and see the inserted image in the report.
Save.
After that you will get to the report overview and see the inserted image in the report.
6. Scheduling a report
You can use the report scheduler to have existing reports created and sent automatically. You can reach the scheduler on the Edit Reports page via Reports > Scheduler.
6.1. Sending a report regularly
Open a new schedule using Scheduled reports > Add schedule, then select the report and click ![]() Continue.
Continue.
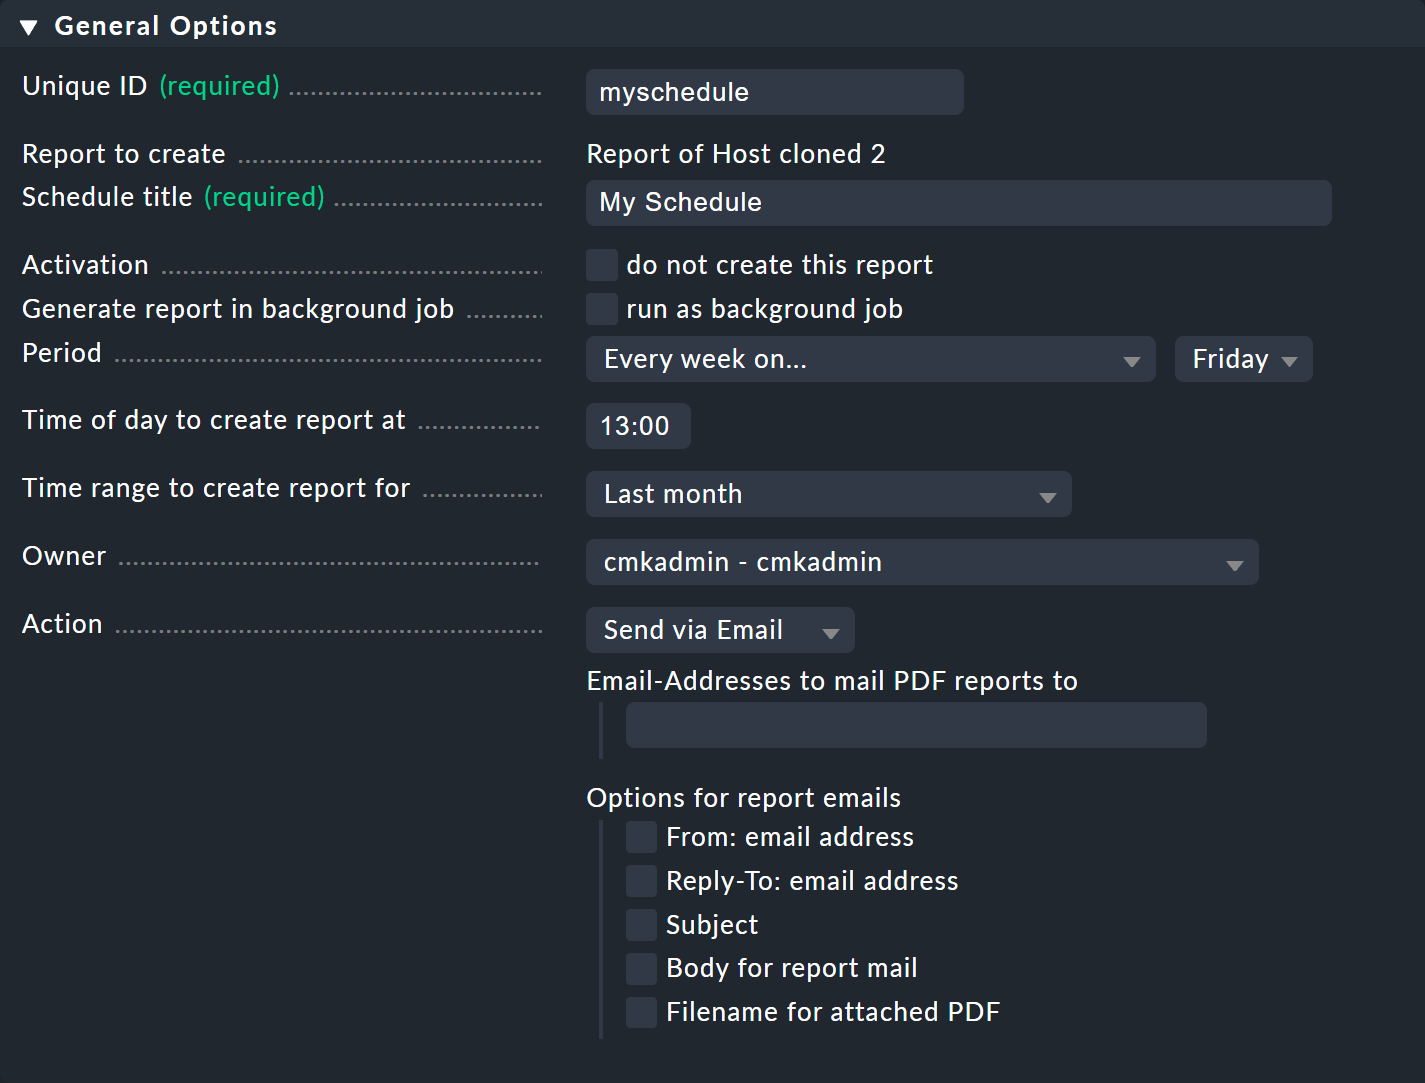
In the General Options box, you specify basic settings such as title, creation time, reporting period, and so on:
Under Context / Search Filters you will find the usual filter options, depending on the selected report. Then save the schedule to return to the list of your scheduled reports.
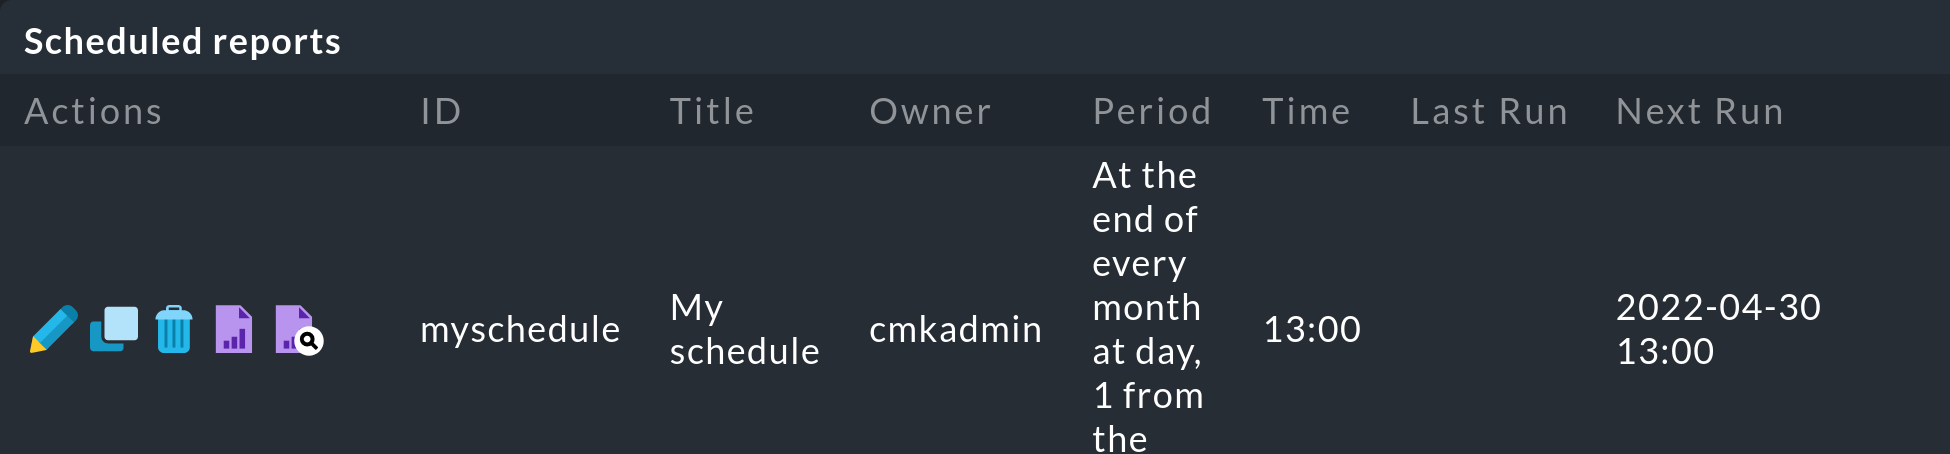
In the list you will also find information about the last time the report was generated/sent, if there was an error, when it will be generated/sent the next time and some more (slightly shortened here):
Entries in the list are managed using the five icons at the beginning of an entry:
|
Edit report settings |
|
Copy report settings |
|
Delete scheduled report |
|
Create report |
|
Display preview |
Note: Sent reports are not stored in the site.
6.2. Storing a report locally on a regular basis
Instead of sending the report, you can also store it locally. To do this, select the Action - Store locally:
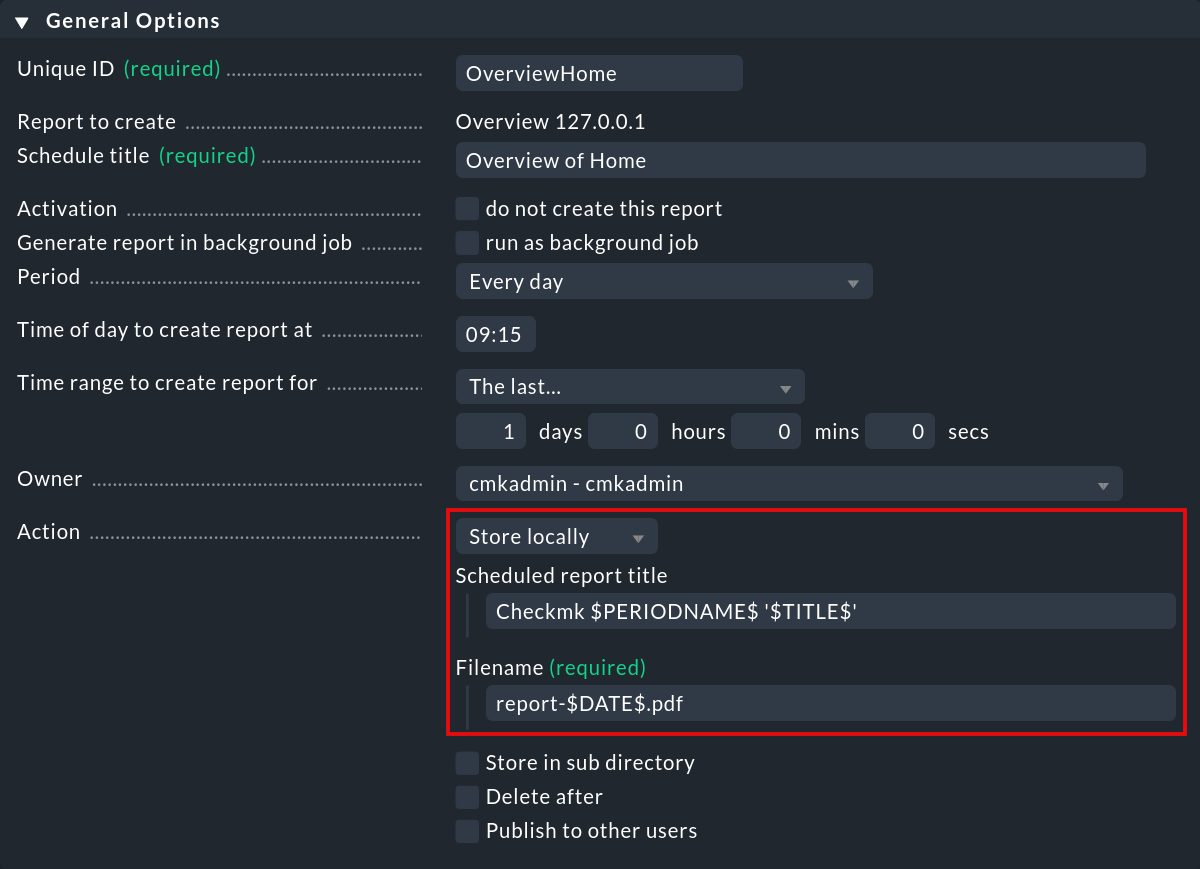
Then set a file name and optionally a report title. To be able to build a history of reports - instead of overwriting the previous version every time the report is created, Checkmk provides various macros (=text modules).
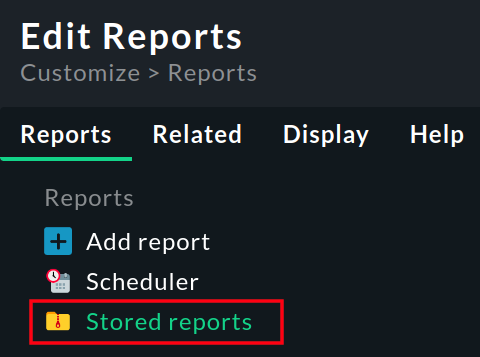
The overview of all locally stored reports can be accessed in the Edit Reports window via the Reports > Stored reports menu item:
7. Global defaults for reports
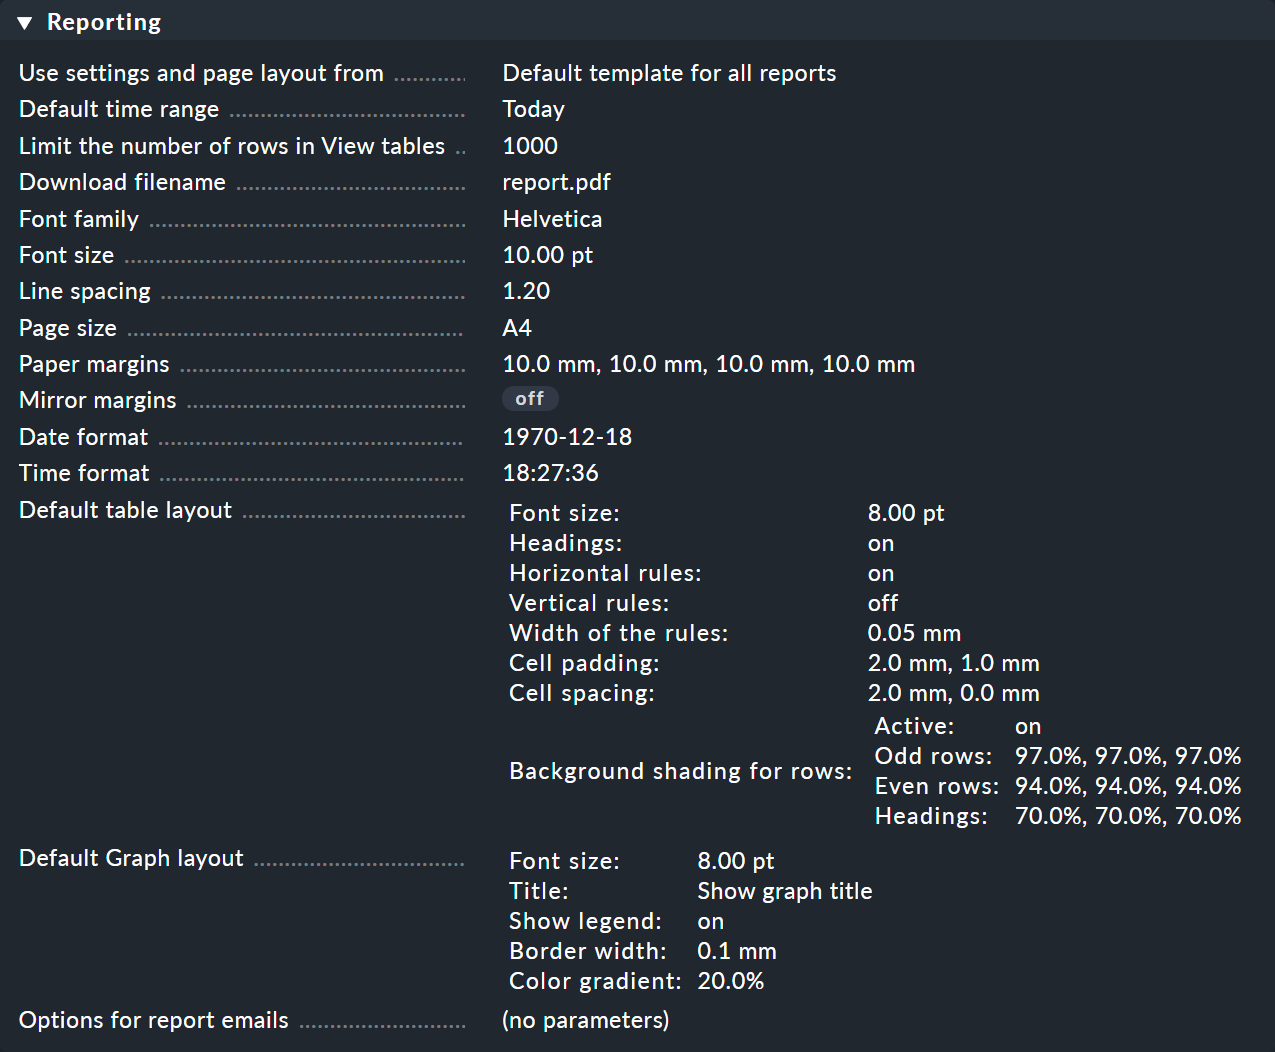
Some basic settings for reports can be set globally, for example to create and manage a corporate design centrally. Settings for an individual report then only specify the deviations from the corporate design. You configure the global settings for reports via Setup > General > Global settings > Reporting.
8. Creating your own report template
Checkmk provides a built-in, clear report template that you can add to and use as you wish, as described above. However, especially reports that are passed on to management look even better if they correspond to your own company layout. For this purpose, there is an option to create your own report template.
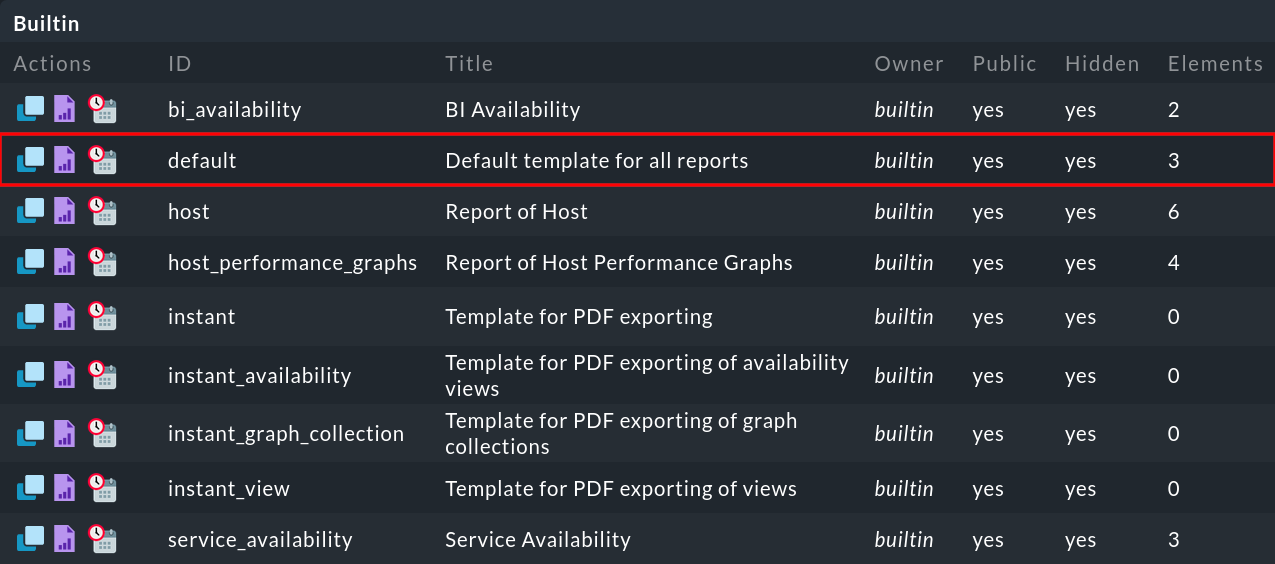
By default, the Default template for all reports is used for all reports in Checkmk:
To create your own report template, copy the default template using ![]() .
First, change Unique ID and Title.
.
First, change Unique ID and Title.
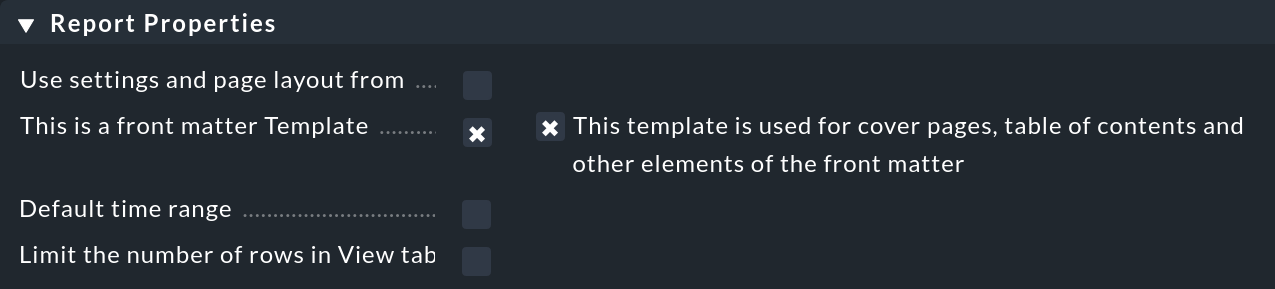
To mark this report template as such, in the Report Properties box check This is a front matter Template:
From the first save, you will then find this template in the custom report templates:
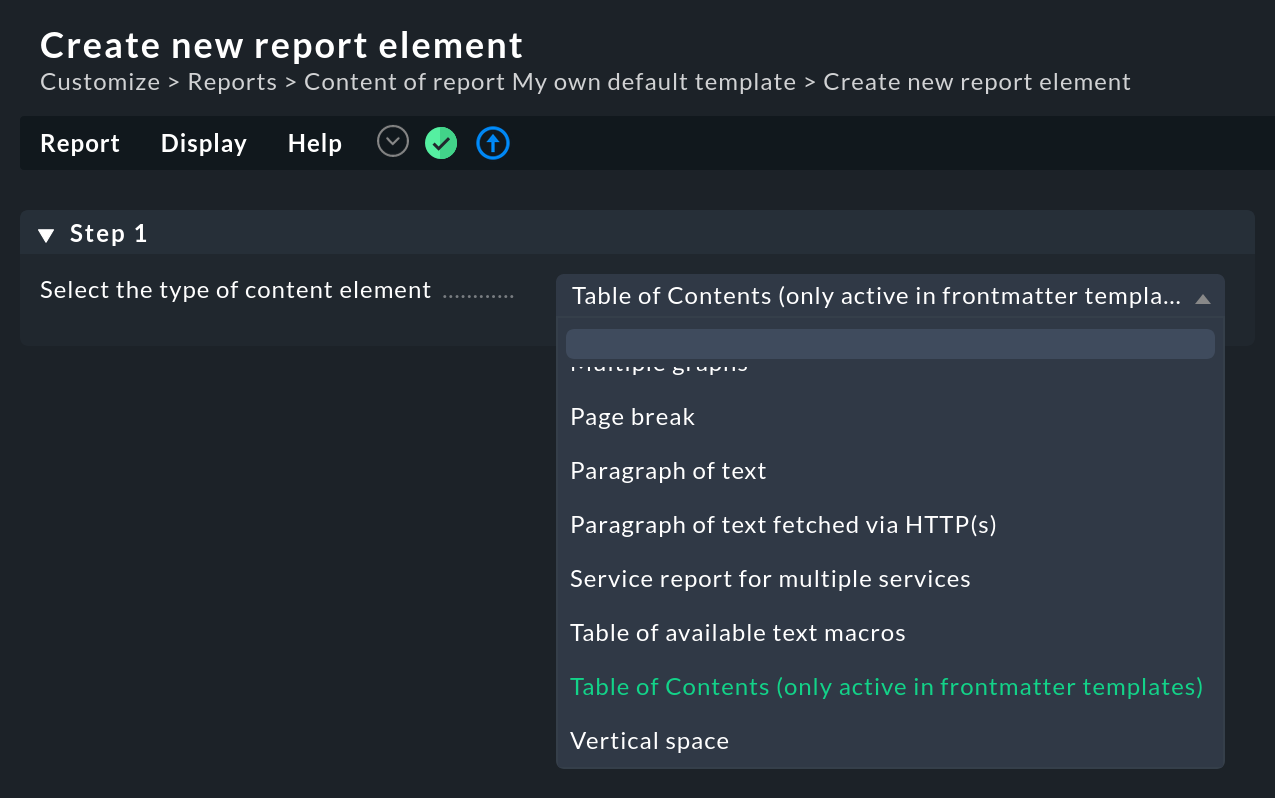
Now you can customize this template according to the above descriptions just like any other report. Change the page layout, font, line colors, etc. Also set the content elements at the same time. Exclusively for report templates there is also the report element Table of Contents:
To create one of your reports now with the new template, change the settings in the report’s Report Properties one more time. Set the Use settings and page layout from option to the name of your new template:
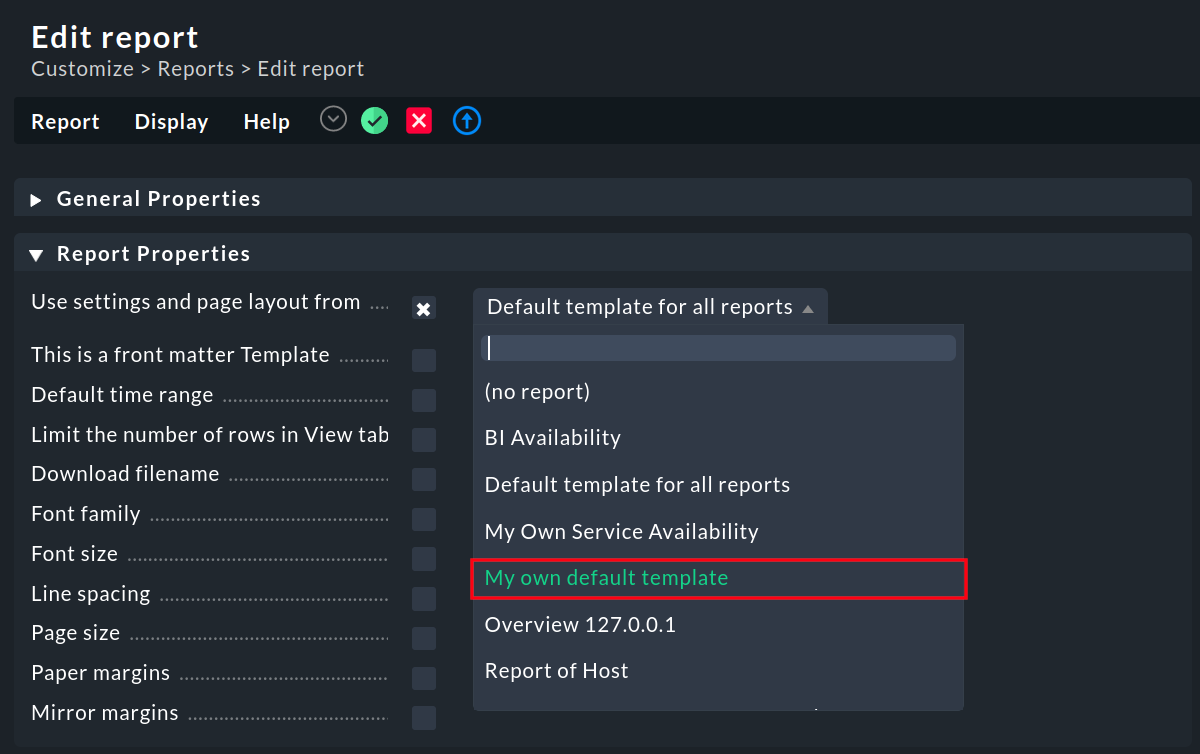
Your report will always be created with this template in the future from the time you save it.
9. Supplementary information
9.1. Content elements
Content elements are listed when you select Reports > Add content when editing a report.
| Element | Function | Options |
|---|---|---|
|
Complex view on definable topic |
Multilayer selection |
|
List of availability states |
Selection of data source and further restrictions of data possible |
|
Graphs based on multiple data series |
Use of a template, selection of data source and various layout settings possible |
|
Individually created graphs |
Standard layout options |
|
Static image |
Size can be specified. The position of this image is dynamic, relative to surrounding content elements. |
|
Forecast view |
Specify hosts, services and time periods to be considered |
|
All graphs in a collection |
Default layout options |
|
Heading in headers of different hierarchies possible |
|
|
Status reports for multiple hosts |
Definition of sub-reports to be included including structuring |
|
Metrics of a single service as graph |
Standard layout options |
|
Collection of multiple graphs on a single topic |
Selection of data source, different design features of the graphs |
|
||
|
Static text |
The position of this text is dynamic, relative to surrounding content elements. |
|
Service report collection for multiple services |
Default of sub-reports to be included, different design features of individual reports |
|
Overview of all available macros |
Name and current output of the macros are displayed |
|
Table of contents |
Only active in report templates |
|
Free space |
Height as well as behavior at a start of page can be defined |
9.2. Page elements
Page elements are listed when you select Reports > Add page element when editing a report.
| Element | Function | Options |
|---|---|---|
|
Frame around the entire page |
Optionally around all or specific pages |
|
Static image |
Optionally on one or on specific pages. Position and size can be specified. This image does not move with the report content. |
|
Horizontal line |
Optionally on all or specific pages. Position, color and thickness can be specified. |
|
Static line of text |
Optionally on all or specific pages. Position and font properties can be specified. |
9.3. Available macros
| Name | Content |
|---|---|
|
Report start time |
|
Current time |
|
End time of the report |
|
Start time of the report in Unix time |
|
Current time in Unix time |
|
End time of the report in Unix time |
|
Current Checkmk version |
|
Current date |
|
Start date of the report |
|
End date of the report |
|
Report start date and time |
|
Current date and time |
|
End date and time of the report |
|
Number of pages |
|
Title of the report |
|
Time period of the report |
|
User account |
|
User ID |
|
Name of the site |
|
Name of the report |
10. Files and directories
| File path | Description |
|---|---|
|
These files store the customized and newly created reports of the respective Owner of the reports. |