1. Setup menu
Your entry point to the configuration of Checkmk is the Setup menu, which you can open via the navigation bar:
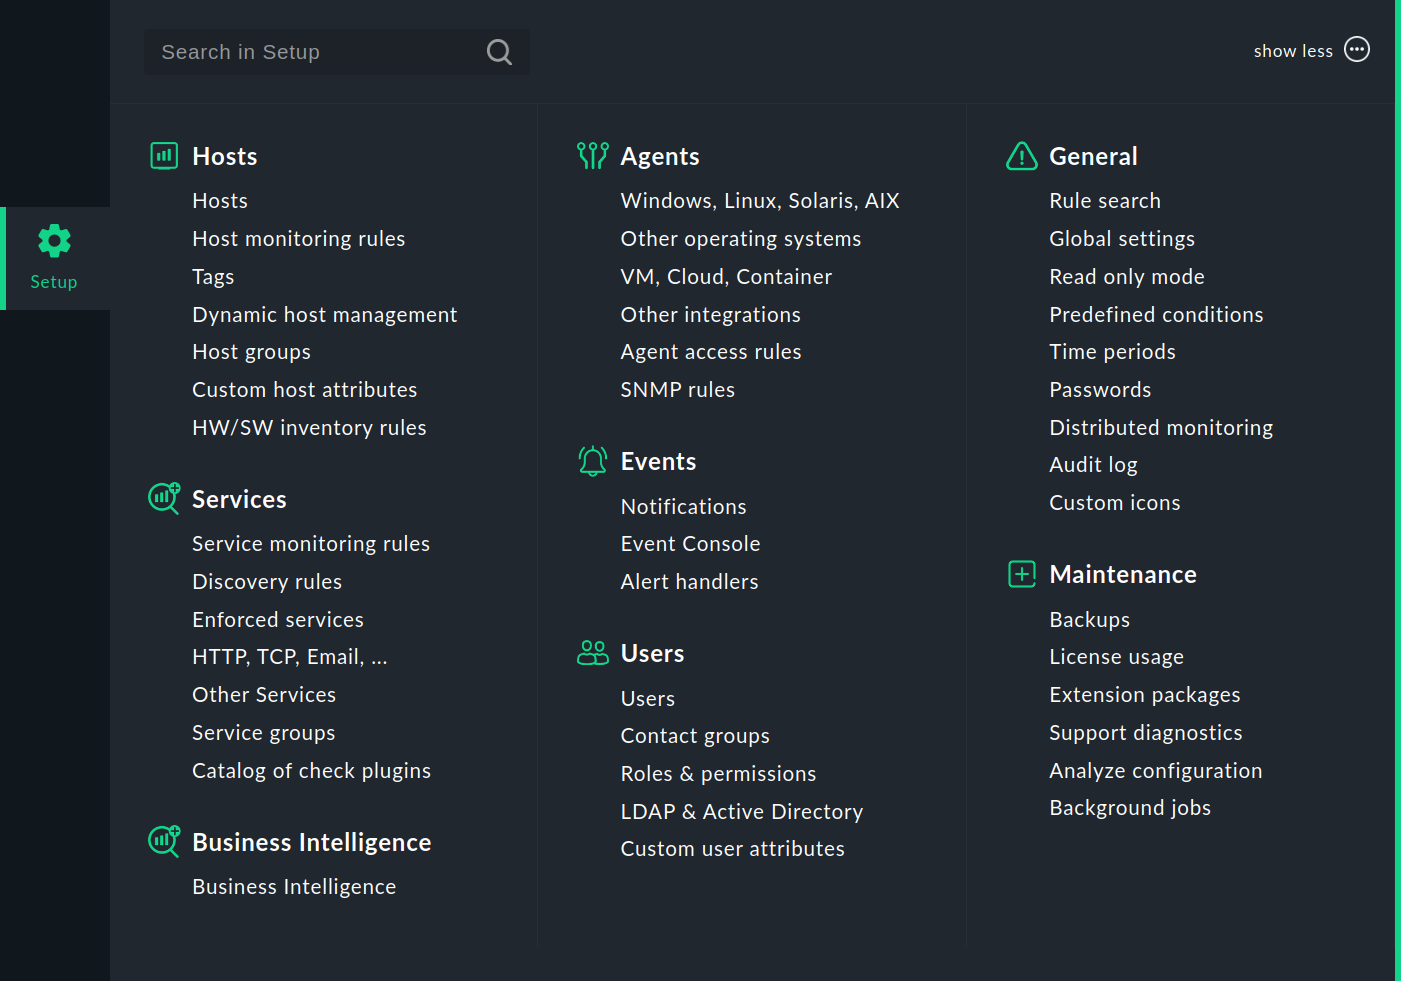
In this menu you will find the tools with which you can set up and configure Checkmk. The menu is divided into topics. Below each topic you will find the menu items.
The following table gives an overview of the menus and in which part of the User guide you will find more detailed information.
| Menu | Content |
|---|---|
Hosts |
The administration of hosts to be monitored. Here you will find the hosts, the host monitoring rules, the host tags, the connections for the dynamic host management, the host groups and the rules for the hardware/software inventory. With the Custom host attributes, you can create your own attributes that can be added to the properties of the hosts. |
Services |
The configuration of services running on the hosts. Here you will find the rules for service monitoring, for service discovery, for enforced services (manual checks) and for monitoring network services like HTTP, TCP, email (active checks). In addition, you can open the list of service groups and the catalog of check plug-ins in Checkmk. |
Business Intelligence |
Getting started with the management of Business Intelligence (BI). |
Agents |
The monitoring agents that transmit the data from the hosts.
Here there are the
Checkmk agents for Linux, Windows and other operating systems available for download, and in the |
Events |
The processing of events — with rules for notifications, Event Console and alert handler. |
Users |
The topics relating to users, roles and permissions. You can call up the lists of users, contact groups and roles and set up the user management with LDAP/Active Directory. |
General |
Comprehensive topics can be found here, including Rule search for finding rules (again), the Global settings, the list of time periods and the entry to distributed monitoring. With Audit log you can display all changes ever made to the configuration environment and with Read only mode temporarily prevent such changes. |
Maintenance |
This topic summarises actions to maintain Checkmk, such as creating backups, the handling of Checkmk extension packages (MKPs) or the creation of support diagnostics data. |
The configuration is stored by Checkmk in a conventional text data format which experienced users can edit manually, or even create using scripts.
2. Quick setup
Once you have more experience in working with the Setup menu, you will have learned its icons by heart — especially if you have the icons in the mega menus displayed for each menu item, as you can set in the User menu.
Then, for quick access, we recommend the Quick setup snapin for the sidebar with its icons for each Setup menu item:
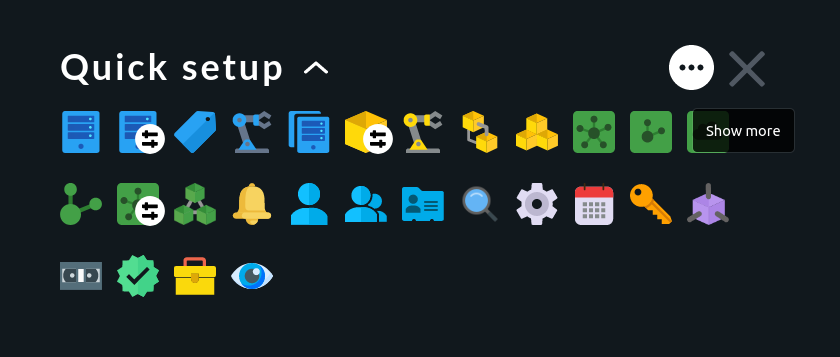
By the way, there is also the complete Setup menu for the sidebar. This snapin is called Setup.
3. Activating changes
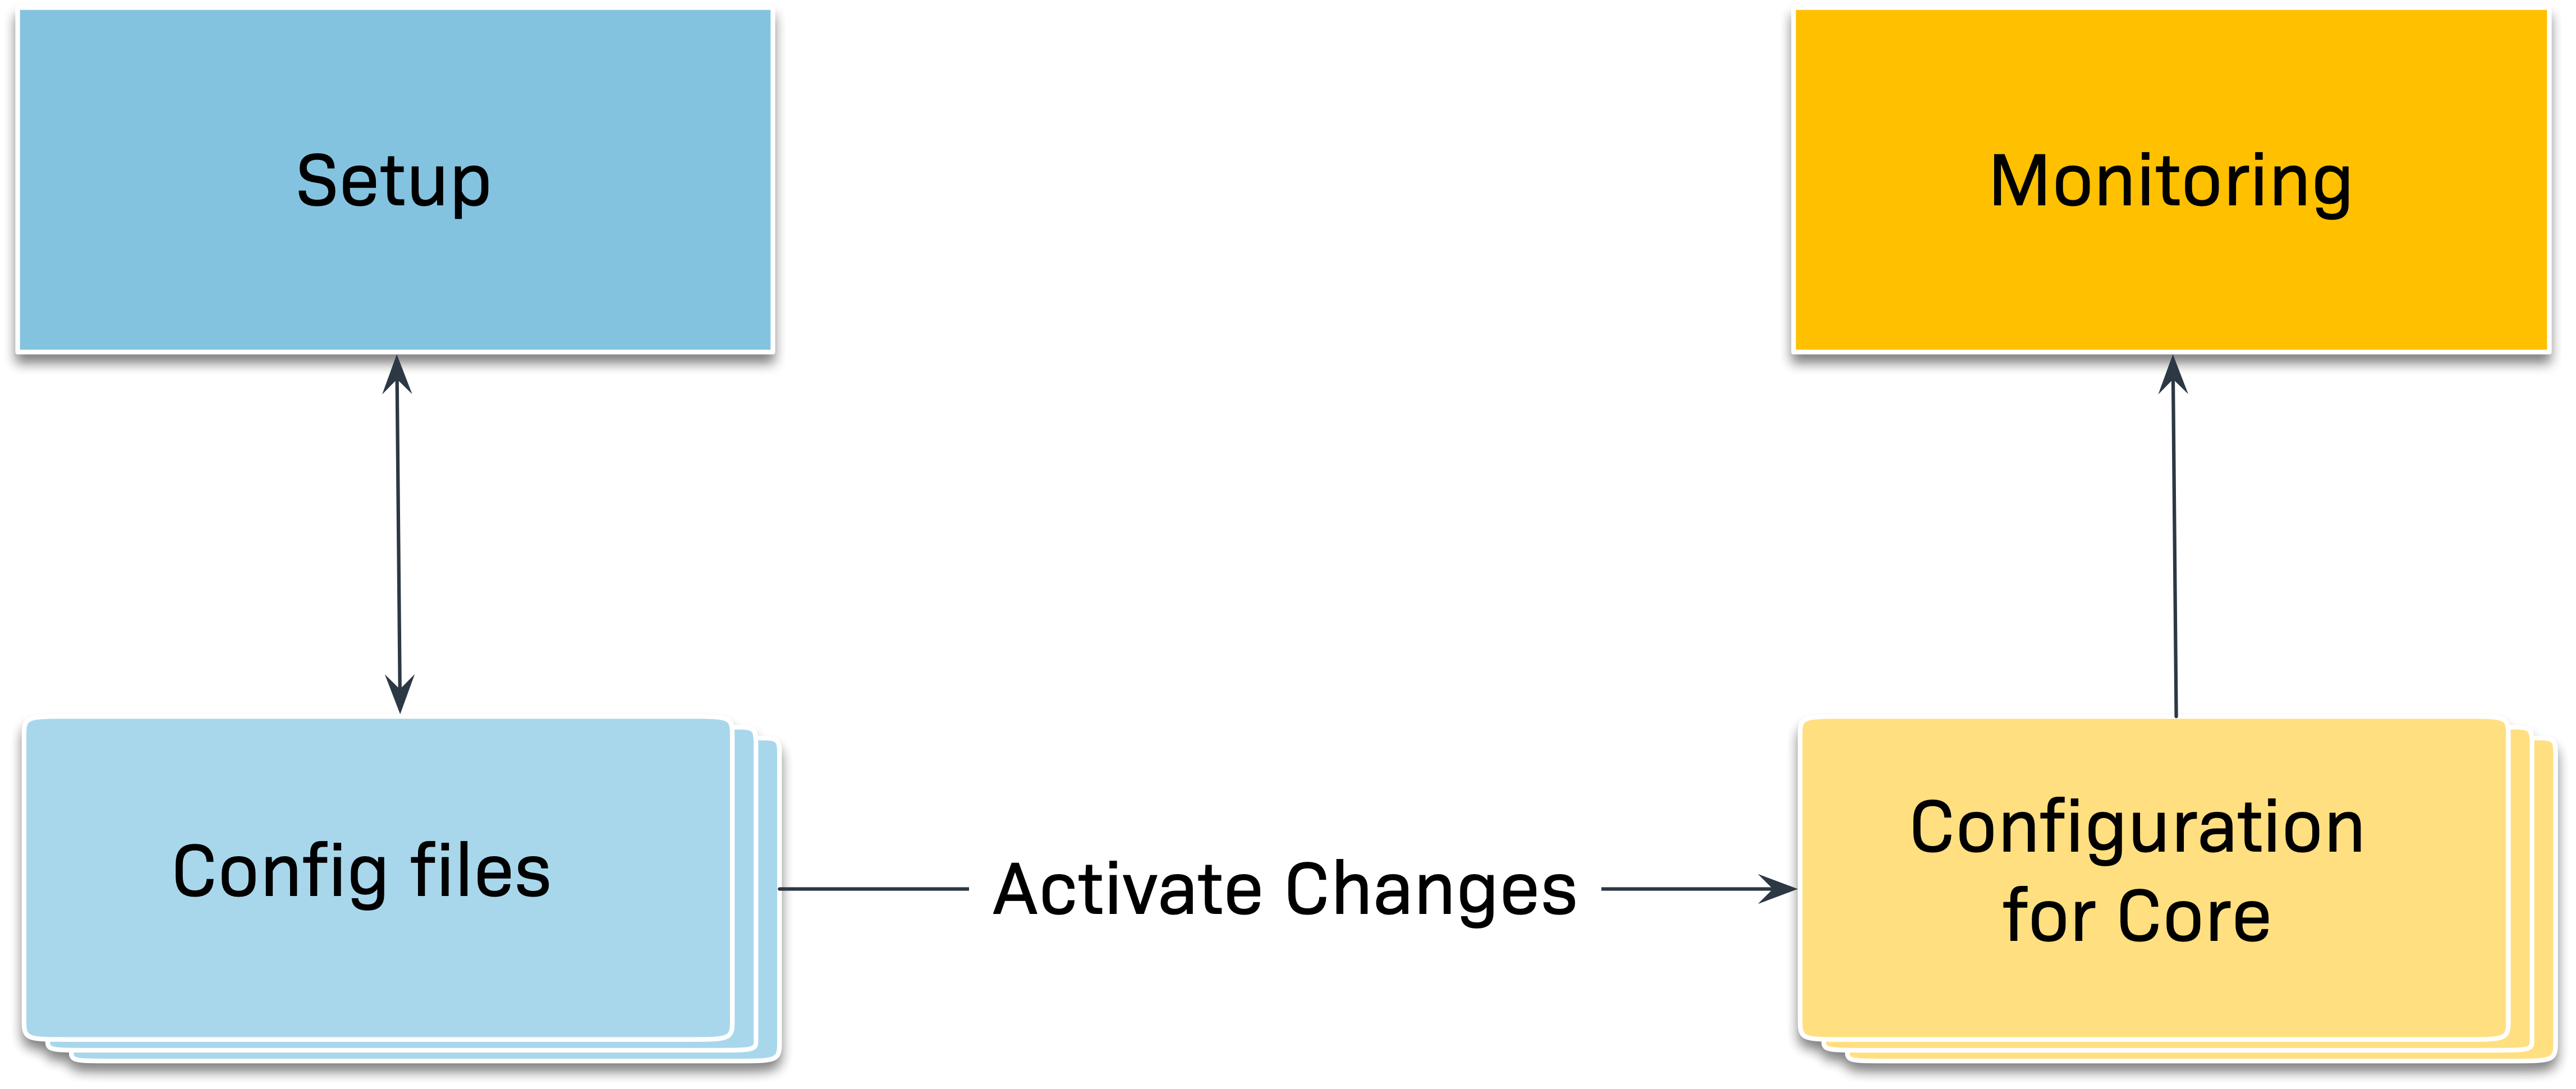
Checkmk initially saves all changes you make only in a temporary configuration environment, in which you manage hosts, services and settings, and which does not yet affect the currently-running monitoring. Only by 'activating the accumulated changes' will these be transferred to the production monitoring environment.
Changes in the configuration — e.g. the addition of a new host — therefore initially have no influence on the monitoring. Only through activation do all changes that have accumulated since the last activation become active as a ‘bundle’ at the same time.
This might seem a little cumbersome, but it does have the advantage that more complex changes can be prepared without haste in advance before being put into production. For example, after adding a new host, you might want to define thresholds or remove some services before ‘arming’ the whole thing.
Whenever you make a change to the monitoring configuration using the Setup menu, this change will at first be picked up and held as pending.
You will find information on the top right of each page of the configuration
environment about how many changes have accumulated so far that are not yet
activated, e.g. the button ![]() . This button will open a list of these pending changes:
. This button will open a list of these pending changes:
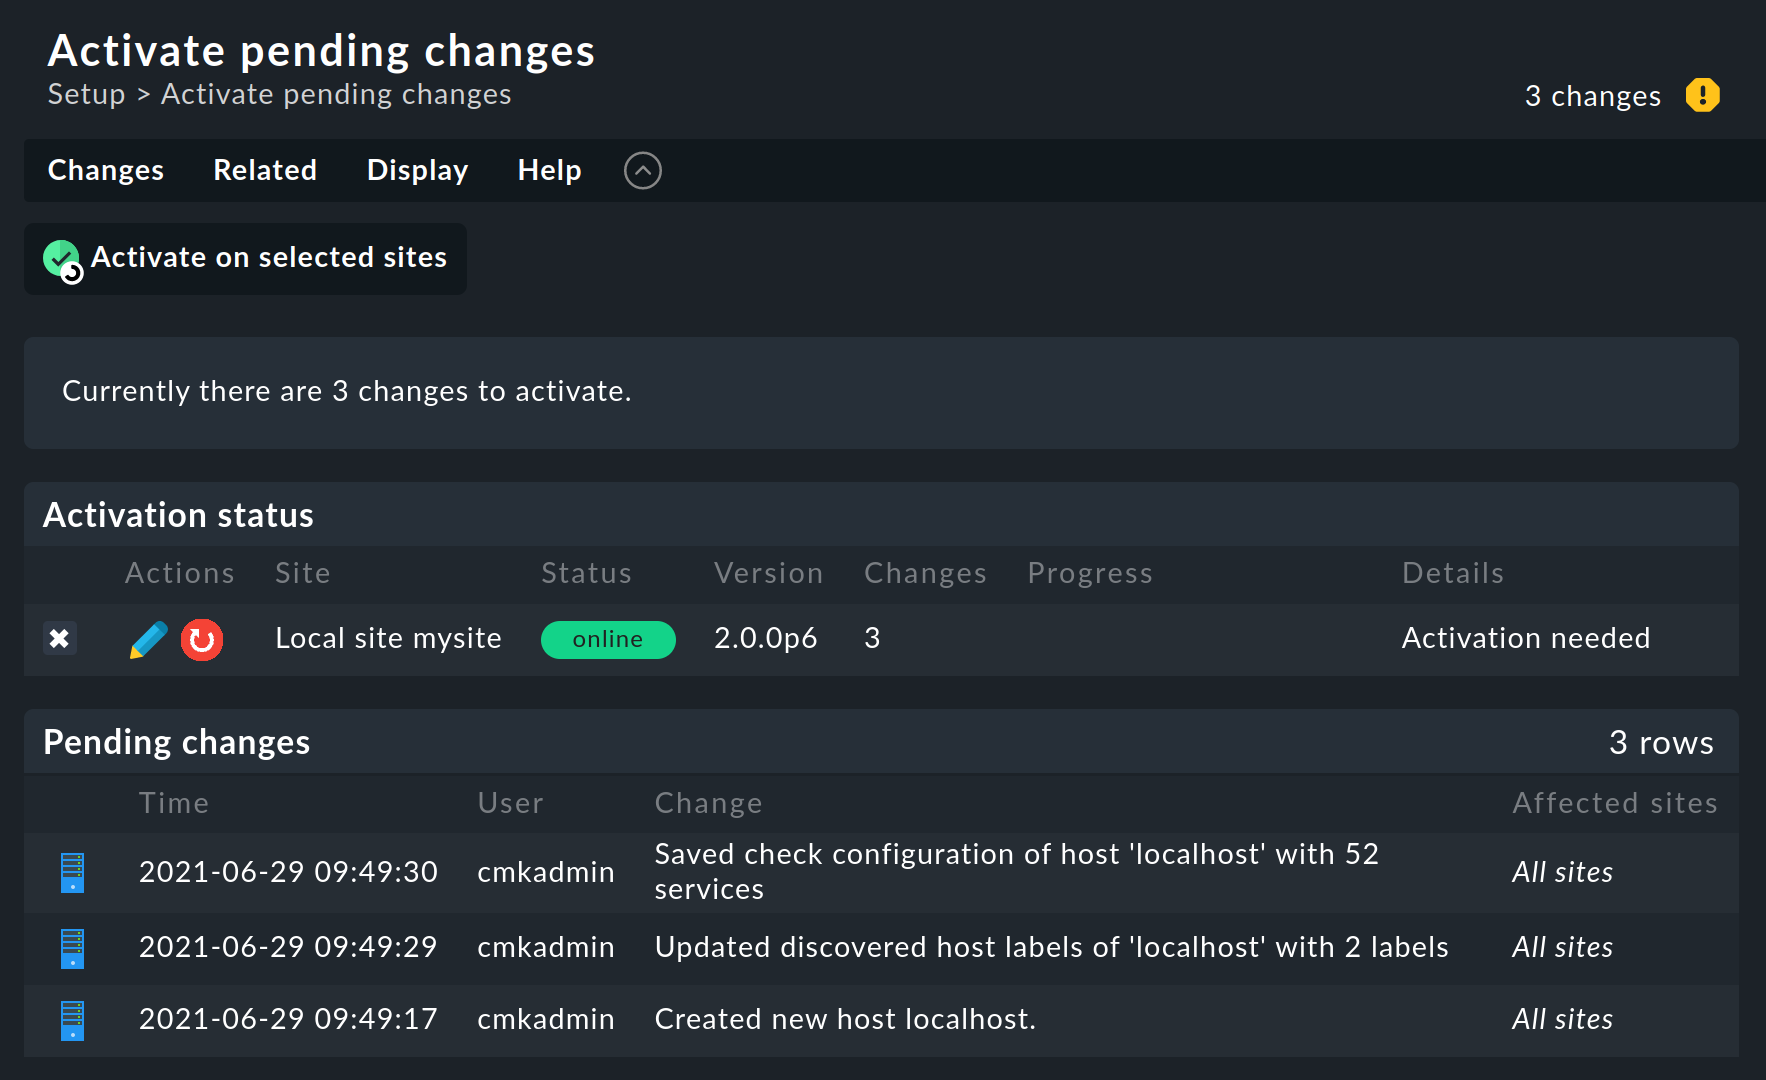
Clicking Activate on selected sites will create a new configuration for the monitoring core from the configuration files and instruct the core to immediately begin using the new configuration:
This clears the list of pending changes. These entries are not lost however — they can subsequently be called up via Setup > General > Audit log. There you will find the contents of the log file with all activated changes that have ever been made in the site. The Audit log can be filtered and shows today’s changes by default.