1. Introduction
1.1. Background and motivation
Our integration of Datadog is aimed at all our users who already use Datadog in their organizations. Through our integration we have reduced the need to be continuously checking two monitoring systems, and have also closed the gap between the two systems.
The integration allows us to correlate data from the two systems, to speed up any root cause analysis and at the same time facilitate communication between Checkmk and Datadog users.
1.2. Monitors and events
Concretely, our connection allows to monitor and display any so-called monitors and events from Datadog in Checkmk. You can of course also be notified about events from within Checkmk in the usual way.
The integration of monitors and events from Datadog is provided via a special agent.
2. Setting up the integration
2.1. Generating and copying keys
For data mining, our special agent uses Datadog’s API. To secure access to this API two keys are needed — one API Key and one Application Key each. We recommend creating two new keys for use by Checkmk and using these exclusively for retrieval by Checkmk.
At the time this article was written, you can find the corresponding keys or the option to create new keys in Datadog by clicking on the button in the lower left corner where your user name is located. Click there on Organization Settings. Under the heading ACCESS you will find the two entries API Keys and Application Keys. Create a new key in each of these two submenus using the New Key button.
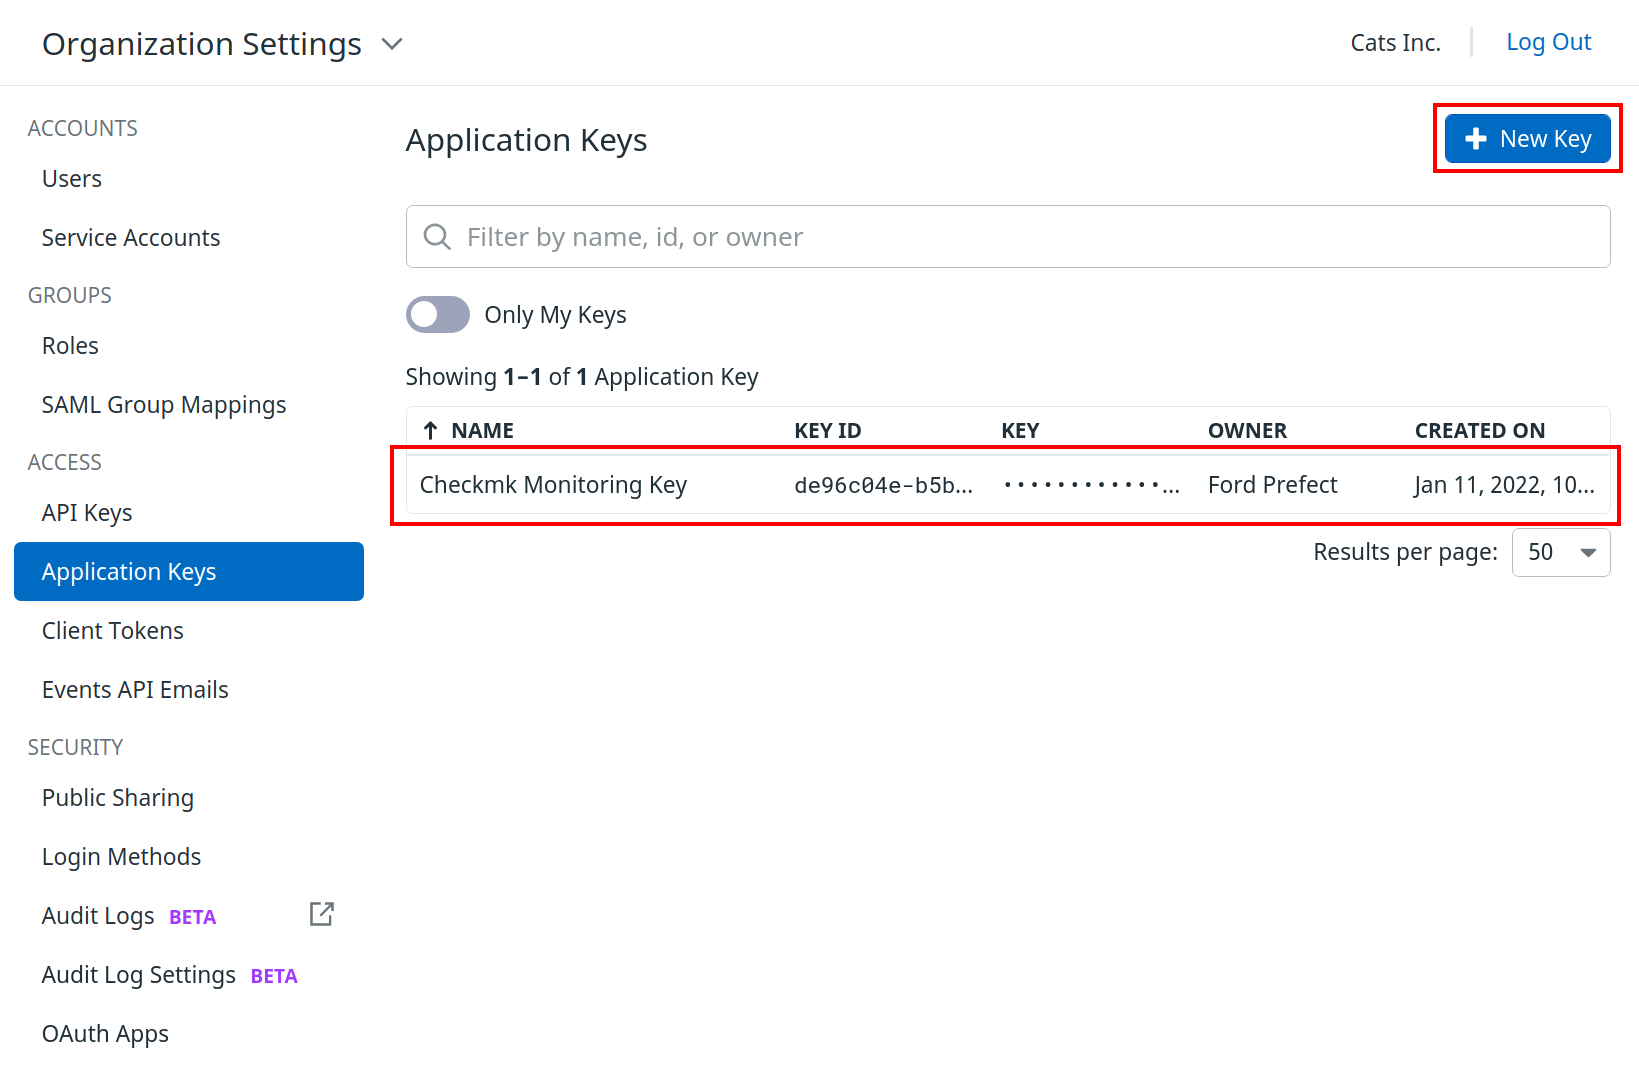
To be able to insert the two keys into Checkmk afterwards, it is recommended to copy them. To do this, click on the line of the respective key and then on Copy.
Note: During the writing of this article the location of the keys has already changed once. If you do not find the menu items described above, please consult the Datadog documentation.
2.2. Creating a host
Depending on how you want to integrate Datadog into Checkmk there can be different ways to assign the obtained data to hosts in Checkmk. More about this later. For now, let’s focus on a simple setup and assign all data to a host.
To do this, create a new host in Checkmk in the usual way and name it 'mydatadoghost', for example. Since this host will only receive data via the special agent for the time being, set the option IP address family to No IP.
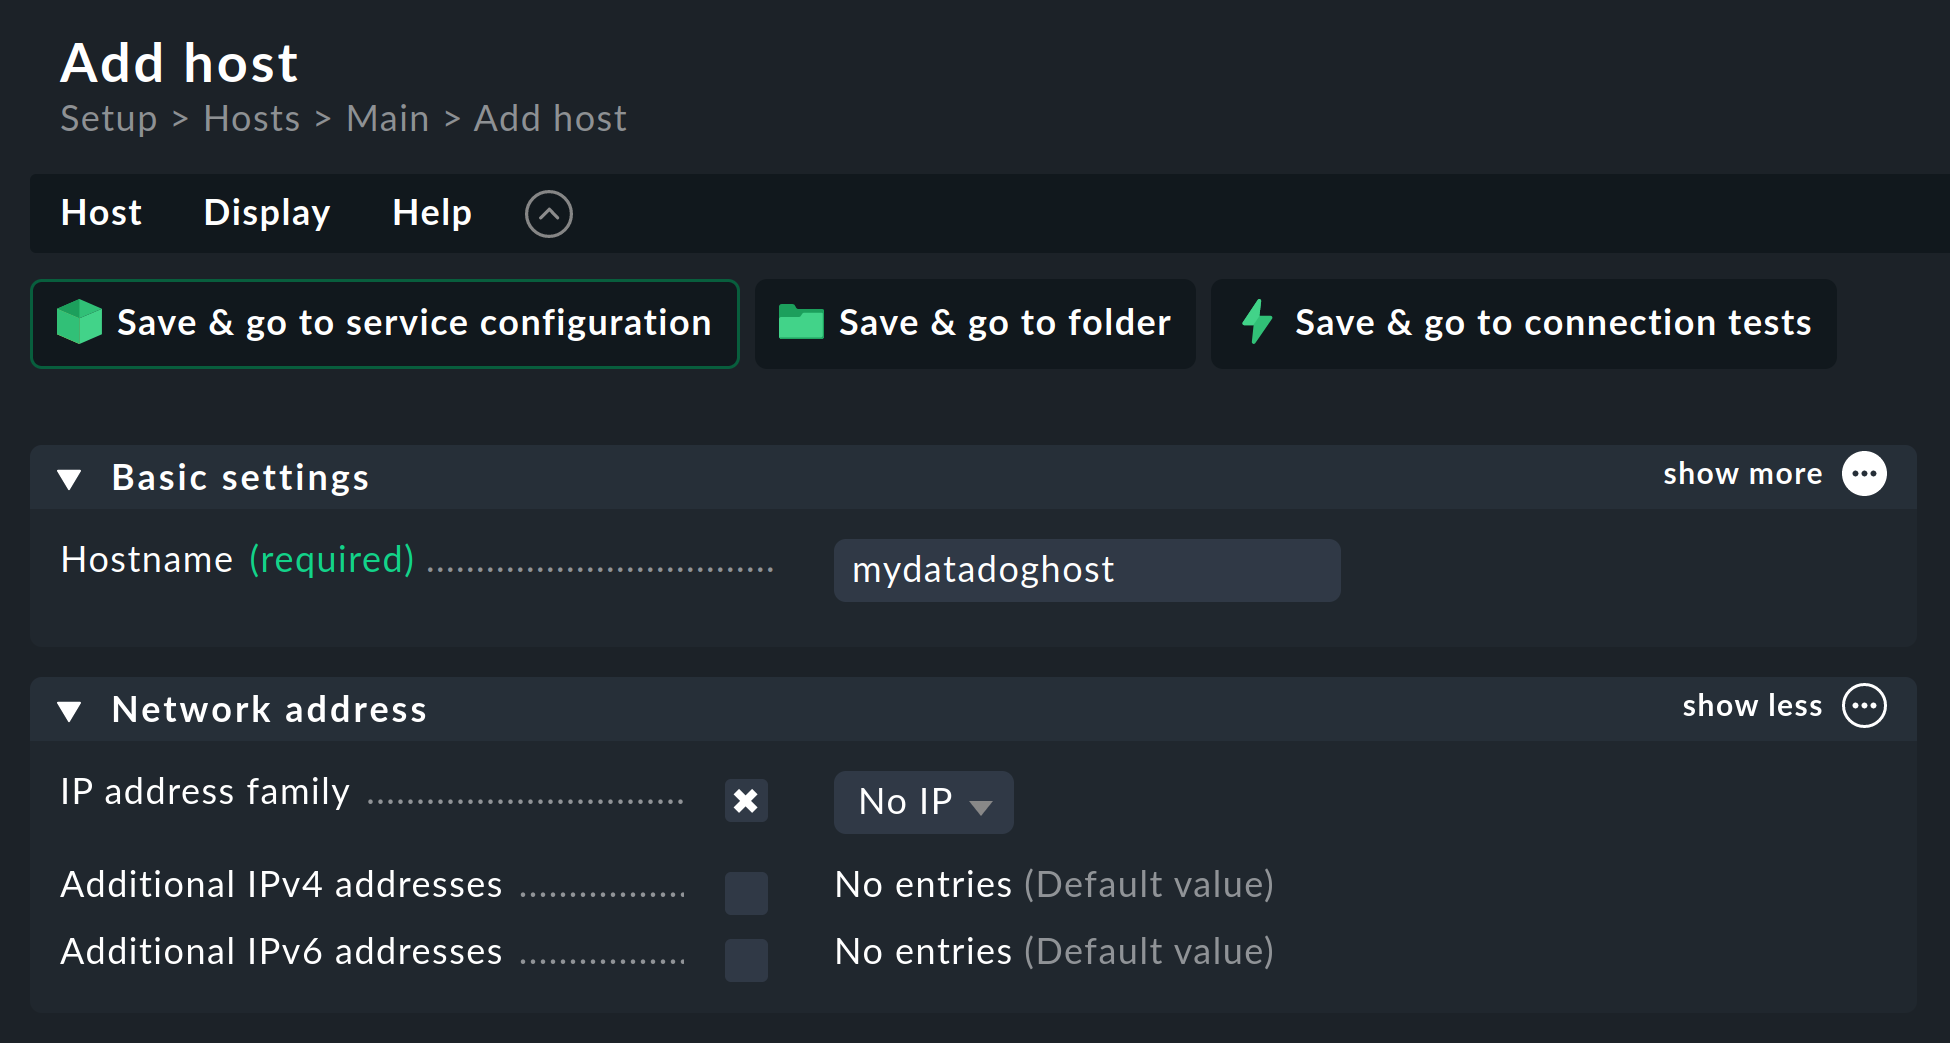
Make all other settings according to your environment and confirm your selection via Save & go to folder.
2.3. Creating a rule for the Datadog agent
Next, you need to set up the special agent via the Setup > Agents > Other integrations > Applications > Datadog rule set. First, copy the two keys you created earlier into the fields provided, or alternatively use the password store from Checkmk. After that, check if the pre-entered API host corresponds to that of your Datadog instance. To do this, simply compare your Datadog instance’s URL with the default entry in the rule and edit this if necessary.
If you have Checkmk communicating with Datadog via a HTTP proxy, enter it in the following option.
Now you can decide which data you want to transfer from Datadog to Checkmk. Here you can choose between the so-called monitors and events.
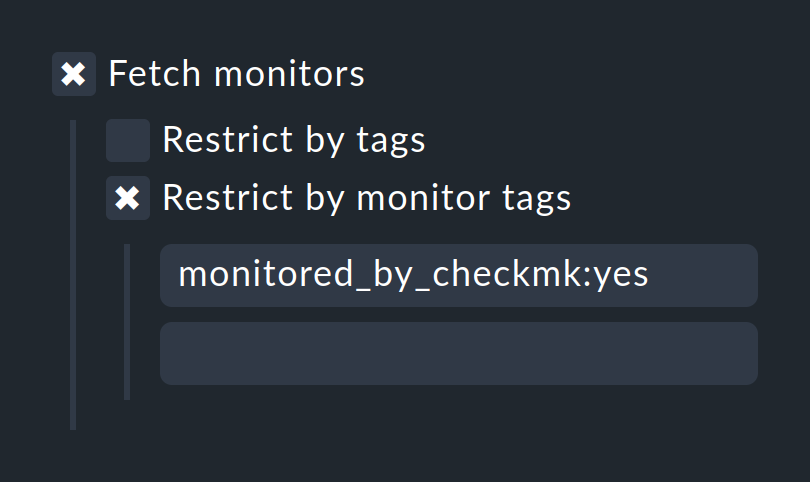
Fetch monitors
If you enable the monitoring of monitors, you have the option of filtering the data to be transmitted, using tags within Datadog. Especially in large environments, it is recommended to tag monitors you want to see in Checkmk with an appropriate tag in Datadog (e.g. `monitored_by_checkmk:yes'). Then enter these tags under Restrict by monitor tags.
Furthermore, it is also possible to use other tags that appear in the configuration of the monitor in Datadog for filtering. For example, if you have set up a monitor of type Host in Datadog, which refers to all hosts within Datadog that have the host tag 'checkmk:yes' set, then you need to enter this under Restrict by tags.
It is additionally also possible to use other tags that appear in the configuration of monitors in Datadog for filtering. For example, you could tag hosts with 'checkmk:yes' in Datadog. If you then create a host monitor in Datadog that refers to all hosts with that tag, you can also use that same tag in Checkmk under Restrict by tags. This way, with very little effort you will get all monitors from Datadog that contain the tag 'checkmk:yes'. Of course, this works not only for host tags, but for all tags from which monitors can be created in Datadog.
If you leave both options disabled, all monitors will simply be transferred from Datadog to Checkmk.
One service will be created in Checkmk for each Datadog monitor you can then monitor in Checkmk.
Fetch events
With the special agent for Datadog you also have the possibility to transfer events from Datadog directly to Checkmk’s Event Console. To limit which events should be transferred, you can again use tags from Datadog. Furthermore, you can specify a time frame from which events should be transferred. This Maximum age of fetched events should not be shorter than the check interval, otherwise events might be missed. However, since it can happen that Datadog creates events with a timestamp that lies in the past, the time period should not be too short. The default 10 minutes are a good starting point.
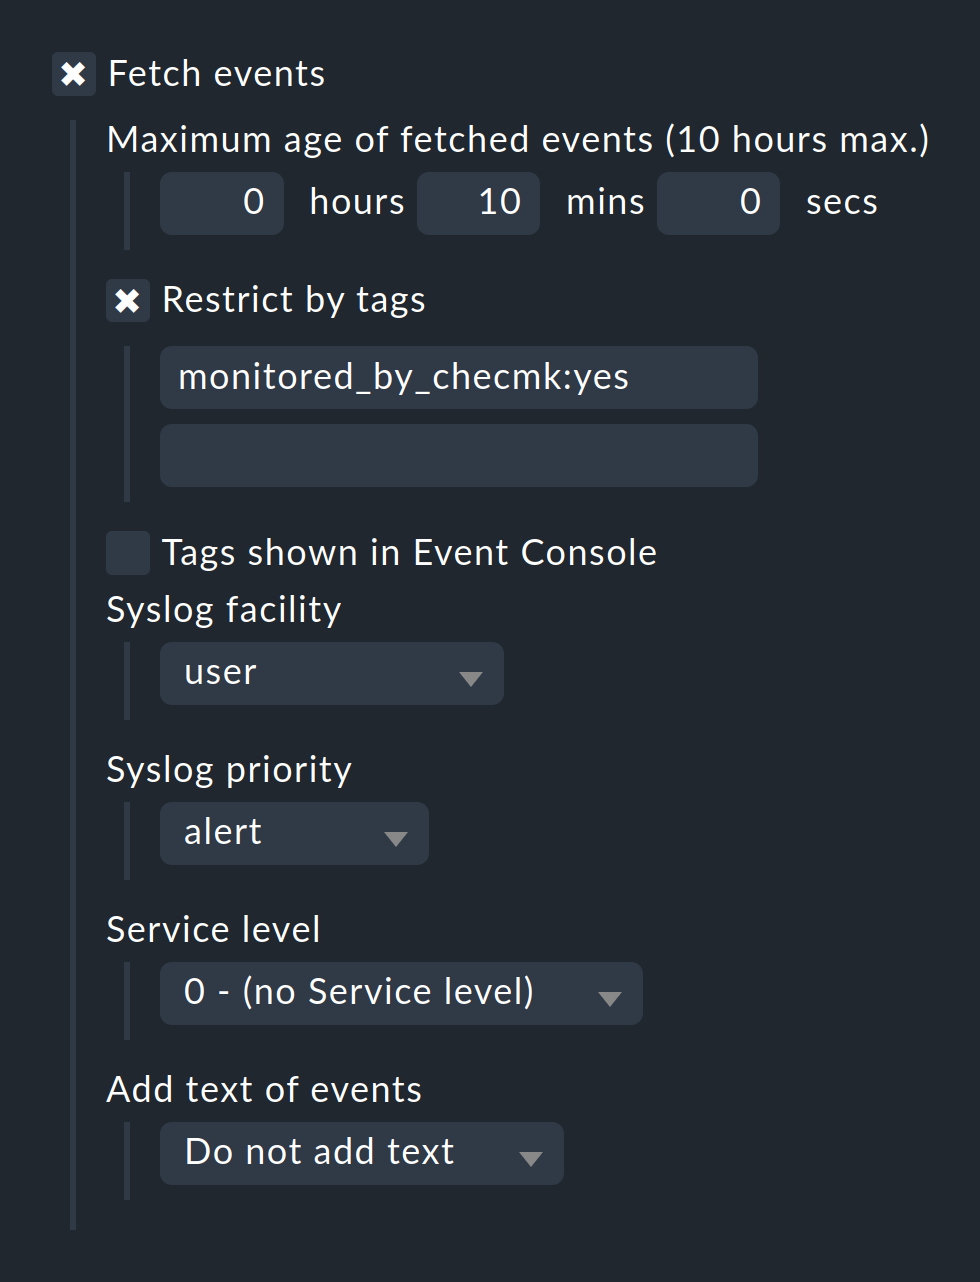
All other fields in this part of the rule refer to which parameters should be used to create the events from Datadog in the Checkmk Event Console. A detailed description of all of these fields can be found in the Event Console article in its Syslog priority and facility and Service level sections.
For the events, only a single service is created on the host in Checkmk, which informs you how many events were transferred.
Setting explicit host and performing service discovery
To ensure that the monitors and events you fetch from Datadog with this rule only arrive on one host, you must add the host created earlier to Conditions > Explicit hosts at the end. Then click Save. Once you have performed a service discovery for this host, you will see your first monitors and events from Datadog in Checkmk.
Note: In practice, it has been found that it can be convenient to put monitors and events on separate hosts in Checkmk. This approach generally increases clarity and allows easier configuration of additional parameters for each host.
3. Mapping of the states
The states that are transferred with the monitors from Datadog cannot be transferred 1:1 to the states in Checkmk for every use case. To give you the possibility of setting these states according to your needs, you will find the rule Checking of Datadog monitors. You can find this rule by searching in the Setup menu, or by Setup > Services > Service monitoring rules > Applications, Processes & Services > Checking of Datadog monitors.
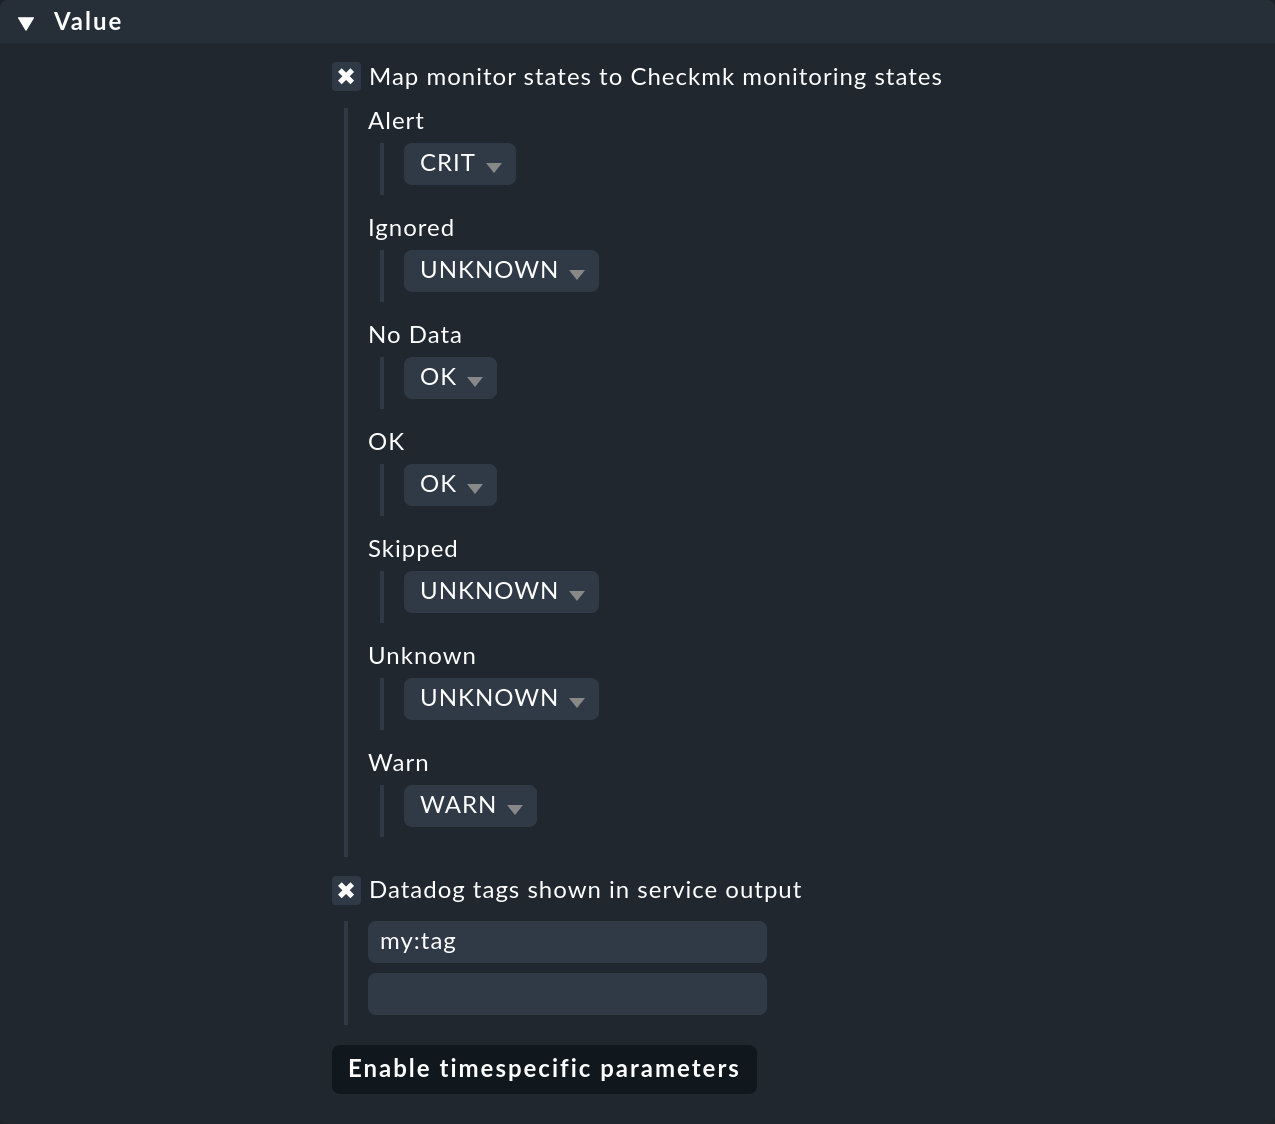
Furthermore, in this rule you can also specify which tags from Datadog should be displayed in the service output in Checkmk.