1. False alarms — fatal to any monitoring
Monitoring is only really useful if it is precise. The biggest obstacle to acceptance by colleagues (and probably by yourself) are false positives — or, in plain English, false alarms.
With some Checkmk beginners, we have seen how they have added many systems to the monitoring in a short space of time — perhaps because it is so easy to do so in Checkmk. When they then shortly afterwards activated the notifications for all users, their colleagues were flooded with hundreds of emails per day, and after only a few days their enthusiasm for monitoring was effectively destroyed.
Even if Checkmk makes a real effort to define appropriate and sound default values for all possible settings, it simply cannot know precisely enough how things should be in your IT environment under normal conditions. Therefore, a bit of manual work is required on your part to fine-tune the monitoring until even the last false alarm will not be sent. Apart from that, Checkmk will also find quite a few real problems that you and your colleagues have not yet suspected. These, too, must first be properly remedied — in reality, not in the monitoring!
The following principle has proven itself - first quality, then quantity — or in other words:
Do not include too many hosts in the monitoring all at once.
Make sure that all services that do not really have a problem are reliably on OK.
Activate the notifications by email or SMS only after Checkmk has been running reliably for a while with no or very few false alarms.
Note: False alarms can of course only occur when the notification function is switched on. So basically, what we need to do here is to turn off the preliminary stage of notifications and to avoid the critical states DOWN, WARN or CRIT for non-critical problems.
In the following chapters on configuration, we will show you what fine-tuning options you have — so that everything that does not cause problems will be green — and how to get any occasional drop-outs under control.
2. Rule-based configuration
Before we start configuring, we must first briefly look at the settings of hosts and services in Checkmk. Since Checkmk was developed for large and complex environments, this is done using rules. This concept is very powerful and brings many advantages to smaller environments as well.
The basic idea is that you don’t explicitly specify every single parameter for every service, but implement something like:
'On all production Oracle servers, file systems with the prefix /var/ora/ at 90 % filled will be WARN and at 95 % will be CRIT'.
Such a rule can set thresholds for thousands of file systems with a single action. At the same time, it also documents very clearly which monitoring policies apply in your company.
Based on a basic rule, you can then define exceptions for individual cases separately.
A suitable rule might look like this:
'On the Oracle server srvora123, the file system /var/ora/db01/ at 96 % filled will be WARN and at 98 % will be CRIT'.
This exception rule is set in Checkmk in the same way as the basic rule.
Each rule has the same structure. It always consists of a condition and a value. You can also add a description and a comment to document the purpose of the rule.
The rules are organized in rule sets. For each type of parameter, Checkmk has a suitable rule set ready, so you can choose from several hundred rule sets. For example, there is one called Filesystems (used space and growth) that sets the thresholds for all services that monitor file systems. To implement the above example, you would set the basic rule and the exception rule from this rule set. To determine which thresholds are valid for a particular file system, Checkmk goes in sequence through all the rules valid for the check. The first rule for which the condition applies sets the value — in this case, the percentage value at which the file system check becomes WARN or CRIT.
3. Finding rules
You have various options for accessing the rule sets in Checkmk.
On the one hand, you can find the rule sets in the Setup menu under the topics of the objects for which there are rule sets (Hosts, Services and Agents) in different categories. For example, there are the following rule set entries for services: Service monitoring rules, Discovery rules, Enforced services, HTTP, TCP, Email, … and Other Services. If you select one of these entries, the associated rule sets will be listed on the main page. This can be only a handful, or very, very many as with the Service monitoring rules. Therefore, you have the possibility to filter on the results page — in the Filter field of the menu bar.
If you are unsure in which category the rule set can be found, you can also search through all rules in one go, either by using the search field in the Setup menu or by opening the rule search page via Setup > General > Rule search. We will take the latter route in the following chapter, in which we will introduce the process of rule creation.
With the large number of rule sets available, it is not always easy to find the right one, with or without a search.
However, there is another way that you can access the appropriate rules for an existing service.
In a view that includes the service, click on the ![]() menu option and select the Parameters for this service entry:
menu option and select the Parameters for this service entry:
You will receive a page from which you can access all the rule sets for this service:
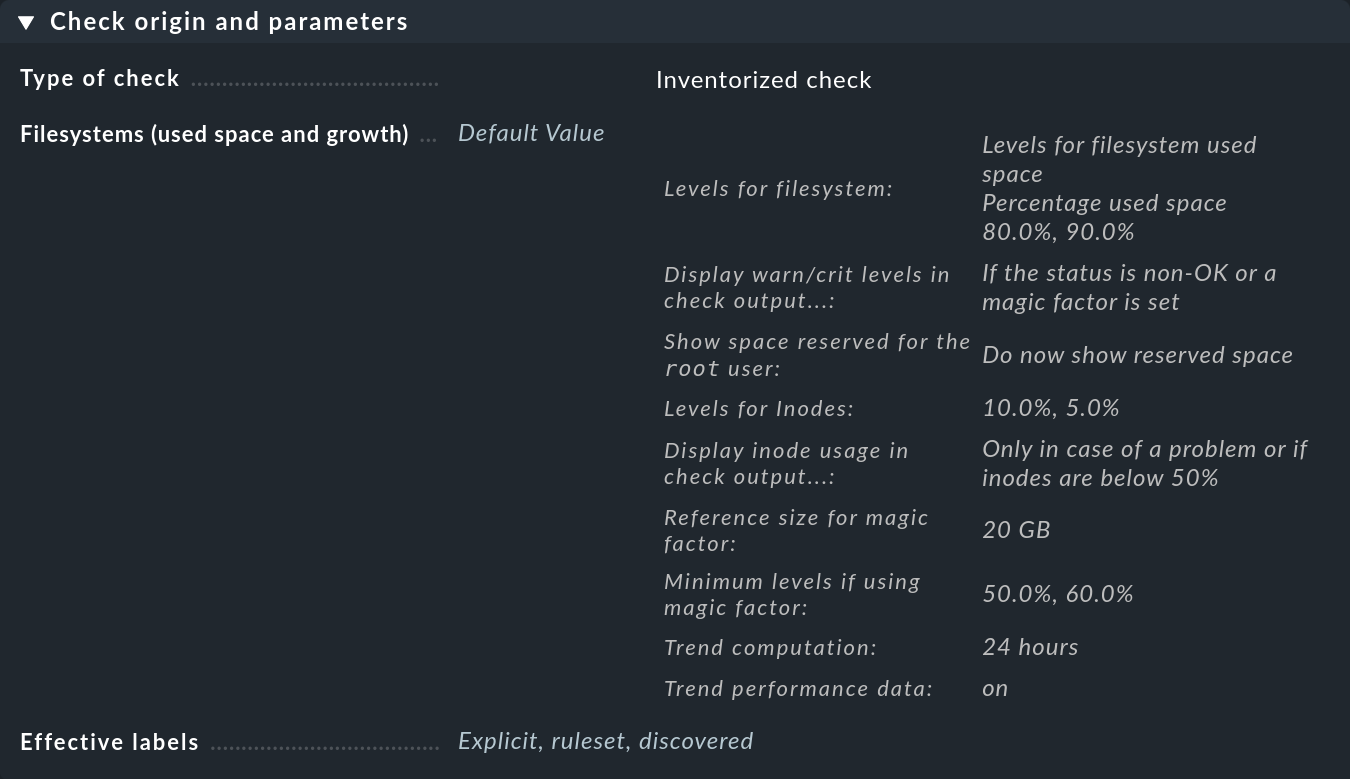
In the first box entitled Check origin and parameters, the Filesystems (used space and growth) entry takes you directly to the set of rules for the file system monitoring thresholds. However, you can see in the overview that Checkmk has already set default values, so you only need to create a rule if you want to modify those defaults.
4. Creating rules
What does a rule look like in practice? The best way to start is to formulate the rule you want to implement in a sentence, like this: 'On all production Oracle servers, tablespaces DW20 and DW30 at 90 % full will have a WARN status and at 95 % a CRIT' status.
You can then search for an appropriate rule set — in this example via the rule search: Setup > General > Rule search. This opens a page in which you can search for 'Oracle' or for 'tablespace' (case-insensitive) and find all of the rule sets that contain this text in their name or in their description (not shown here):
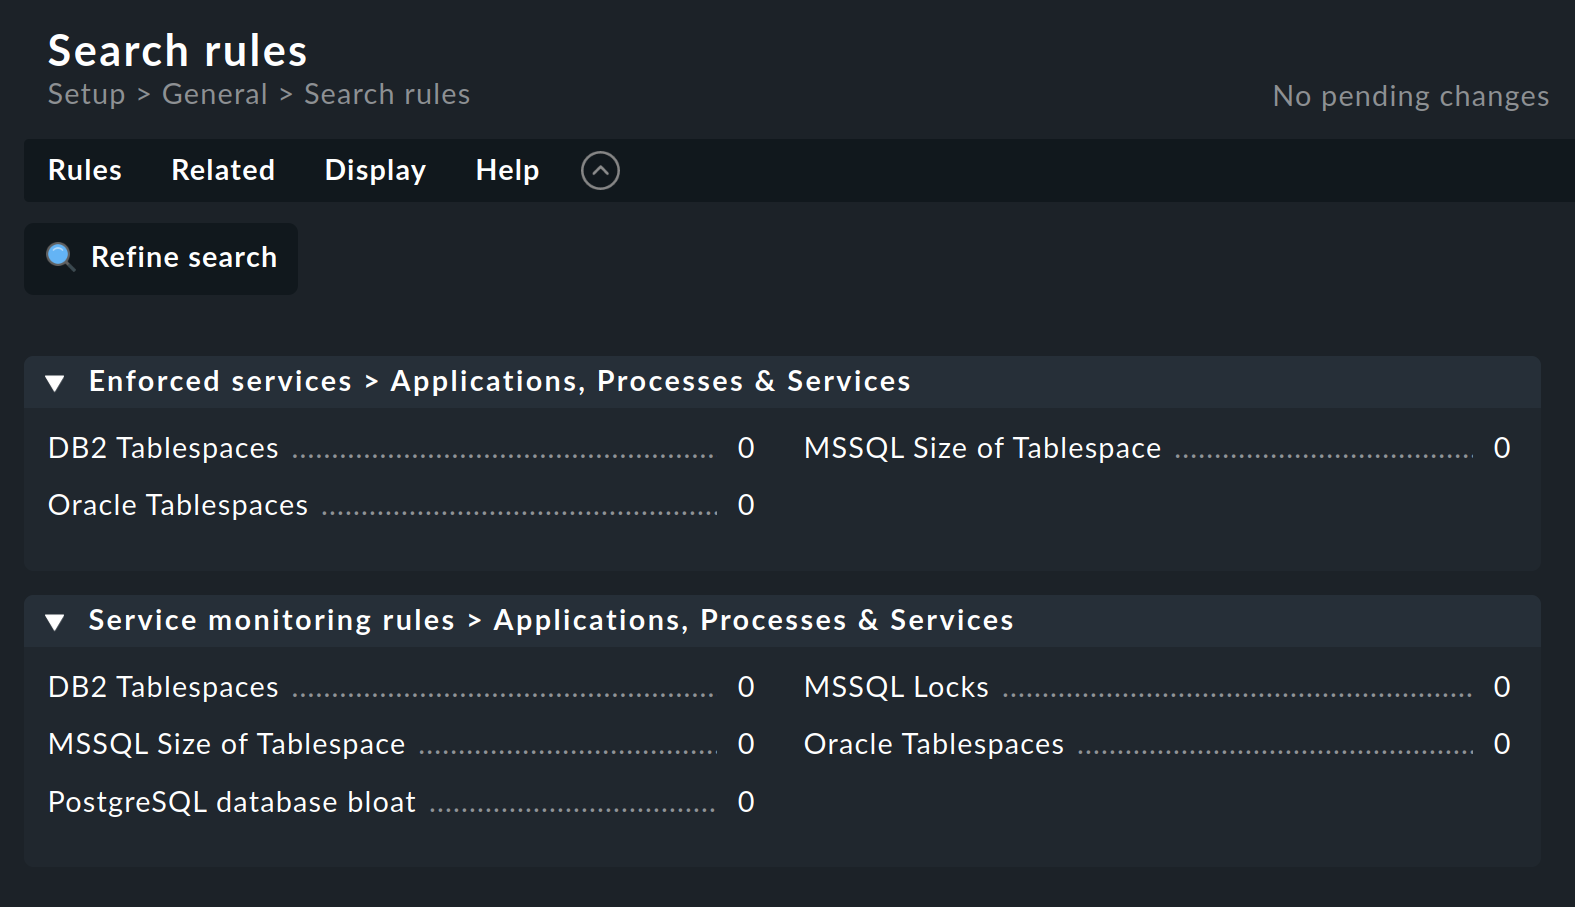
The Oracle Tablespaces rule set is found in two categories.
The number following the title (here everywhere 0) shows the number of rules that have already been created from this rule set.
In this example, we do not want the enforced service setup. Therefore, click on the name in the Service monitoring rules category to open the rule set overview page:
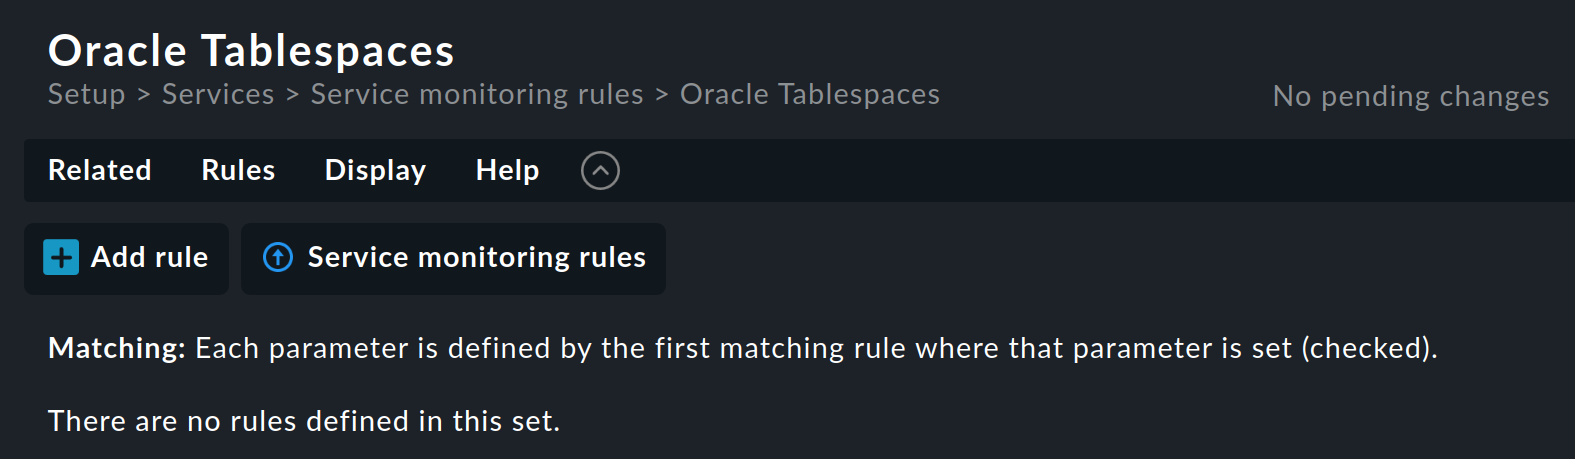
This rule set does not yet contain any rules. You can create the first rule with the Add rule button. Creating — and later editing — this rule opens a form with three boxes: Rule Properties, Value and Conditions. We will look at each of these three in turn.
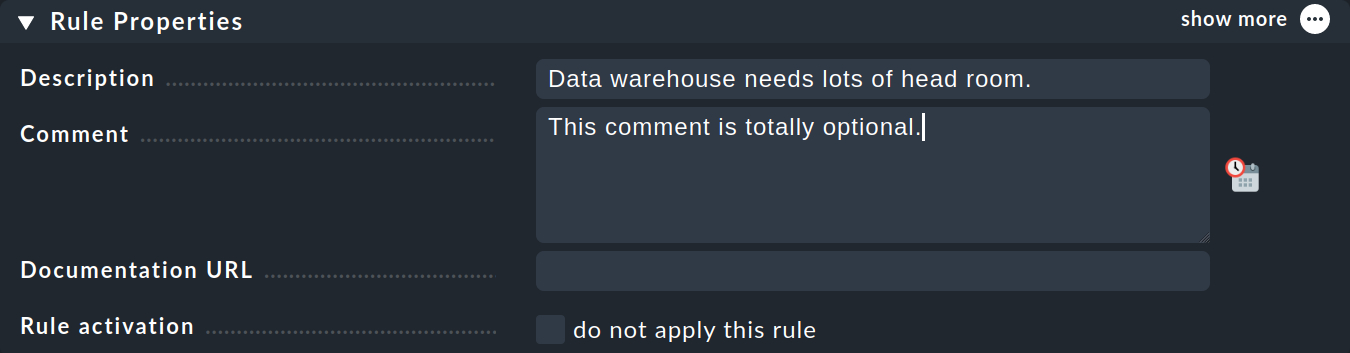
In the Rule Properties box, all entries are optional. In addition to the informative texts, here you also have the option of temporarily deactivating a rule. This is practical because you can sometimes avoid deleting and recreating a rule if you temporarily do not need it.
What you find in the Value box depends in each specific case on the content of what is being regulated:
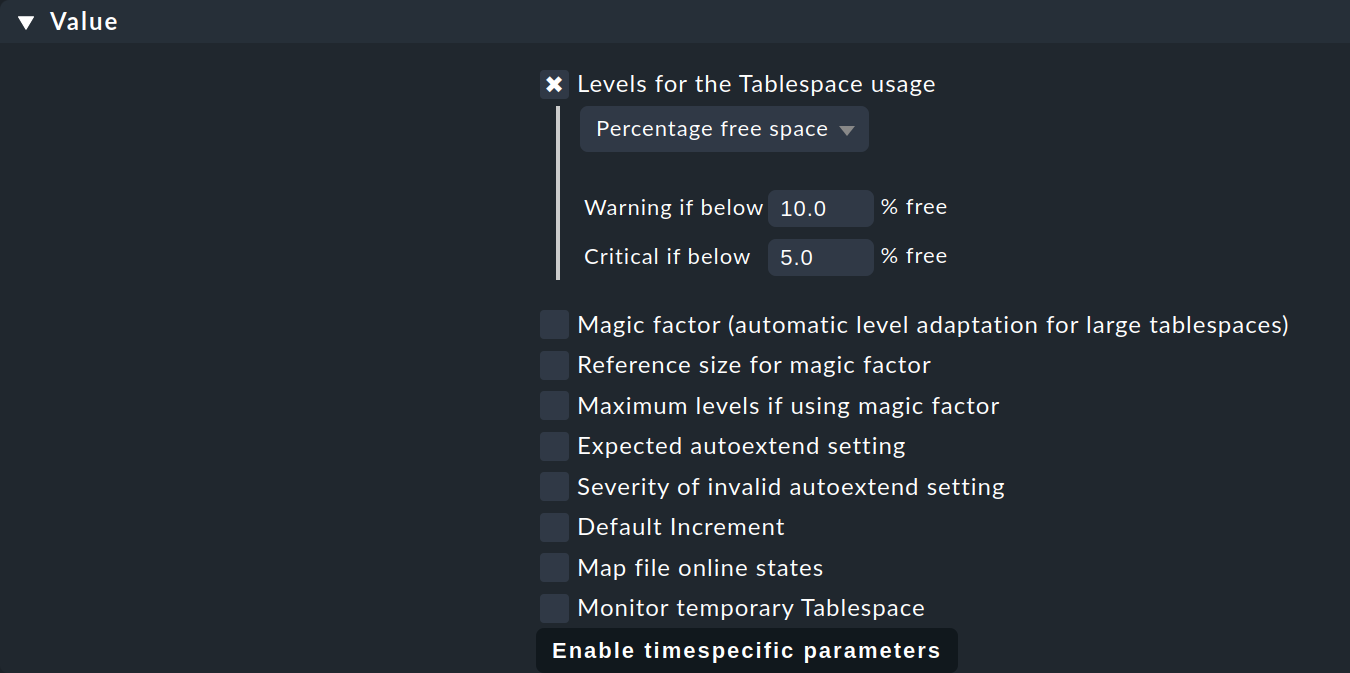
As you can see, this can be quite a number of parameters. The example shows a typical case — each individual parameter can be activated by a checkbox, and the rule will then only apply to this parameter. You can, for example, let another parameter be determined by a different rule if that simplifies your configuration. In this example, only the threshold values for the percentage of free space in the tablespace will be defined.
The Conditions box for setting the conditions looks a little more confusing at first glance:
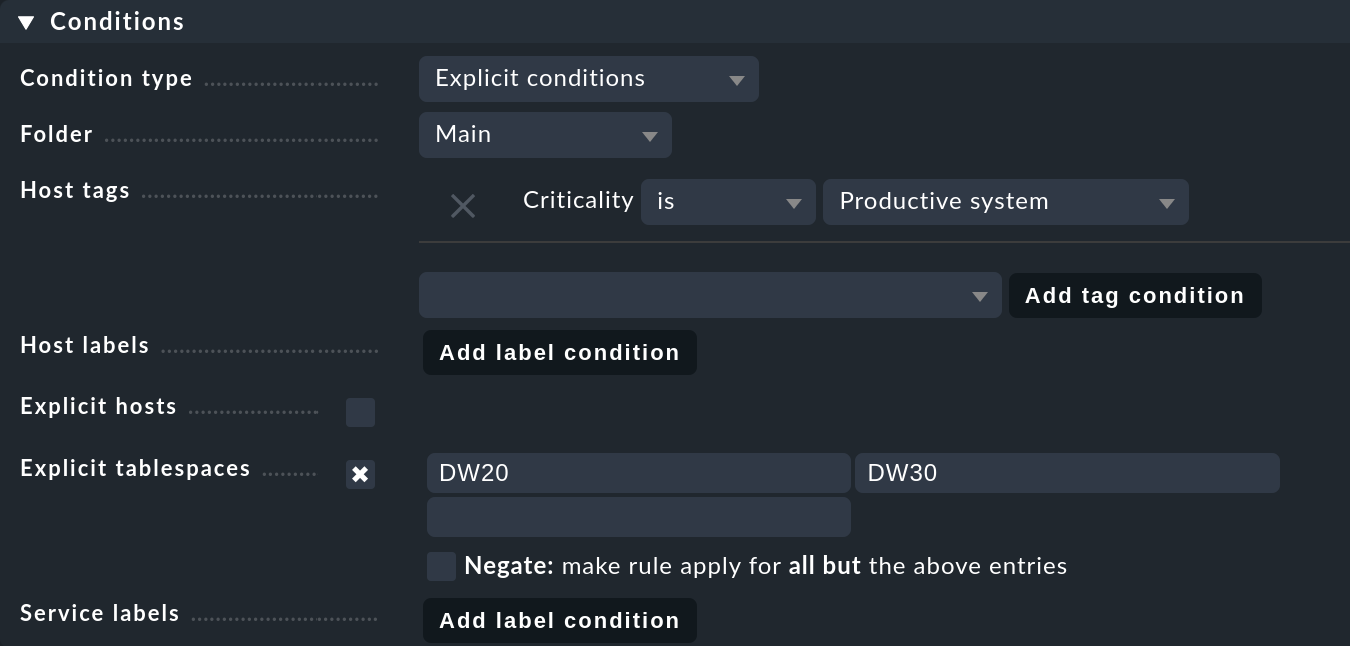
In this example we will only go into the parameters that we absolutely need for defining this specific rule:
With Folder you specify in which folder the rule should apply. For example, if you change the default Main to Windows, the new rule will apply only to hosts located directly in or below the Windows folder.
The Host tags are a very important feature in Checkmk, so we will be devoting a separate chapter to them right after this chapter. At this point, you use one of the predefined host tags to specify that the rule should only apply to production systems. First select the host tag group Criticality from the list, then click Add tag condition and select the value Productive system.
Very important in this example are the Explicit tablespaces, which restrict the rule to very specific services. Two points are important here:
The name of this condition adapts to the rule type. If it says Explicit Services, specify the names of the services concerned. For example, one such could be
Tablespace DW20— that is, including the wordTablespace. In the example shown, however, Checkmk only wants to know the name of the tablespace itself, thusDW20.The entered texts are always matched against the beginning. The input of
DW20therefore also accesses a fictitious tablespaceDW20A. If you want to prevent this, append the$character to the end, i.e.DW20$, because these are so-called regular expressions.
Note: A detailed description of all of the other parameters and a detailed explanation of the important concept of rules can be found in the article on rules. By the way, you can learn more about the Service labels, the last parameter in the image above, in the article on labels.
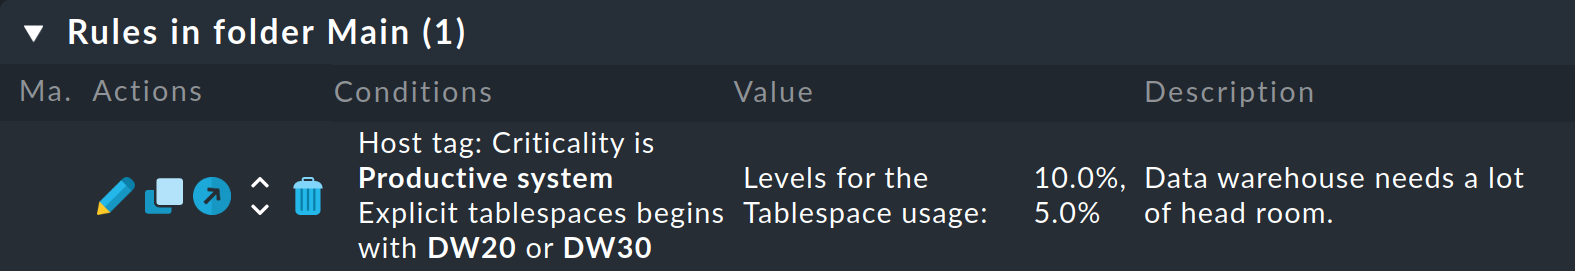
After all entries for the definition are complete, save the rule with Save. After saving, there will be exactly one new rule in the rule set:
Tip: If rather than with one rule, you later work with hundreds, there is a danger of losing an overall view. So in order to help you maintain an overview, Checkmk provides very helpful entries in the Related menu on every page that lists rules. With this you can display the rules used in the current site (Used rulesets) and, similarly, those that are not used at all (Ineffective rules).
5. Host tags
5.1. How host tags work
In the previous chapter we saw an example of a rule that should only apply to production systems. More specifically, in that rule we defined a condition using the Productive system host tag. Why did we define the condition as a tag and not simply set it for the folder? Well, you can only define a single folder structure, and each host can only be in one folder. But a host can have many different tags, and the folder structure is simply too limited and not flexible enough for that.
In contrast, you can assign host tags to the hosts as freely and arbitrarily as you like — regardless of the folder in which the hosts are located. You can then refer to these tags in your rules. This makes the configuration not only simpler, but also easier to understand and less error-prone than if you were to define everything explicitly for each host.
But how and where do you define which hosts should have which tag? And how can you define your own customized tags?
5.2. Defining host tags
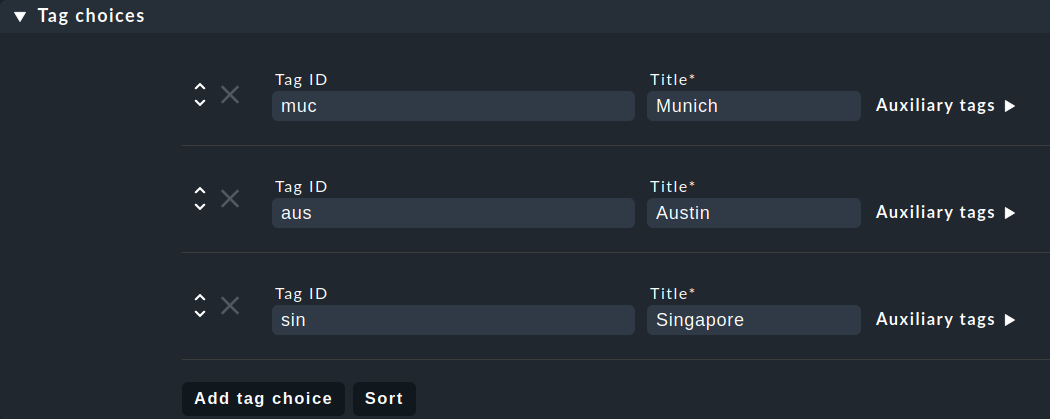
Let’s start with the answer to the second question about customized tags. First of all, you need to know that tags are organized in groups called host tag groups. Let’s take location as an example. A tag group could be named Location, and this group could contain the tags Munich, Austin, and Singapore. Basically, each host is assigned exactly one tag from each tag group. So as soon as you define your own tag group, each host will carry one of the tags from this group. Hosts for which you have not selected a tag from the group are simply assigned the first one by default.
For the definition of host tag groups, see Setup > Hosts > Tags:
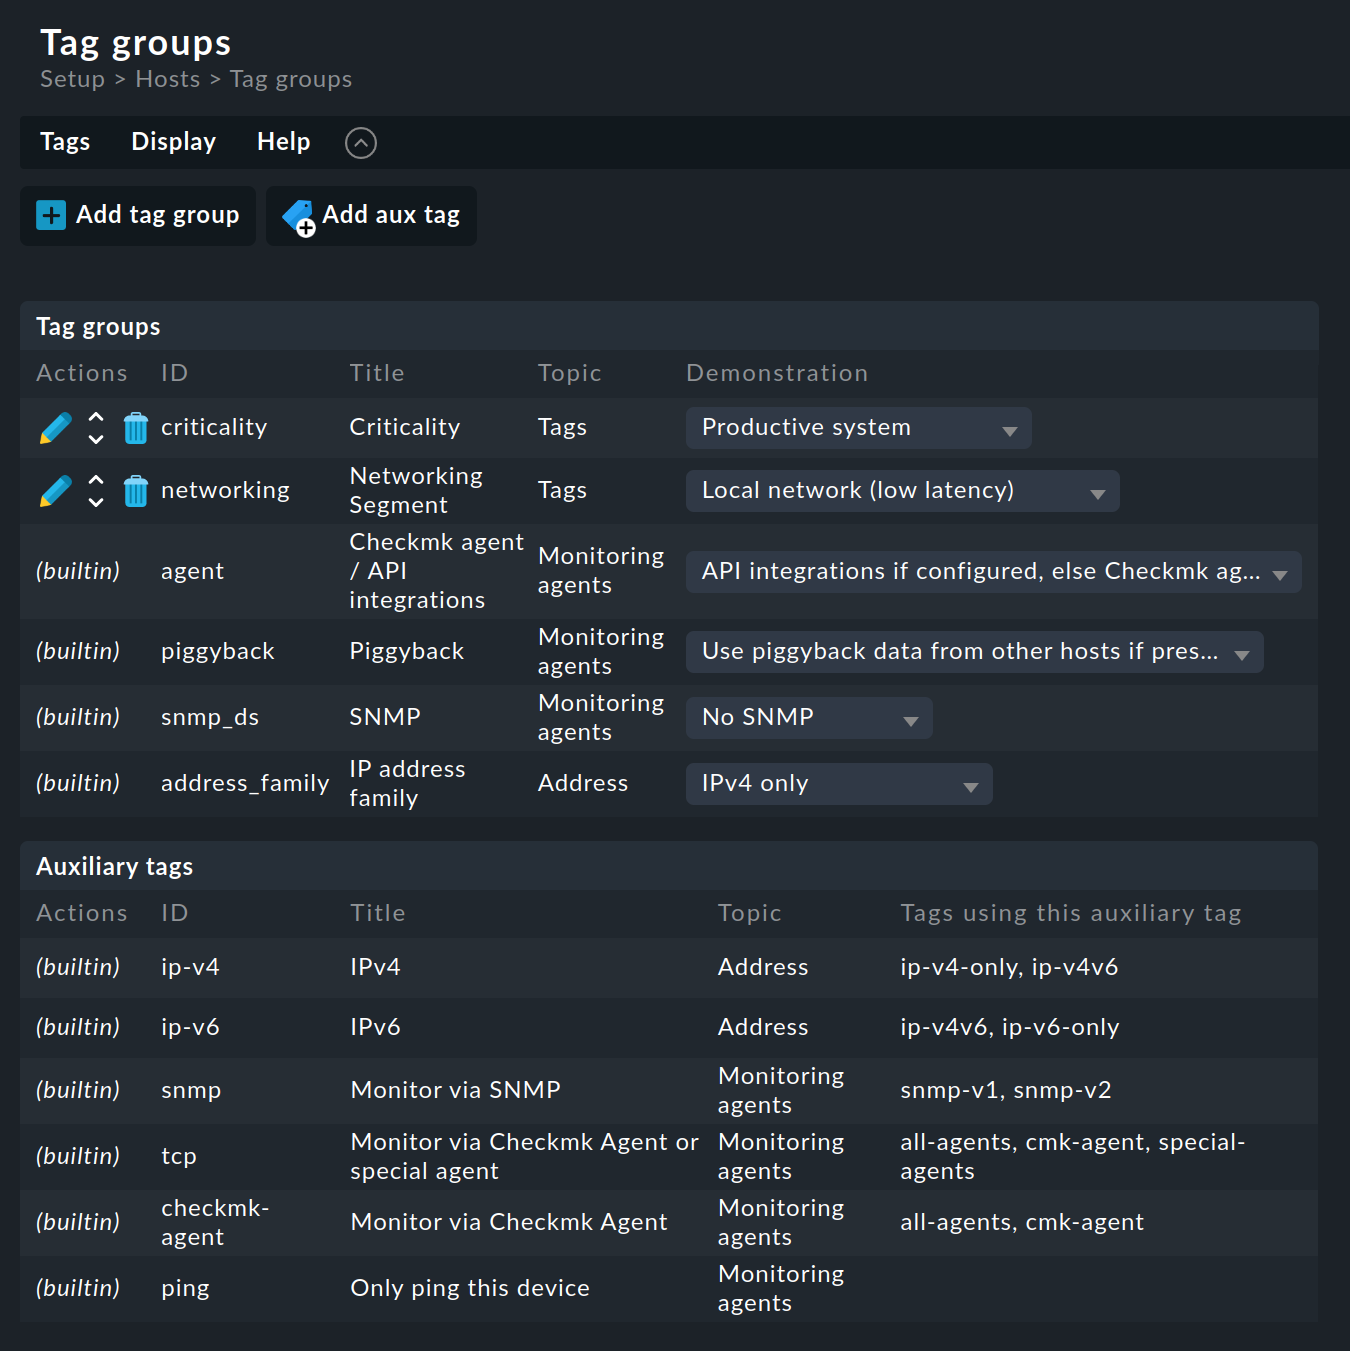
As can be seen, some tag groups have already been predefined. You cannot change most of these. We also recommend that you do not touch the two predefined example groups Criticality and Networking Segment. It is better to define your own groups:
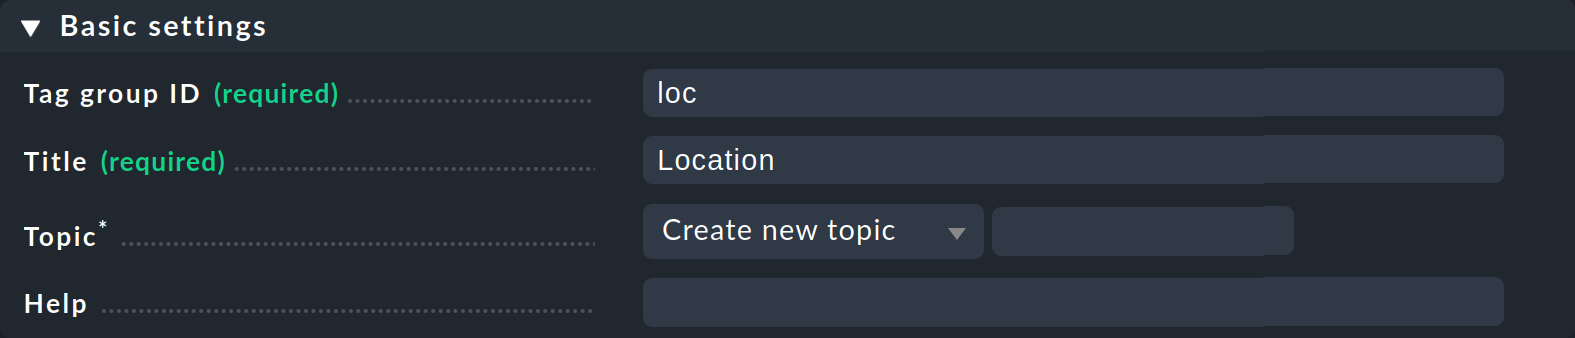
Click Add tag group. This opens the page for creating a new tag group. In the first box Basic settings you assign — as so often in Checkmk — an internal ID that serves as a key and which cannot be changed later. In addition to the ID, you define a descriptive title, which you can change at any later time. With Topic you can determine where the tag will be offered later in the host properties. If you create a new topic here, the tag will be displayed in a separate box in the host properties.
The second box Tag choices is about the actual tags, i.e. the selection options in the group. Click Add tag choice to create a tag and assign an internal ID and a title for each tag:
Notes:
Groups with only one selection are also allowed and can even be useful. The tag contained therein is known as a checkbox tag and it then appears in the host properties as just a checkbox. Each host will then have the tag — or not, because checkbox tags are disabled by default.
At this point, you can ignore the auxiliary tags for now. You can get all the information on auxiliary tags in particular and on host tags in general in the article on host tags.
Once you have saved this new host tags group with Save, you can start using it.
5.3. Assigning a tag to a host
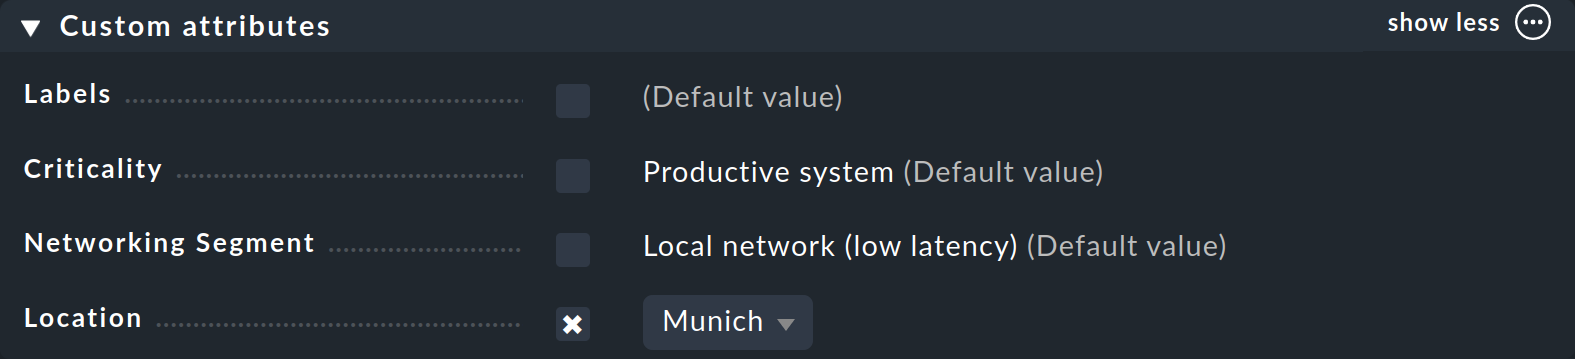
You have already seen how to assign tags to a host — in the host properties when creating or editing a host. In the Custom attributes box — or in a separate one if you have created a Topic — the new host tag group will appear and there you can make your selection and set the tag for the host:
Now that you have learned the important principles of configuration with rules and host tags, in the remaining chapters we would like to give you some practical guidelines on how to reduce false alarms in a new Checkmk system.
6. Customizing file system thresholds
Check the threshold values for monitoring file systems and adjust them if necessary. We have already briefly shown the default values above at the search for rules.
By default, Checkmk takes the thresholds 80 % for WARN and 90 % for CRIT for the fill level of file systems. Now 80 % for a 2 Tbyte hard disk is 400 Gbyte after all — perhaps a bit much buffer for a warning. So here are a few tips on the subject of file systems:
Create your own rules in the Filesystem (used space and growth) rule set.
The parameters allow thresholds that depend on the size of the file system. To do this, select Levels for filesystem > Levels for filesystem used space > Dynamic levels. With the Add new element button you can now define your own threshold values per disk size.
It is even easier with the Magic factor, which we will introduce in the final chapter.
7. Sending hosts into downtime
Some servers are restarted on a regular basis — either to apply patches or simply because they are supposed to be. You can avoid false alarms at these times in two ways:
![]() In the Raw Edition you first define a time period that covers the times of the reboot.
You can find out how to do this in the article on time periods.
Then create a rule in each of the rule sets Notification period for hosts and Notification period for services for the affected hosts and select the
previously-defined time period there.
The second rule for the services is necessary so that any services that go to CRIT during this time do not trigger a notification.
If problems occur within this time frame — and are also resolved within the same time frame — no notification will be triggered.
In the Raw Edition you first define a time period that covers the times of the reboot.
You can find out how to do this in the article on time periods.
Then create a rule in each of the rule sets Notification period for hosts and Notification period for services for the affected hosts and select the
previously-defined time period there.
The second rule for the services is necessary so that any services that go to CRIT during this time do not trigger a notification.
If problems occur within this time frame — and are also resolved within the same time frame — no notification will be triggered.
![]() In the Enterprise Editions there are regular scheduled downtimes for this purpose that you can set for any affected hosts.
In the Enterprise Editions there are regular scheduled downtimes for this purpose that you can set for any affected hosts.
Tip: An alternative to creating downtimes for hosts, which we have already described in the chapter on scheduled downtimes, is the Recurring downtimes for hosts rule set in the Enterprise Editions. This has the great advantage that hosts that are added to the monitoring later automatically receive these scheduled downtimes.
8. Ignoring switched-off hosts
It is not always a problem when a computer is switched off. Printers are a classic example. Monitoring these with Checkmk makes perfect sense — some users even organize the reordering of toner using Checkmk. As a rule, however, switching off a printer before closing time is not a problem. It is simply senseless, however, when at this point Checkmk notifies due to the printer’s corresponding host going DOWN.
You can tell Checkmk that it is perfectly OK for a host to be powered off. To do this, find the Host check command rule set, create a new rule, and set its value to Always assume host to be up:

In the Conditions box, make sure that this rule is really only applied to the appropriate hosts — depending on the structure you have chosen. For instance, you can define a host tag and use it here, or you can set the rule for a folder in which all the printers are located.
Now, all printers will always be displayed as UP — no matter what their actual status is.
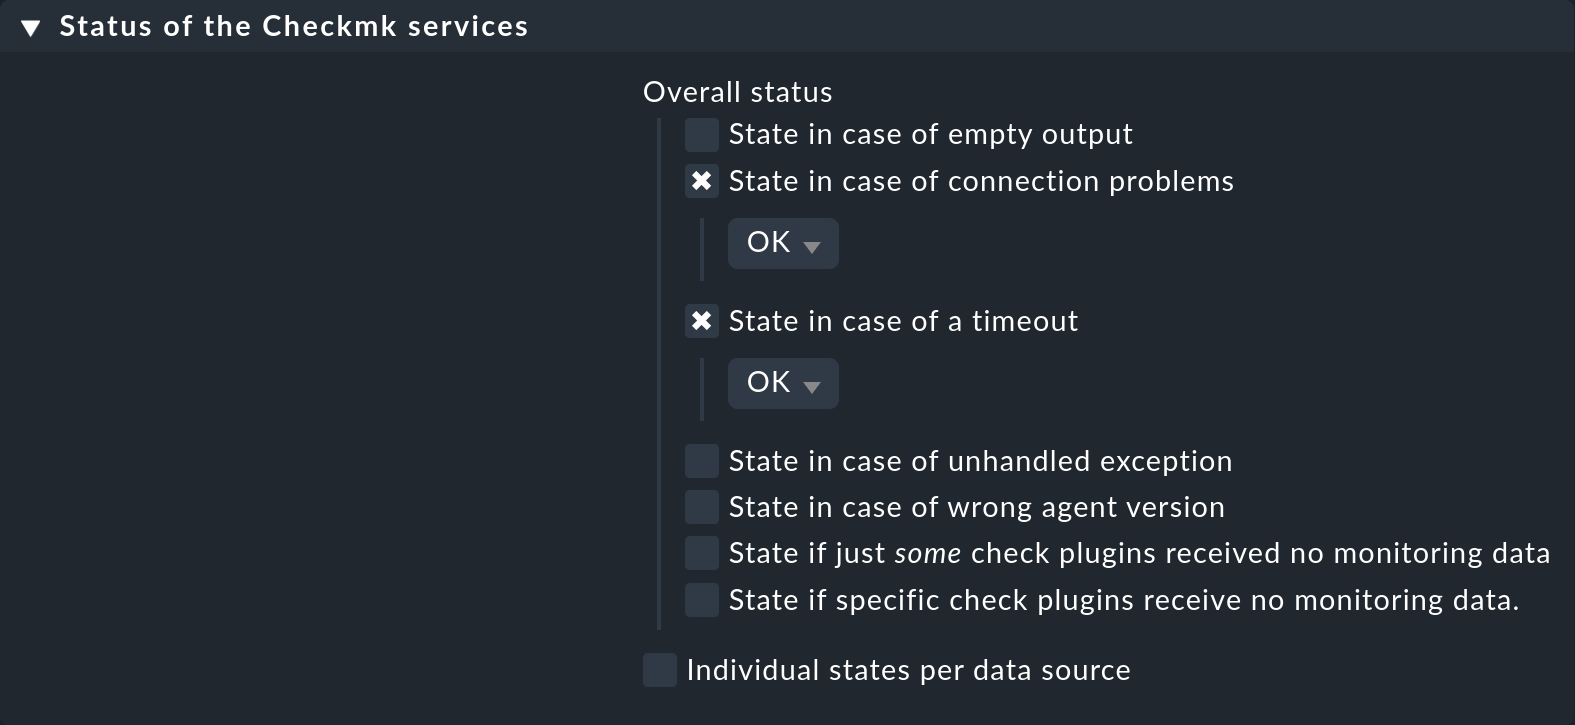
However, the services of the printer will continue to be checked, and any timeout would result in a CRIT state. To avoid this as well, configure a rule for the affected hosts in the Status of the Checkmk services rule set, in which you set timeouts and connection problems to OK respectively:
9. Configuring switch ports
If you monitor a switch with Checkmk, you will notice that during the service configuration, a service is automatically created for each port that is up at the time. This is a sensible default setting for core and distribution switches — i.e. those to which only infrastructure devices or servers are connected. However, for switches to which end devices such as workstations or printers are connected, this leads on the one hand to continuous notifications if a port goes down, and on the other hand to new services being continuously found because a previously unmonitored port goes up.
Two approaches have proven successful for such situations. Firstly, you can restrict the monitoring to the uplink ports. To do this, create a rule for the disabled services that excludes the other ports from monitoring.
However, the second method is much more interesting. With this method you monitor all ports, but allow down to be a valid state. The advantage is that you will have transmission-error monitoring even for ports to which end devices are connected and can thus very quickly detect bad patch cables or errors in auto-negotiation. To implement this function, you need two rules:
The first rule set Network interface and switch port discovery defines the conditions under which switch ports are to be monitored. Create a rule for the desired switches and select whether individual interfaces (Configure discovery of single interfaces), or groups (Configure grouping of interfaces) are to be discovered. Then, under Conditions for this rule to apply > Match port states, activate 2 - down in addition to 1 - up:
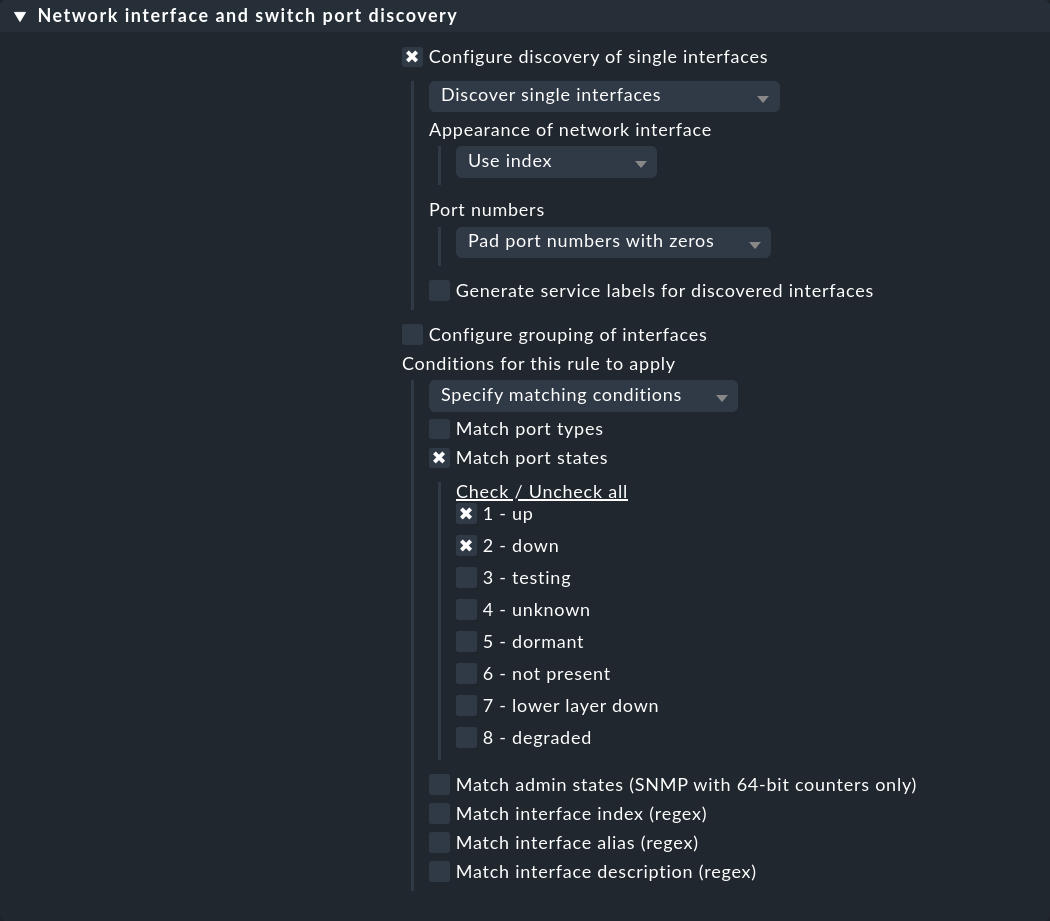
In the service configuration of the switches, the ports with the down state will now also be presented, and you can add these to the list of monitored services.
Before you activate the change, you will still need the second rule that ensures that this state is evaluated as OK. This rule set is called Network interfaces and switch ports. Create a new rule and activate the Operational state option, deactivate Ignore the operational state below it and then activate the 1 - up and 2 - down states for the Allowed operational states (and any other states as may be required).
10. Disabling services permanently
For some services that simply cannot be reliably set to OK, it is better not to monitor them at all. In this case, you could simply manually remove the services from the monitoring for the affected hosts in the service configuration (on the Services of host page) by setting them to Disabled or Undecided. However, this method is cumbersome and error-prone.
It is much better to define rules according to which specific services will systematically not be monitored.
For this purpose there is the Disabled services rule set.
Here you can, for example, create a rule and specify in the condition that file systems with the /var/test/ mount point are by definition not to be monitored.
Tip: If you disable an individual service in the service configuration of a host by clicking on ![]() , a rule is automatically created for the host in this very rule set.
You can edit this rule manually and, for example, remove the explicit host name.
The affected service will then be disabled on all hosts.
, a rule is automatically created for the host in this very rule set.
You can edit this rule manually and, for example, remove the explicit host name.
The affected service will then be disabled on all hosts.
You can read more information about this in the article on configuring services.
11. Catching outliers using mean values
Sporadic notifications are often generated by threshold values on utilization metrics — such as CPU utilization — which are only exceeded for a short time. As a rule, such brief peaks are not a problem and should not be faulted by the monitoring.
For this reason, quite a number of check plug-ins have the option in their configuration that their metrics are averaged over a longer period of time before the thresholds are applied. An example of this is the rule set for CPU utilization for non-Unix systems called CPU utilization for simple devices. For this there is the Averaging for total CPU utilization parameter:
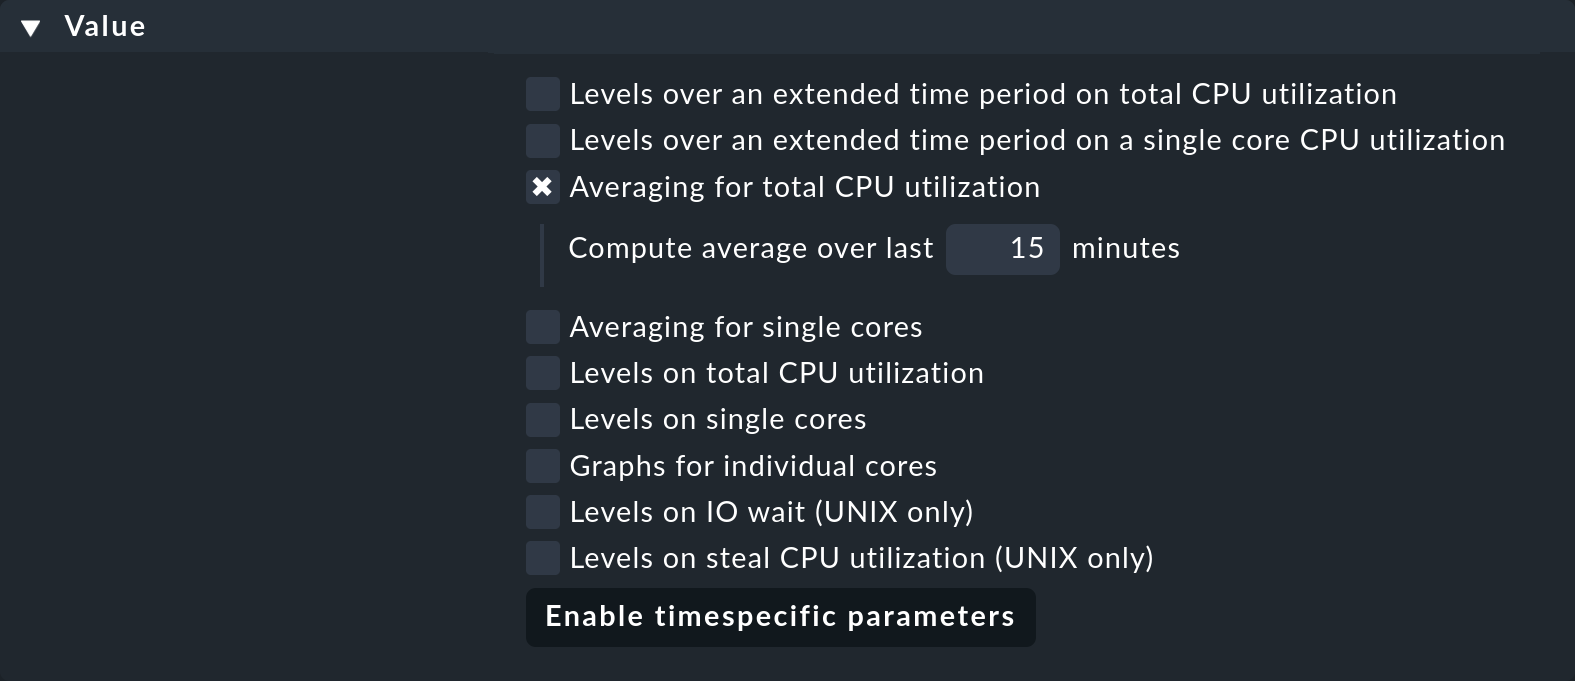
If you activate this and enter 15, the CPU load will first be averaged over a period of 15 minutes and only afterwards will the threshold values be applied to this average value.
12. Managing sporadic errors
When nothing else helps and services continue going occasionally to WARN or CRIT for a single check interval — i.e. for one minute — there is one last method for preventing false alarms — the Maximum number of check attempts for service rule set.
If you create a rule in that rule set and set its value to, say, 3, a service that goes from OK to WARN, for example, will not yet trigger a notification and will not yet be displayed as a problem in the Overview.
The intermediate state in which the service will now be in is called the soft state.
Only when the state remains not OK for three consecutive checks — which is a total duration of just over two minutes — will a persistent problem be reported.
Only a hard state will trigger a notification.
This is admittedly not an attractive solution. You should always try to get to the root of any problem, but sometimes things are just the way they are, and with the number of check attempts you at least have a viable way around such situations.
13. Keeping the list of services up-to-date
In any data center, work is constantly being carried out, and so the list of services to be monitored will never remain static. To make sure you don’t miss anything, Checkmk automatically sets up a special service for you on each host — this service is known as the Check_MK Discovery:
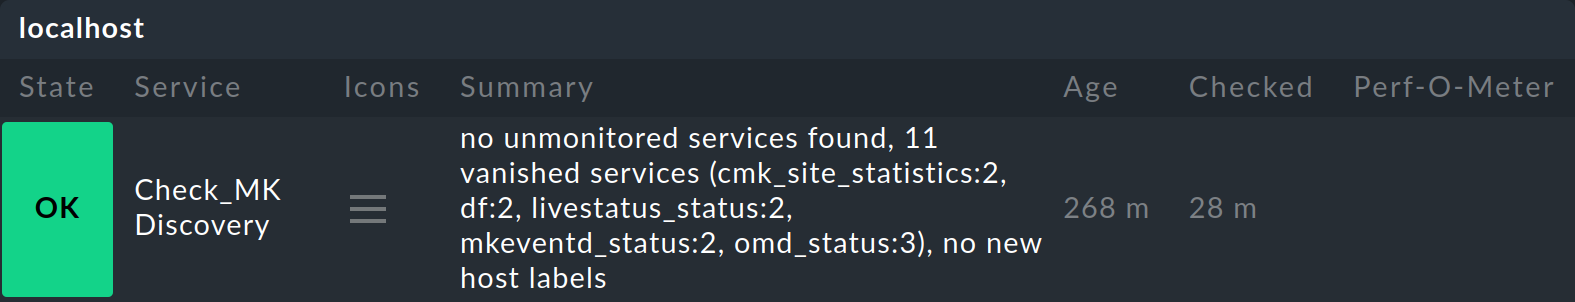
By default, every two hours this service checks whether new — not yet monitored — services have been found or existing services have been dropped. If this is the case, the service go to WARN. You can then call up the service configuration (on the Services of host page) and bring the services list back up to the current status.
Detailed information on this discovery check can be found in the article on configuring services. There you can also learn how you can have unmonitored services added automatically, which makes the work in a large configuration much easier.
Tip: With Monitor > System > Unmonitored services you can call up a view that shows you any new or dropped services.