1. Essential monitoring tasks
So you have added hosts and looked at some important tools — and now we are ready to start with the actual monitoring. After all, the whole point of Checkmk is not to be permanently occupied with the configuration, but to provide support for IT operations.
It is true that the views available by default, such as the Overview snapin, already show you very precisely how many and what problems currently exist. But to model a workflow, i.e. 'systematic work procedures' with the monitoring, you need a bit more information on:
the acknowledgement of problems
the sending of notifications in the event of problems
the setting of scheduled downtimes
This chapter only deals with the first and the last of the above points. The notifications will be covered later in a separate chapter, as there are some special preparations that need to be made for this particular subject.
2. Acknowledging problems
In the Overview we have already seen that problems can be flagged as either unhandled or handled. Acknowledging is the very action that turns an unhandled problem into a handled one. This doesn’t necessarily mean that someone is actually working on the problem. Some problems disappear on their own. But acknowledging helps to maintain an overview and to establish a workflow.
What exactly happens when a problem is acknowledged?
In the Overview the problem will no longer be counted in the Unhandled column at the host or service.
The dashboards also no longer lists the problem.
The object (host or service) is marked in views with the
 symbol.
An entry is made in the object history so that the action can be later retraced.
Repeating notifications, if configured, will be stopped.
So how do you acknowledge a problem?
First call up a view that contains the problem. The easiest way is to use the predefined views in the Monitor > Problems > Host problems or Service problems menus. By the way, you can almost get to these more quickly by clicking on the problem count in the Overview.
You can click on the problematic host or service in the list and then, on the page with its details, perform the acknowledgement only for this individual host or service. However, we will stay on the list page because you have all the options here to acknowledge only one problem or several problems at once.
It is not at all uncommon that you would like to acknowledge a number of (related) problems in a single action. This is easily done by clicking Show checkboxes to display a new first column in the list, which contains a checkbox in front of each row. The checkboxes are all unchecked as the selection is yours — select the checkbox for each host or service you want to act on.
Important: If you perform an action on a page with a list without checkboxes, then this action will be performed for all the listed entries.
Now click on Acknowledge problems, which will display the following panel at the top of the page:
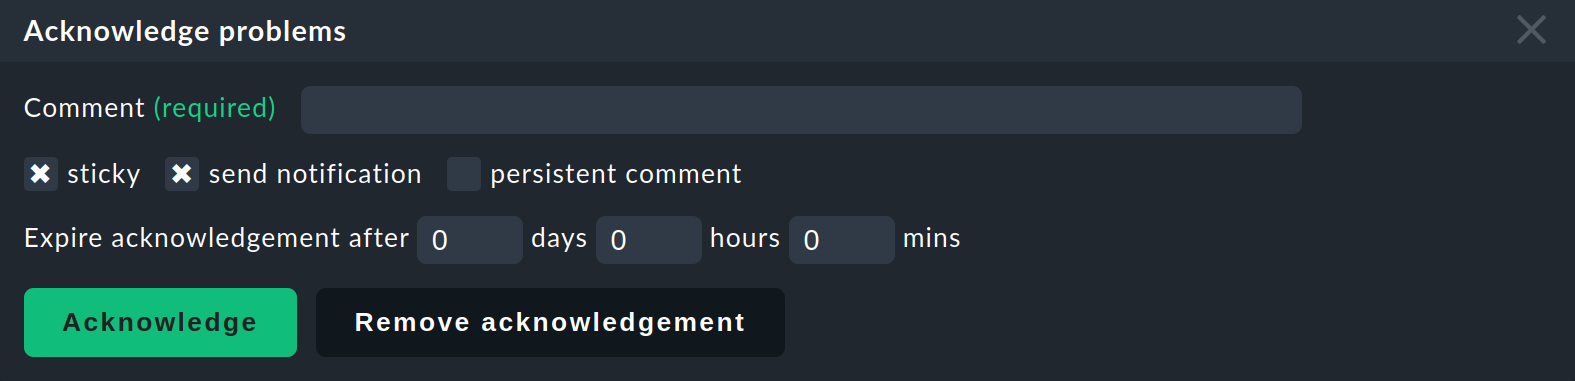
Enter a comment and click Acknowledge — and with the confirmation of the 'Are you sure?' question …

… all the selected problems will be flagged as having been acknowledged.
Finally, a couple of tips:
You can also remove an acknowledgement with the Remove acknowledgement button.
Acknowledgements can run automatically. The Expire acknowledgement after option serves this purpose, but it is only effective in the
 Checkmk Enterprise Editions.
For more information on all options for acknowledgement actions, see the article on acknowledgement.
3. Setting up scheduled downtimes
Sometimes things don’t 'break' by accident, but rather on purpose — or to put it a little more carefully, a necessary outage can be tolerated. After all, every piece of hardware or software needs occasional maintenance, and during such work the respective host or service in the monitoring is very likely to go into the DOWN or CRIT state.
For those who are supposed to react to problems in Checkmk, it is of course very important that they know about planned downtimes and do not lose valuable time with "false alarms". To ensure this, Checkmk knows the concept of scheduled downtime (or shorter downtime).
So when an object is due for maintenance, you can set it to the scheduled downtime — either immediately or for a planned time in the future.
Setting up scheduled downtimes is very similar to the process of acknowledging problems. You start again with a view containing the desired object (host or service) for which you want to set up a scheduled downtime. For instance, you can click on the total of hosts or services in the Overview to get a list of all objects.
In the list that is displayed, use Show checkboxes to show the checkboxes and then select all the appropriate entries.
Now click Schedule downtimes. This will display the following panel at the top of the page:
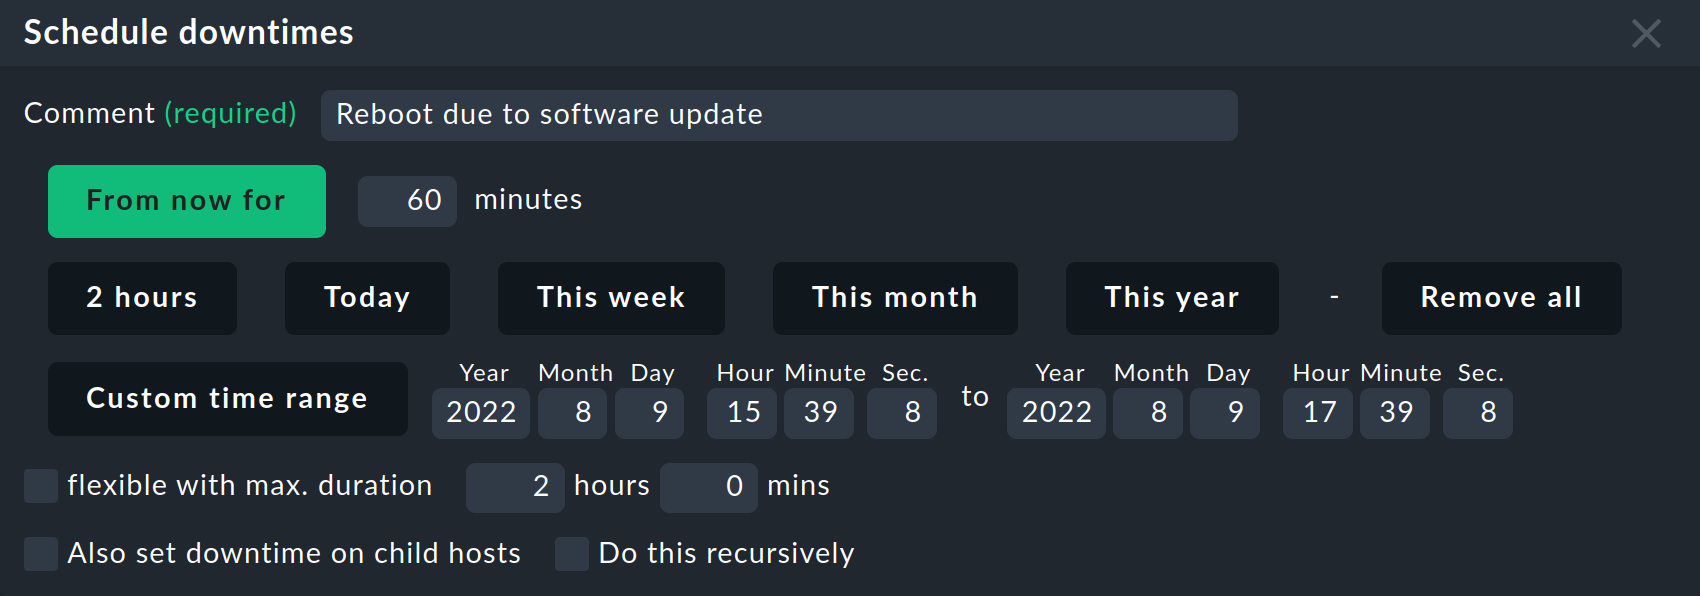
There is a whole range of options for the scheduled downtimes. You must enter a comment in each case. By clicking the buttons, you can select the beginning and end of the downtime. For example, the 2 hours button declares the selected objects as 'in maintenance' for two hours from the current time. In contrast to the acknowledgements, scheduled downtimes will always have an end time that is set beforehand.
Here are a couple of more tips:
When you schedule a host for a downtime, all of its services are automatically scheduled as well, thus saving yourself the work of having to do this twice.
The flexible scheduled downtimes actually only commence when the object changes to a state other than OK.
If you use the
Checkmk Enterprise Editions, you can also define regular scheduled downtimes — for instance, for a mandatory reboot once a week.You can get an overview of any currently ongoing scheduled downtimes in Monitor > Overview > Scheduled downtimes.
The effects of a scheduled downtime are as follows:
In the Overview the affected hosts and services no longer appear as having problems.
In views, a service is marked with the
 guiding cone.
A host, including the services sent to downtime with it, is marked with the
guiding cone.
A host, including the services sent to downtime with it, is marked with the  blue pause icon.
For these objects the notification of problems is switched off during scheduled downtime.
A special notification is triggered at the beginning and at the end of a downtime period.
In the availability analysis planned scheduled downtimes are accounted for separately.
For a detailed description of all the above-mentioned and other aspects, see the article on scheduled downtimes