1. Introduction
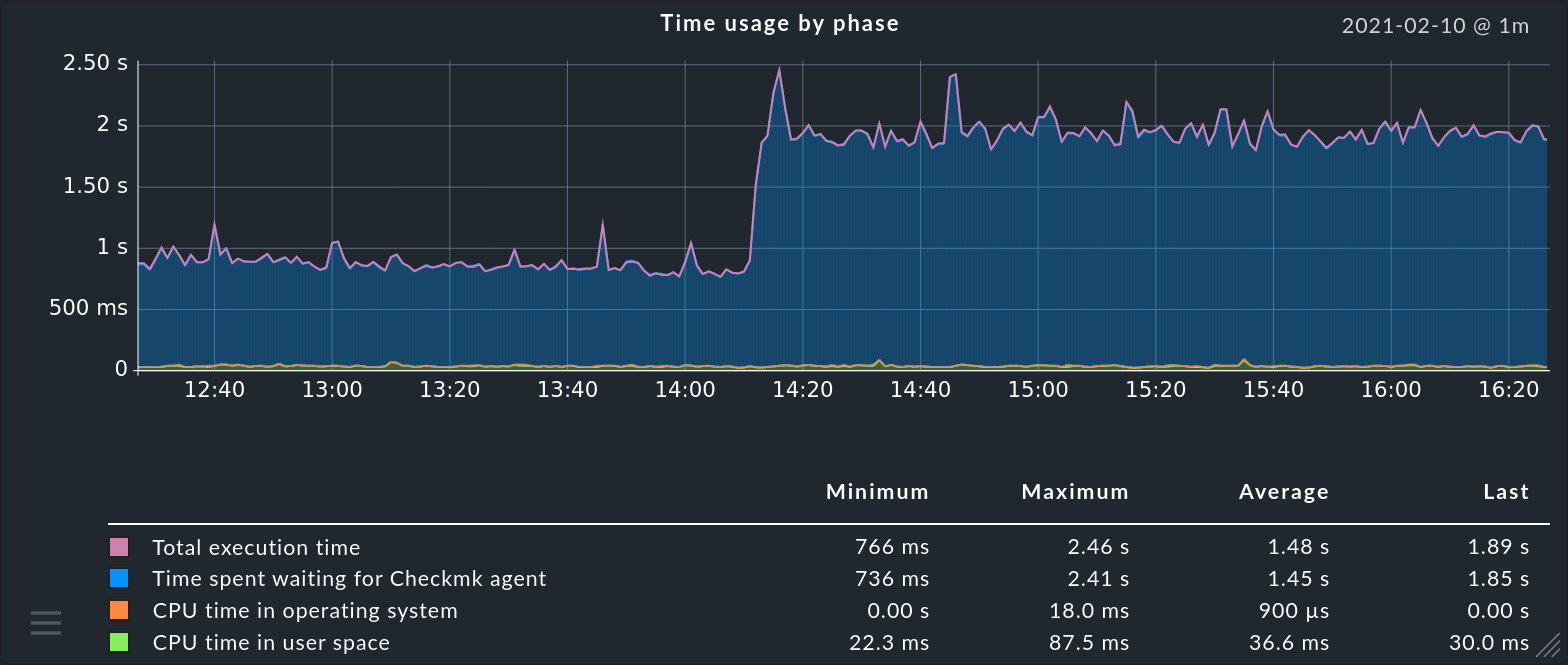
Alongside the actual system monitoring — namely, the detection of problems — Checkmk is an excellent tool for the recording and analysis of the diverse performance data which can be generated in IT environments. These can include, for example:
Operating system performance (disk IO, CPU and storage utilisation, …)
Network statistics (utilised bandwidth, packet transfer times, error rates, …)
Environment sensors (temperature, humidity, air pressure, …)
Usage statistics (logged-in users, page requests, sessions, …)
Quality indicators from applications (e.g., website response times)
Electricity consumption and quality in a data centre (currents, voltages, performances, battery capacities, …)
Application-specific data (e.g., length of email queues from MS Exchange)
and much more …
Checkmk records all measurements generated by the monitoring over a period (customisable) of four years, so that it can not only access the current data, but also historic data. In order to keep disk space usage under control, older data is compressed. The actual performance data itself is detected by the individual check plug-ins. These plug-ins also determine exactly which values are provided.
The interface for visualising the historical measured data is based on HTML5 and is identical in the Enterprise Editions and in the Raw Edition.
Only in the Enterprise Editions can you use extended functions such as PDF export, graph collections, custom graphs and connection to external metrics databases.
2. Access via the GUI
A service’s performance data is presented in three different forms in the GUI. The so-called Perf-O-Meter appears directly in a host’s or service’s tables and provides a quick overview and a visual comparison. These are however usually limited by space to a selected single metric. For file systems, for example, this is the percentage of space used:

You can view all of a service’s metrics in a time range — either by
moving the cursor over the ![]() graph icon, or by clicking on it.
The same graphs can also be very easily found in a host’s or service’s details:
graph icon, or by clicking on it.
The same graphs can also be very easily found in a host’s or service’s details:
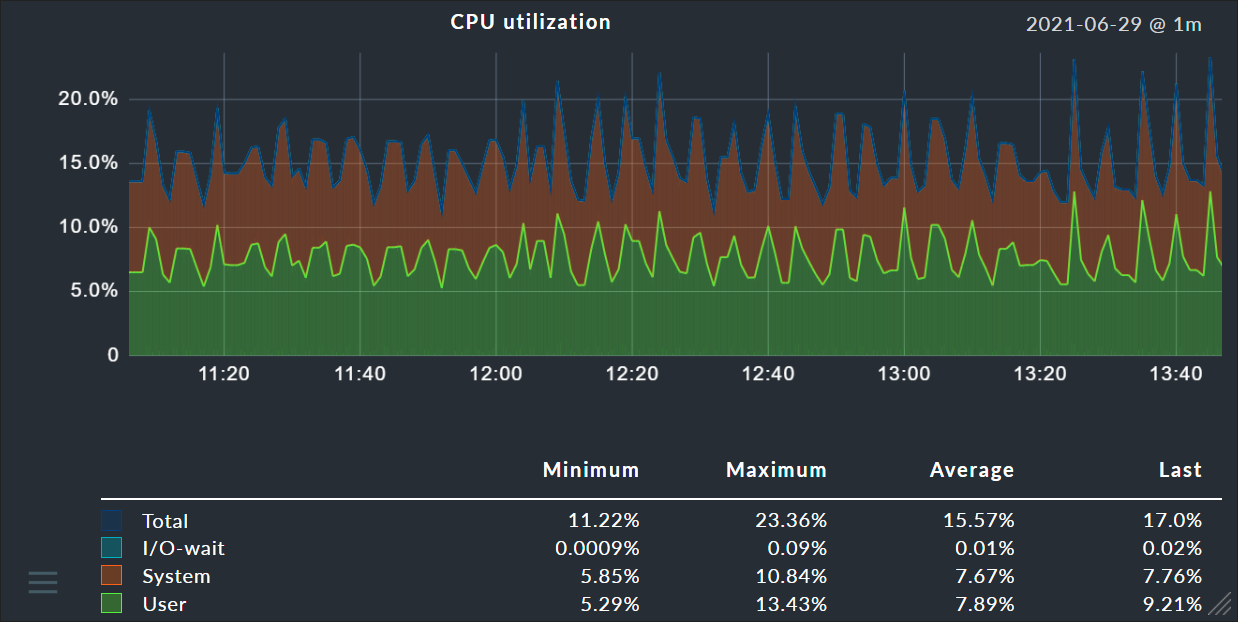
A table with the precise current performance data for all metrics can also be found in a details page:

3. Interaction with the graphs
You can interactively influence the displaying of graphs in various ways:
By panning (or dragging) with the mouse button held down, you move the time range (left/right) or scale vertically (up/down).
Using the mouse-wheel to zoom in or out of the time range
By dragging the graph’s lower right corner to change its size
Clicking on a position in a graph sets a pin. In this way you can identify a point’s exact time and all of the precise performance data for this moment. The pin’s exact time is saved for each user, and displayed in all graphs:
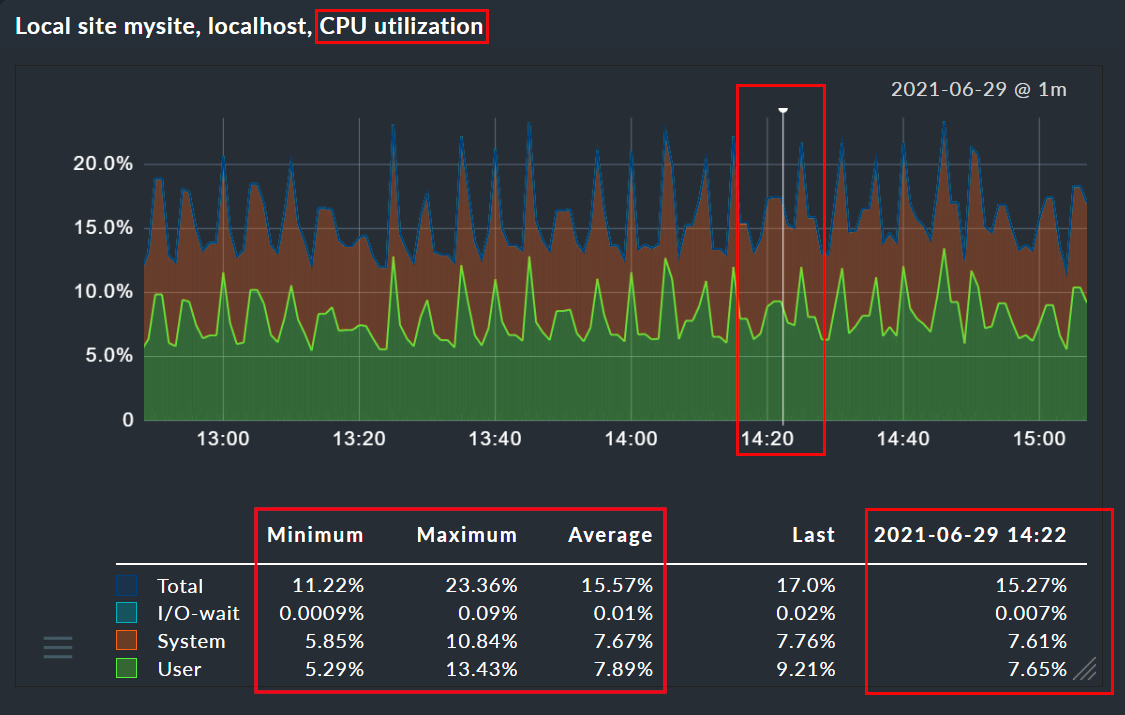
If a page includes several graphs, all of the graphs conform to changes made to the time range and the pin — thus the values can always be compared across graphs. Likewise, scaling is effected on all of the graphs. These readjustments will however first appear with a page refresh (otherwise there could be chaos on the display at times…)
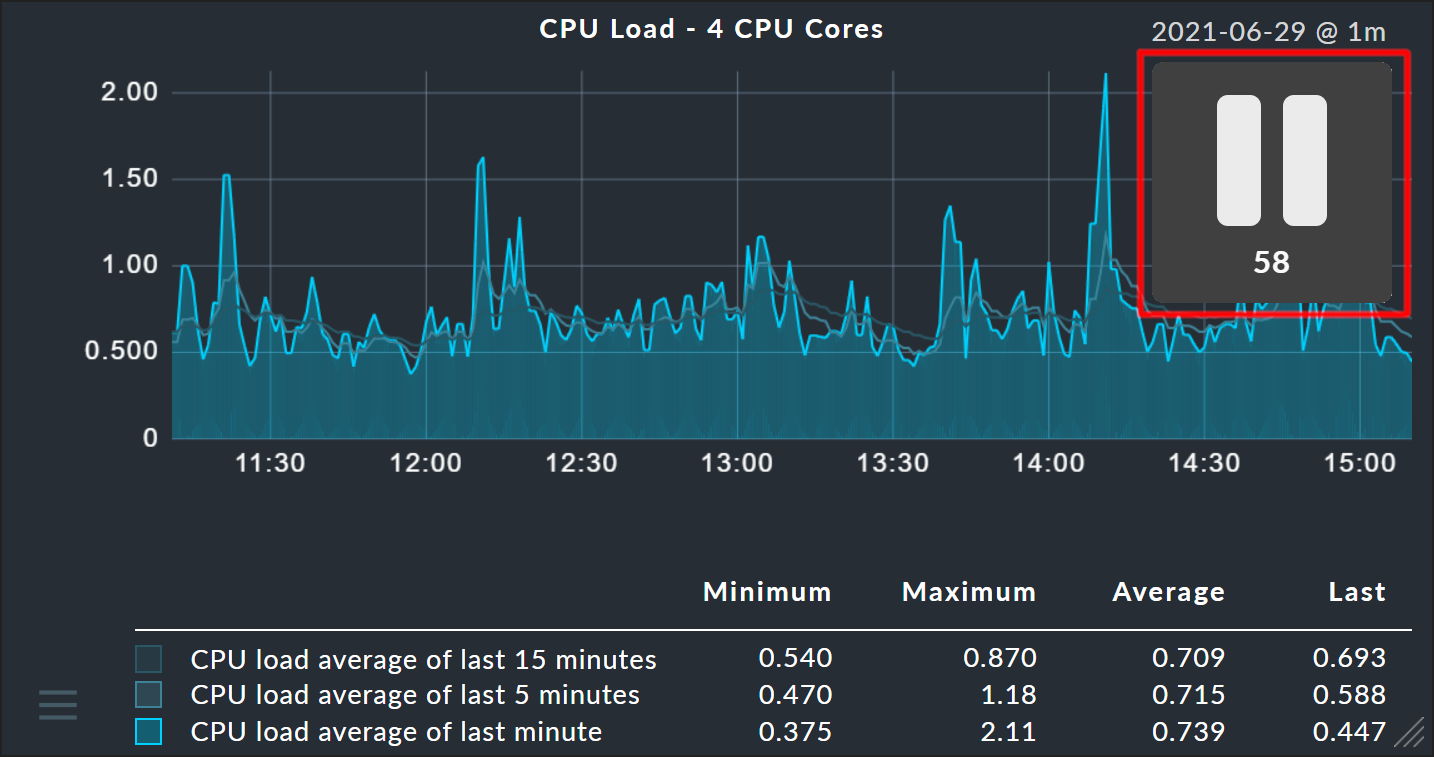
As soon as you use the interactive functions — such as setting a pin — a large ‘pause’ symbol appears on the screen and the page refresh stops for 60 seconds. This means that your changes in the graph are not immediately reversed by the refresh. The countdown is always reset to 60 seconds when you become active again. You are also able to pause the countdown completely by clicking the number. The pause symbol allows you to end the pause directly in any case.
4. Graph collections
In the Checkmk Enterprise Editions, you can use the
![]() menu, which is displayed at the bottom left of the graph, to embed it in various places — in reports or dashboards for example.
The menu section Add to graph collection is very useful here.
You can pack as many graphs as desired in such a graph collection and
later compare or export them as PDFs. By default every user has a graph
collection named My graphs. You can very easily add new ones, and even make
them visible to other users. The procedure is exactly the same as that for views.
menu, which is displayed at the bottom left of the graph, to embed it in various places — in reports or dashboards for example.
The menu section Add to graph collection is very useful here.
You can pack as many graphs as desired in such a graph collection and
later compare or export them as PDFs. By default every user has a graph
collection named My graphs. You can very easily add new ones, and even make
them visible to other users. The procedure is exactly the same as that for views.
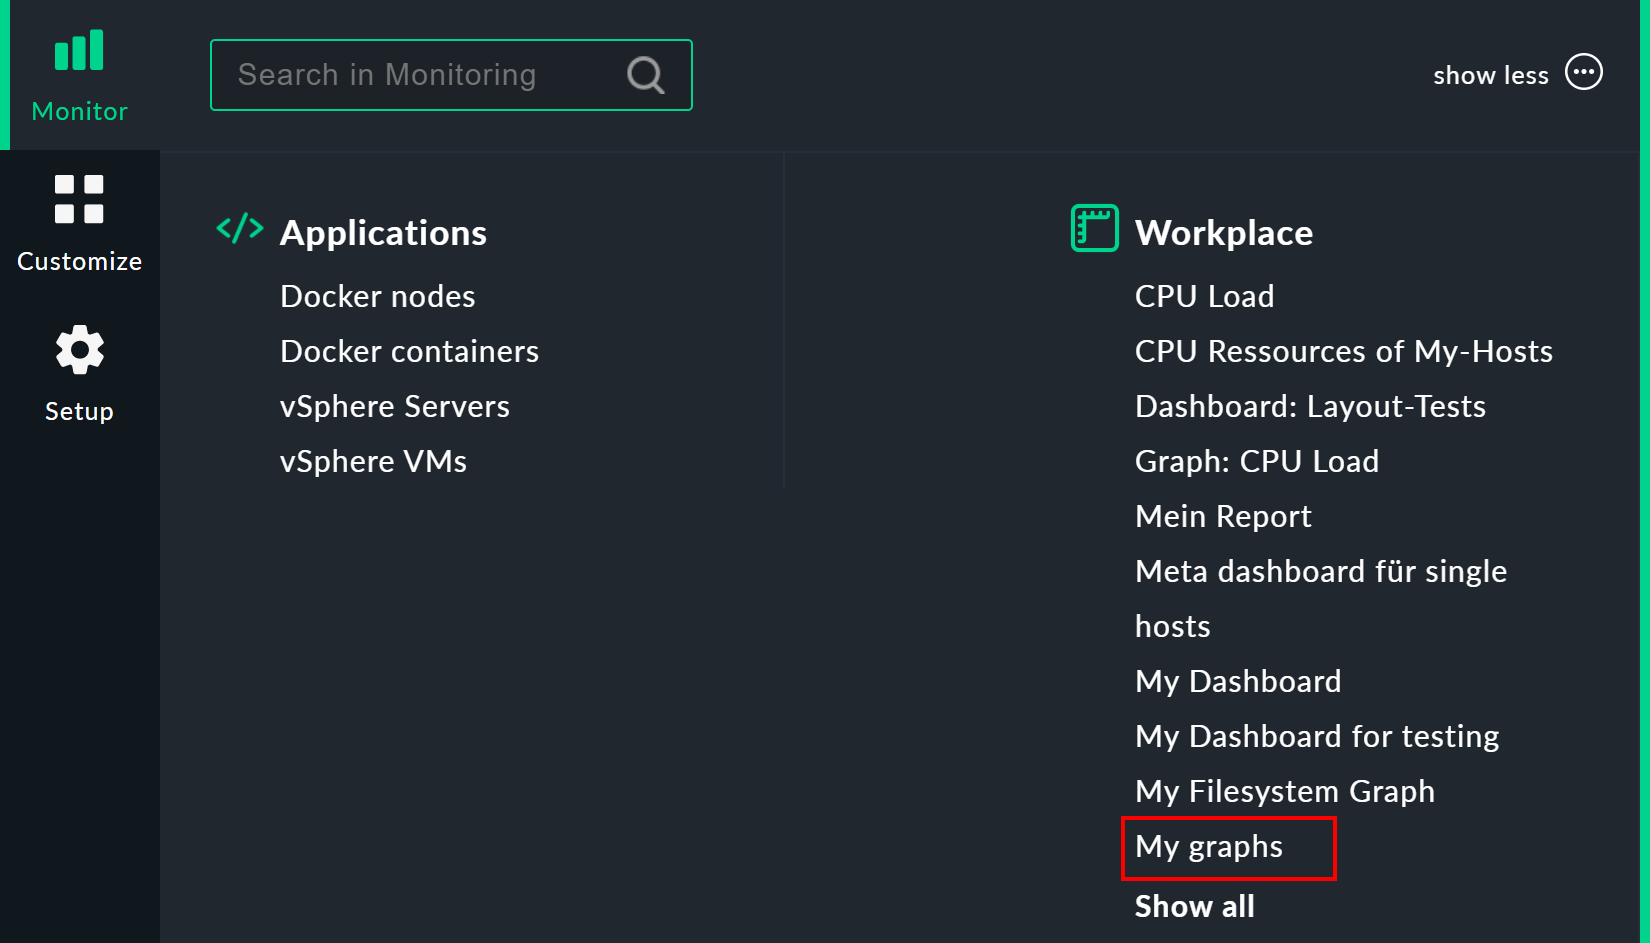
You access your graph collection via Monitor > Workplace > My graphs. The My graphs entry only appears if you have actually added at least one graph to that collection.
Customize > Graphs > Graph collections opens the table listing all of your graph collections, and enables you to add new ones, to modify existing ones, etc.
5. Graph tunings
In the Checkmk Enterprise Editions you can make small adjustments to the built-in graphs via Customize > Graphs > Graph tunings.
These Graph tunings allow you, for example, to change the scaling of the Y-axis for a particular graph, via the option Vertical axis scaling:
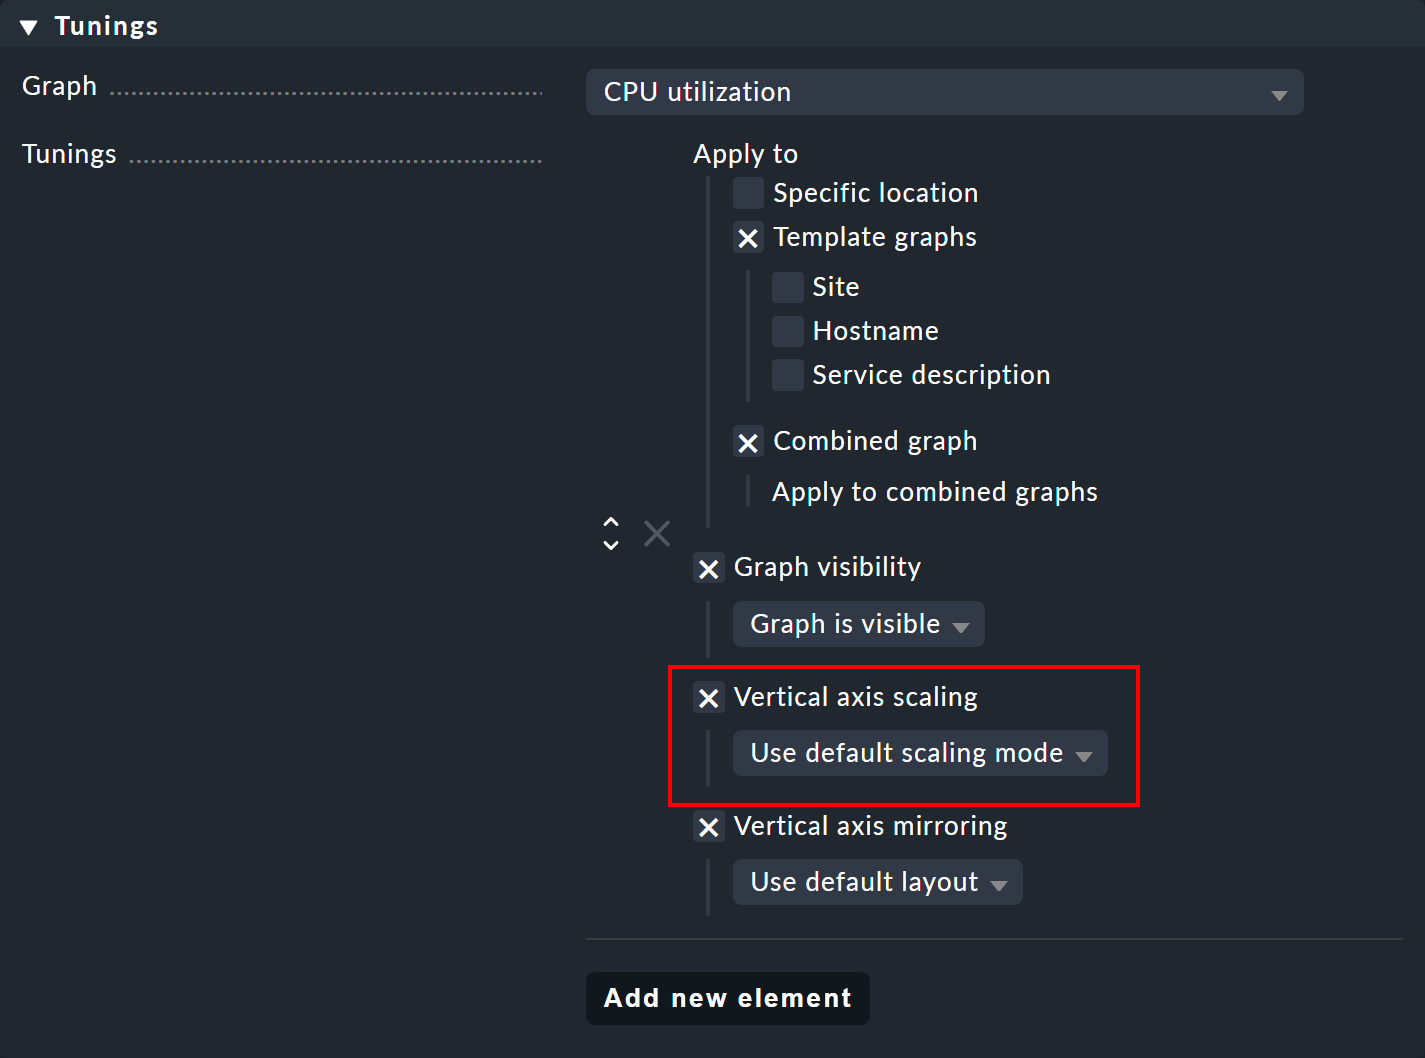
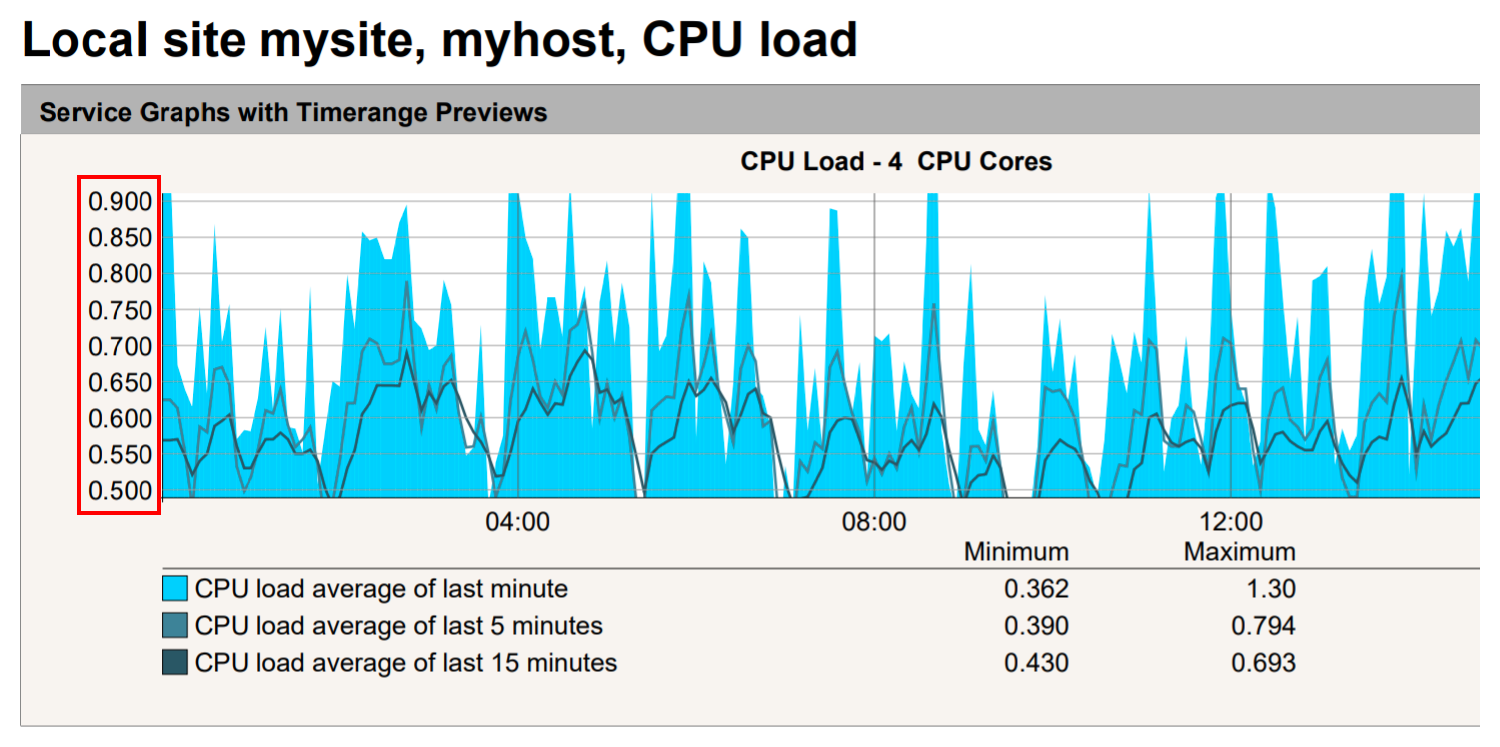
This change could then also be limited to specific occurrences of the graph with Apply to, for example in dashboards. The following image shows a scaling to the range 0.5 to 0.9 in a PDF report:
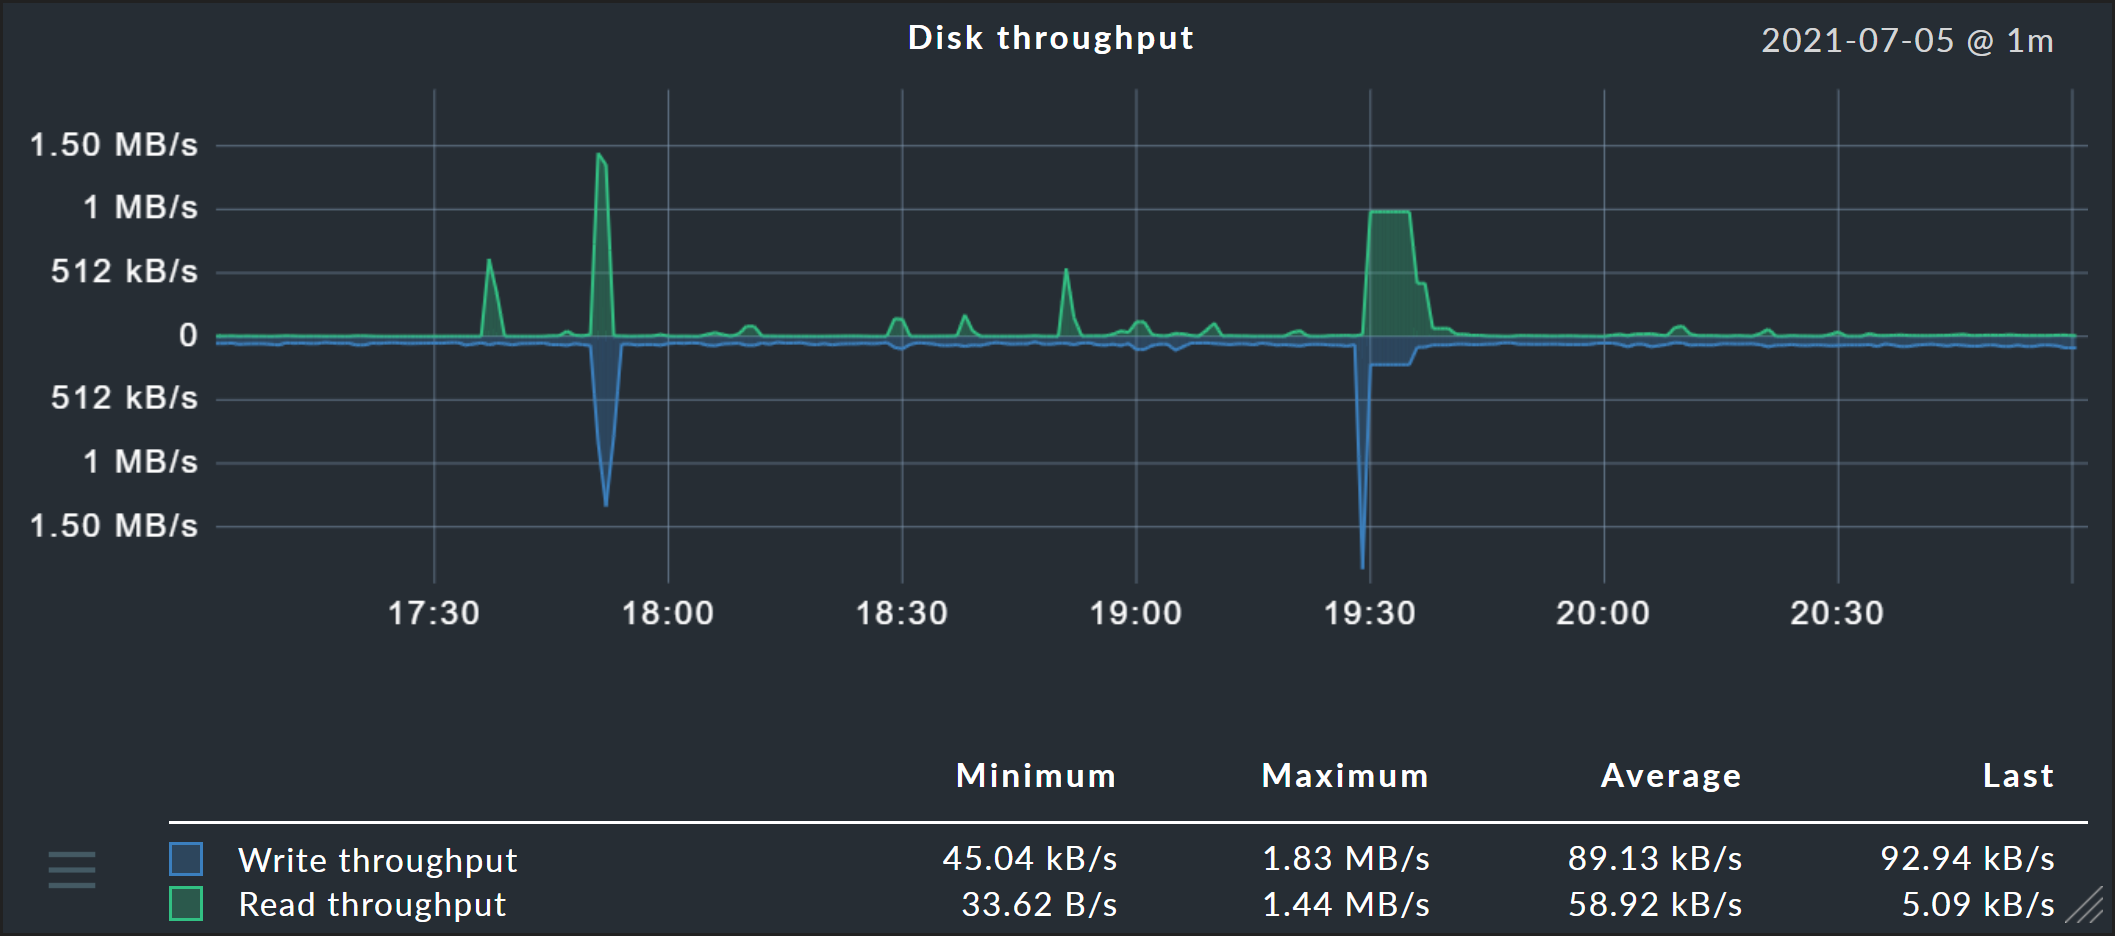
In addition, two further options are available: Graph visibility can be used to explicitly show or hide a graph at certain locations. And Vertical axis mirroring is useful for graphs that show data above and below the timeline (X-axis), such as the graph Disk throughput below: There, the data can be mirrored so that the previously upper data is displayed below the timeline and vice versa.
6. Custom graphs
The Checkmk Enterprise Editions provide a graphic-editor with which you can create your own complete graphs with their
own calculation formulae. With this it is now also possible to combine values
from different hosts and services into a single graph.
You access the custom graphs via Customize > Graphs > Custom graphs.
An alternative method is via a service’s metrics table.
For each metric there is a ![]() menu with an entry to add the metric to a custom graph:
menu with an entry to add the metric to a custom graph:

The following image shows a list of the custom graphs (here with only a single entry):
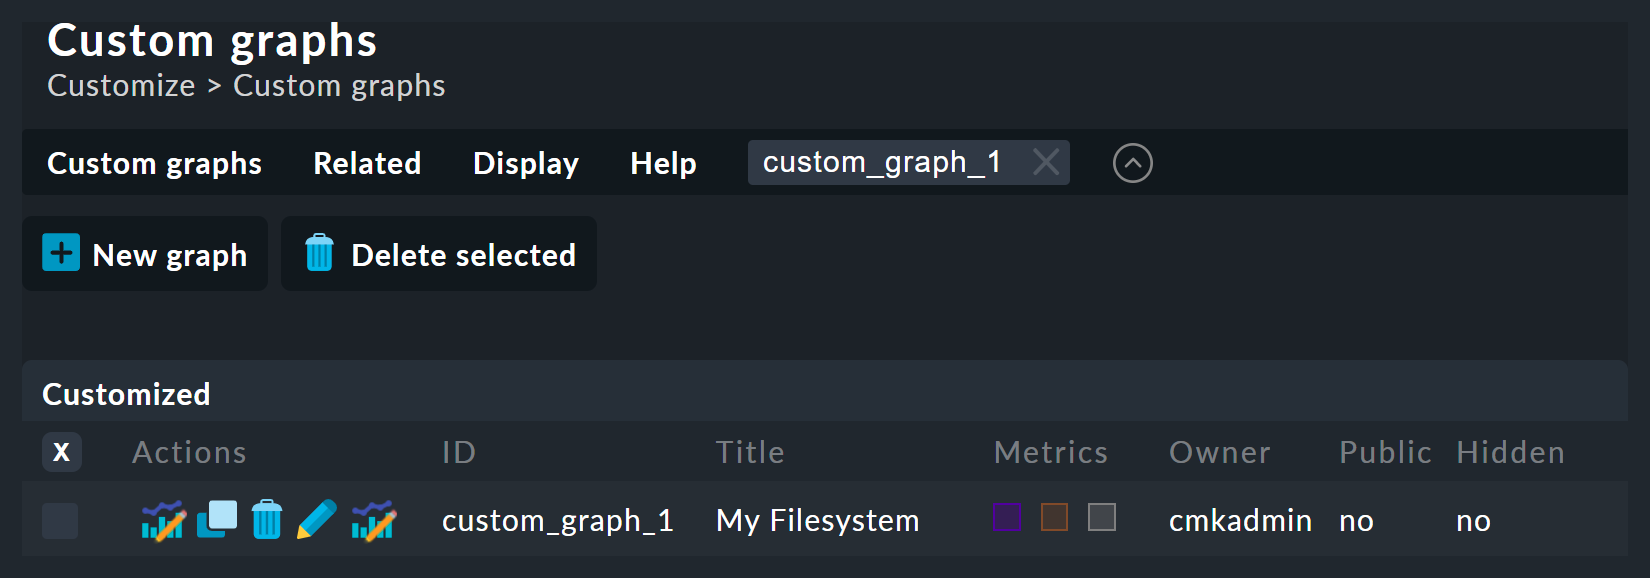
There are five possible operations for every existing graph:
|
View this graph. |
|
Create a copy of this graph. |
|
Delete this graph. |
|
Open this graph’s properties. Here, as well as the graph’s title, you can also define its visibility for other users. All of these function in exactly the same way as with views. If you have questions regarding one of the settings, you can have the context-sensitive help displayed with Help > Show inline help. |
|
Here you can access the graph designer, in which the graph’s content can be modified. |
Note that every custom graph — like the views — has a unique ID. This ID is addressed in reports and dashboards. If you later change a graph’s ID these links will be broken. All graphs that are not hidden are displayed by default under Monitor > Workplace.
6.1. The graph designer
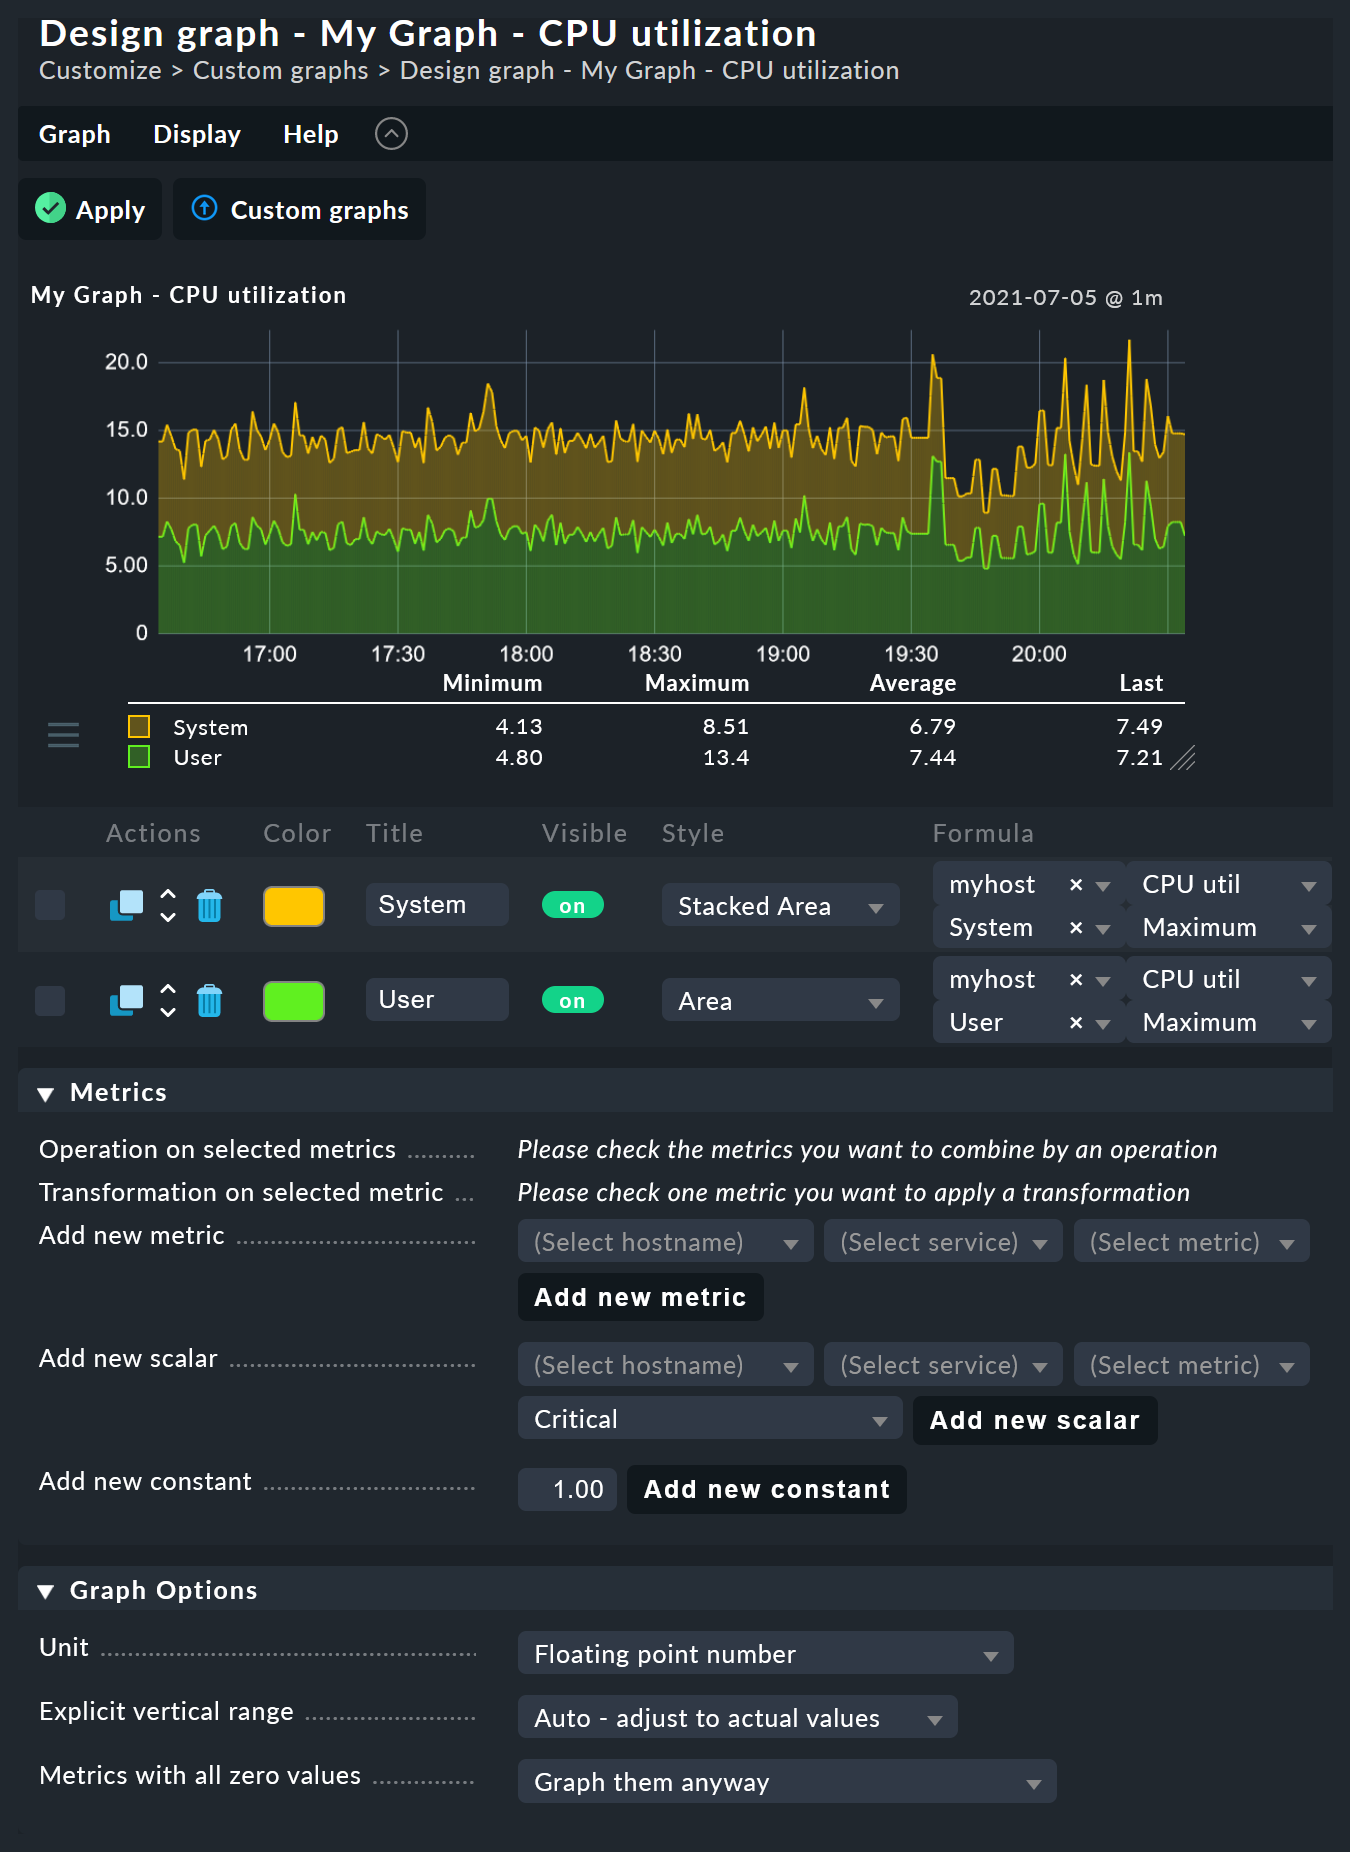
The graph designer is divided into four sections:
6.2. Graph preview
Here you can see the graph exactly as it will be seen live. You can also use all of its interactive functions.
6.3. Metrics list
Curves included in the graphs can be directly-edited here. Modifying a curve’s title in this field is confirmed with the ‘Enter’ key. The Style defines how the values in graphs are displayed. Here are the possible options:
Line |
The value will be drawn as a line |
Area |
The value will be drawn as an area. Be aware that curves positioned higher in the list have priority over and could cover later ones. If you wish to combine lines and areas, the areas should always be positioned below the lines. |
Stacked Area |
All curves with this style will be drawn as areas and stacked according to their values (in effect, added). The upper limit of this stack therefore symbolises the sum of all of the curves in the graph. |
The three further options — Mirrored Line, Mirrored Area and Mirrored Stacked are similar, except that the curves are drawn downwards from the zero line. This enables a style of graph such as generally used by Checkmk in input/output graphs for the following:
In the Actions column, you will find a button for cloning each metric that you have created. With this you can quickly copy curves and simply replace the host name, for example.
6.4. Adding metrics
With the Metrics box you can add new metrics to graphs. As soon as you enter a valid host name in the first field, the second field will be filled with a list of the host’s services. Making a selection in this list will fill the third field with a list of this service’s metrics. In the fourth and last field, select the consolidation function. Here the options are Minimum, Maximum and Average. These functions are used when the data stored in the RRDs for the specified time range has already been compressed. In a range where, for instance, only one value per half hour is available, you can choose to plot the minimum, maximum, or average original measured value for this time range.
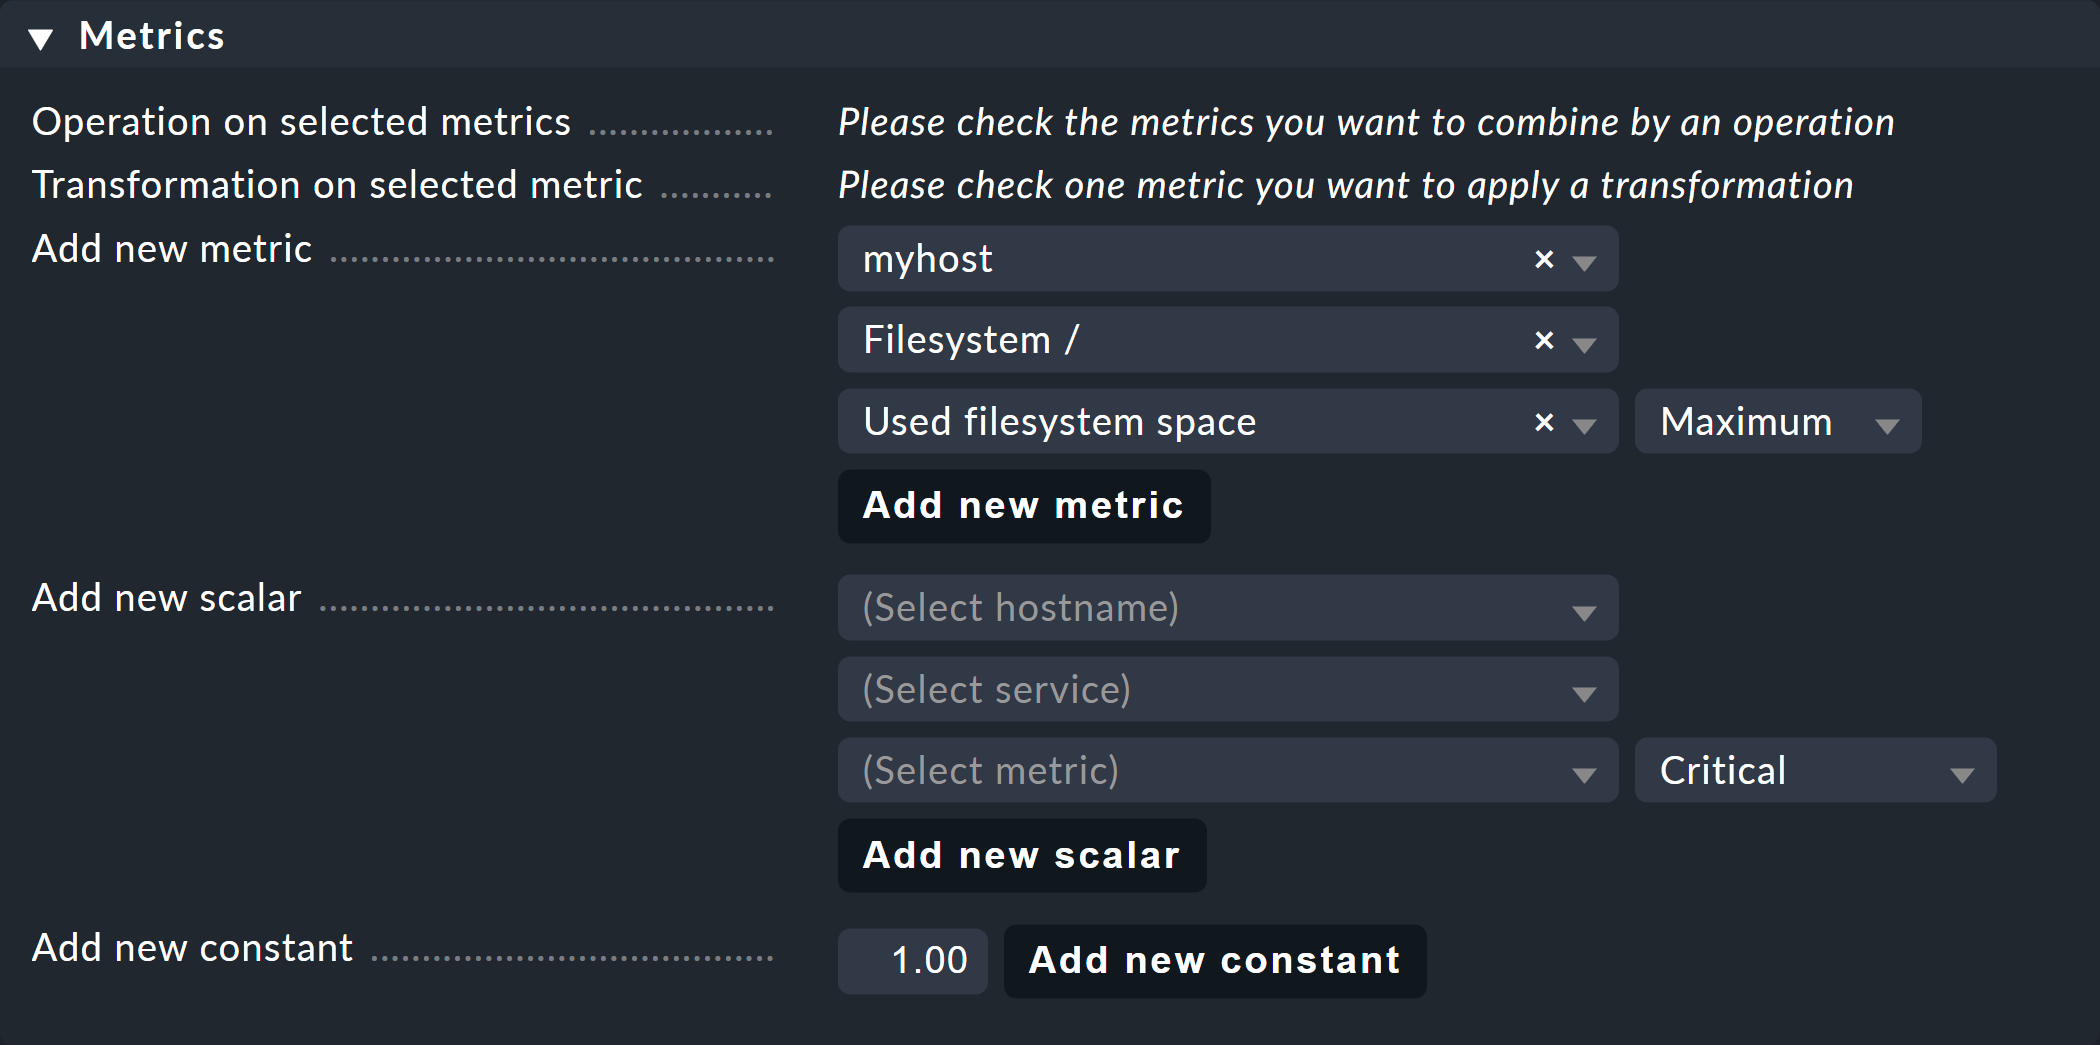
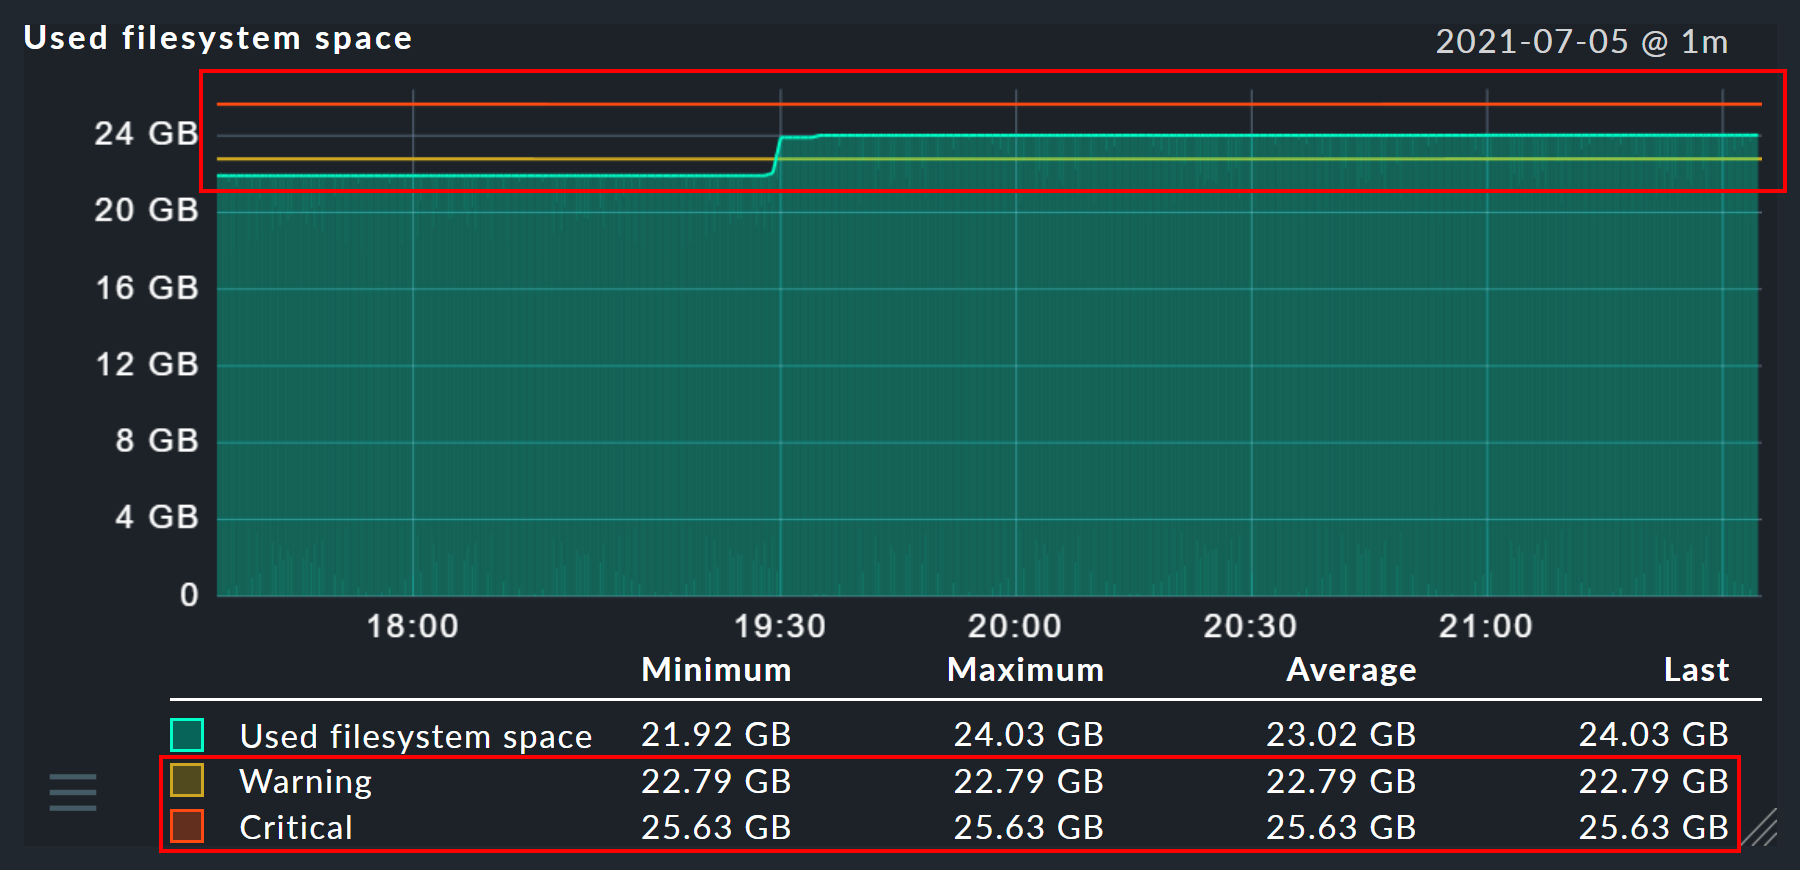
In the same way, you can use the function Add new scalar to display the values of a service for WARN, CRIT, maximum and minimum as horizontal lines.
You can also add a constant to the graph. This will initially be drawn as a horizontal line. Constants are sometimes required to generate calculation formulae. More on this later.
6.5. Graph options
Here you can find options that affect complete graphs. Unit influences the labelling of the axes and legends. It will be set automatically when the first metric is added. Note that it is possible, but not advisable, to add two metrics with differing units to a single graph.
With Explicit vertical range you can predefine a graph’s vertical axis. The Y-axis is normally scaled so that all values in the chosen time range fit exactly in the graph. If you create a graph for percentage values, for example, you can choose to always display the values from 0 to 100. Note though, that users (and you yourself) can in any case scale a graph using the mouse, making the positioning ineffective.
6.6. Calculating with formulae
The graph designer makes it possible for you to combine the individual curves using calculations. The following example shows a graph with two curves: CPU utilization, for User and System.
Let’s assume that for this graph, you are only interested in the sum of the two curves. For this you check the selection boxes for both curves. When this is done, in the Metrics panel on the row Operation on selected metrics a few new buttons will have appeared for all the eligible operations:
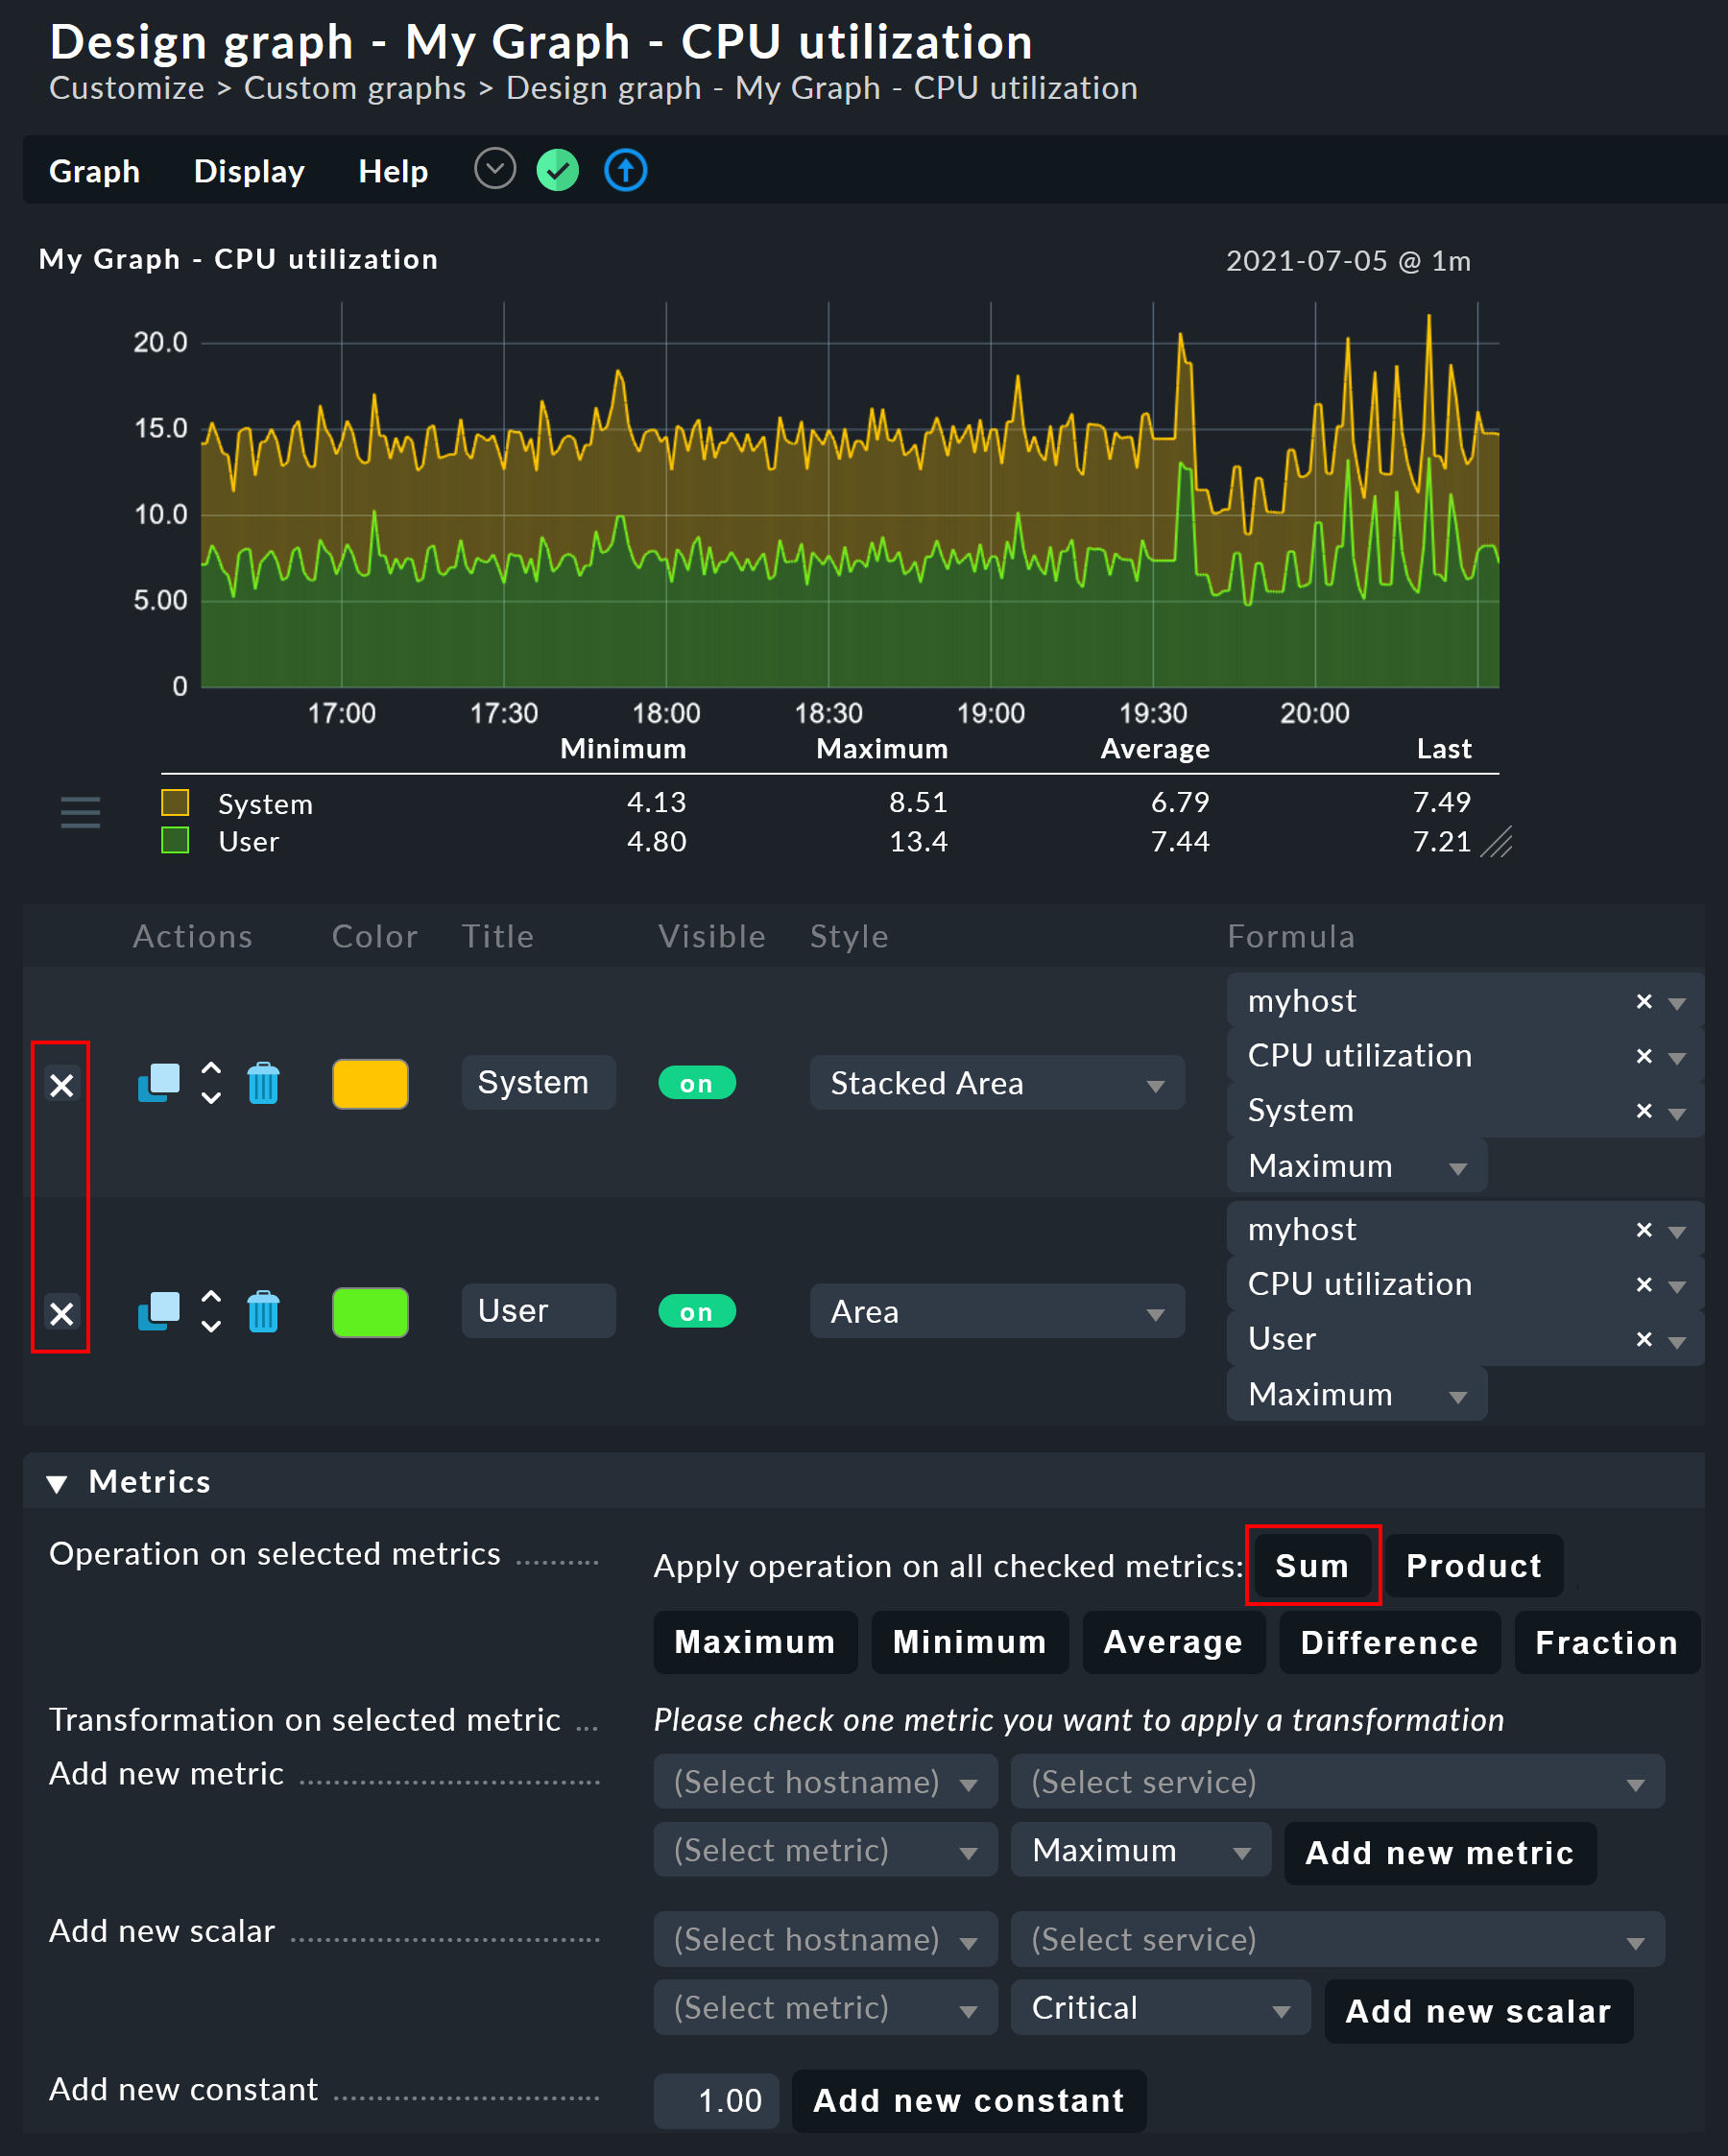
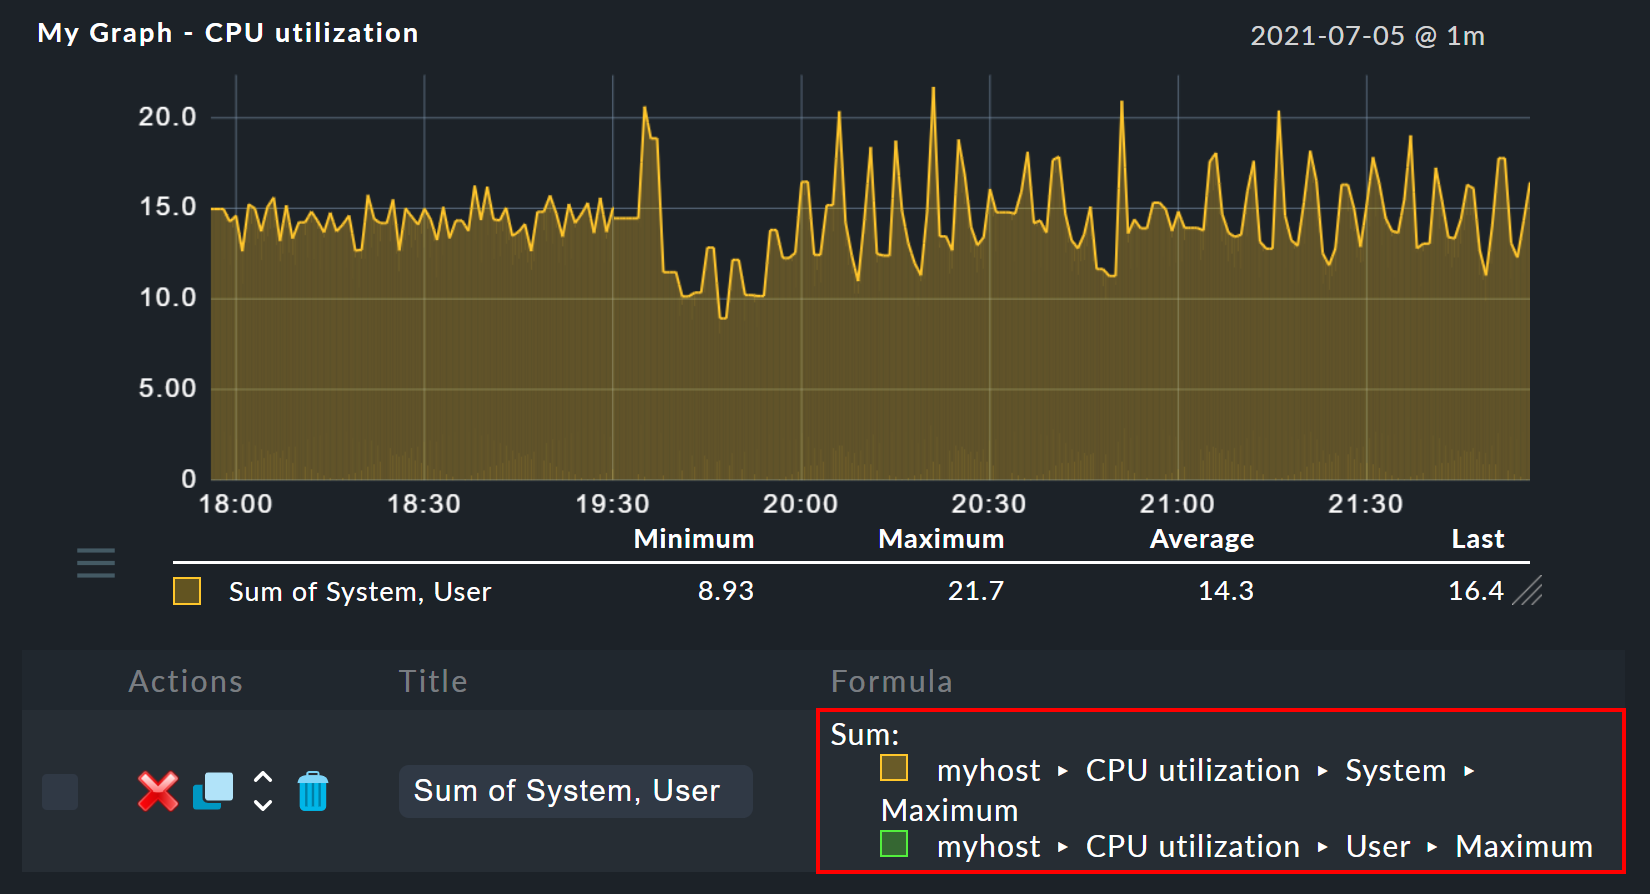
Clicking on Sum will combine both curves into a new curve. This new curve’s
colour will automatically be a mixture of the colours of the two input curves.
The new curve will be titled Sum of User, System. The formula used for the
calculation will be shown in the Formula column. In addition a new
![]() symbol will appear:
symbol will appear:
Clicking on ![]() works as an ‘undo’, with
which the original individual curves can again be displayed. Further tips for
calculation operations:
works as an ‘undo’, with
which the original individual curves can again be displayed. Further tips for
calculation operations:
It is sometimes sensible to include constants — to subtract a curve’s value from the number 100, for instance.
Scalars can be used for calculations.
The operations can be nested in any order.
7. InfluxDB, Graphite and Grafana
If you use one of the
Checkmk Enterprise Editions, you can connect external metrics databases in parallel to the graphing built into Checkmk and send the metrics to InfluxDB or Graphite.
In all Editions it is also possible to integrate Checkmk with Grafana and retrieve and display metrics from Checkmk in Grafana.
8. Historical performance data in tables
8.1. What is this about?
If you look at past performance data you are sometimes not interested in the exact details of their progress over a time period. Just a rough summary may be of more interest, e.g. The average CPU utilization over the last 7 days. The result in this example would simply be a number as percentage like 88%.
In a table of hosts or services, you can add columns that represent the average, minimum, maximum, or other summaries of a metric over a period of time. This feature also enables you to create reports that sort by these columns, e.g. display the list of those ESXi hosts that had the lowest utilization in the selected period.
To display such measured values in a view, proceed as follows:
Select an existing view or create a new one.
Add a column of type Services: Metric History.
8.2. Creating a view
First you need a view to which you want to add columns. This can be a view of either hosts or of services. For details on creating or editing views, see the article on views.
For the following example, we choose the All hosts view, which you can open via Monitor > Hosts > All hosts. From the menu, select Display > Customize view. This will take you to the Clone view page, where you can customise the view to your liking.
So that the original All hosts is not overlaid by the copy, choose a new ID and also a new title under which the view will later be displayed in the Monitor menu.
Then (optionally) remove all columns showing the number of services in the different states.
8.3. Adding a column
Now add a column of the type Services: Metric History. Since this is a column of services, in the case of a host view you need the column type Joined column as the first selection, which enables the display of a service column in a host table. With a service view, it is sufficient to add a new Column.
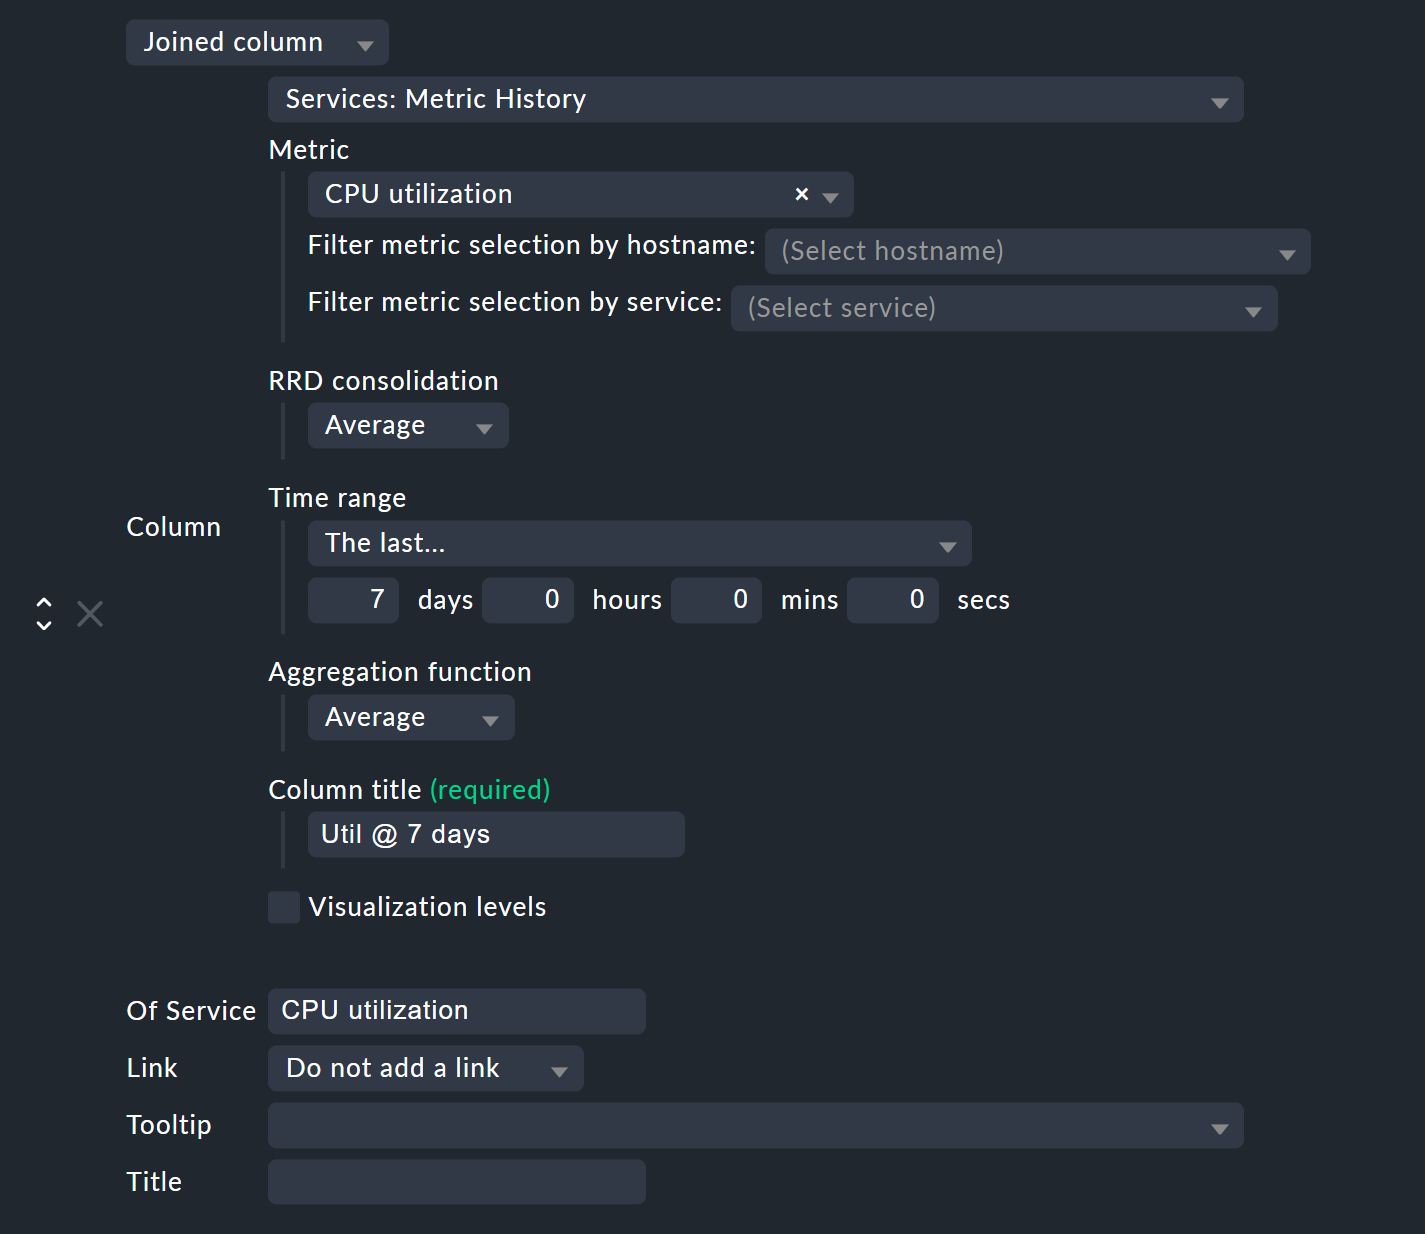
In Metric select the name of the metric that is to be historically-evaluated. If you are unsure of the metric’s name, you can find this in the service details at the Service Metrics entry:

In the example we choose the metric CPU utilization, which also happens to be the same as the name of the service..
With RRD consolidation it is best to choose the same value as that used below in the Aggregation function, since it would make little sense to calculate things like 'the minimum of the maximum'. You can find out what the selection option for RRDs is all about in the following chapter on organisation of RRD data.
The Time range is the time period in the past which you want to investigate. In the example, it is the last seven days, which is exactly 168 hours.
In the example, we choose Util @ 7 days as the Column title.
Don’t be surprised that a field with the name Title appears later — you will only see this if a Joined column is used here, which always allows the specification of a title.
Just leave the second title blank.
Finally, in the Of Service field, enter the name of the service to which the metric selected above belongs. Pay attention to the exact spelling of the service including upper and lower case.
After saving, you will now get a new view with an added column that shows the percentage of CPU usage over the past seven days.

Notes
You can of course also add multiple columns in this way, e.g. for different metrics or different time periods.
For hosts that do not have the relevant metric or service, the column remains empty.
If you work with a table of services, you don’t need a Joined Column. However, you can only display one service per host in each row.
9. The Round Robin Databases (RRDs)
Checkmk stores all data in specially-developed data bases, the so-called Round Robin Databases (RRDs). Here the RRDtool from Tobi Oetiker can be used, which is very popular and widely-used for open-source projects.
The RRDs offer important advantages for the storage of performance data in comparison to classic SQL data bases:
RRDs store data very compactly and efficiently.
The space used per metric on the drive is static. RRDs can neither grow nor shrink. The required disk space can be planned well.
The CPU and disk time per update is always the same. RRDs are (virtually) real-time capable, so that reorganisations can’t cause data jams.
9.1. Organisation of data in RRDs
By default Checkmk is configured so that the performance of every metric is recorded over a four year time range. The base resolution used is one minute. This makes sense as the check interval is preset at one minute, so that precisely once per minute new data will be received from every service.
Obviously, storing one value per minute over a four-year period will require an enormous amount of drive space (although the RRDs require only 8 bytes per measured value). For this reason, over time the data is compressed. The first compression is at 48 hours. From this time only one value will be stored every five minutes. Further stages are implemented after 10 days and 90 days:
| Phase | Duration | Resolution | Measurement points |
|---|---|---|---|
1 |
2 days |
1 minute |
2880 |
2 |
10 days |
5 minutes |
2880 |
3 |
90 days |
30 minutes |
4320 |
4 |
4 years |
6 hours |
5840 |
The obvious question now is — how best to consolidate five values meaningfully into one? For this the consolidation functions — maximum, minimum and average are available. What is meaningful in practice depends on the application or point of view. If, for example, you wish to monitor the temperature fluctuations in a processing centre over a four-year period, the maximum temperature recorded is probably of most interest. For an application’s access rates an average could be of more interest.
To achieve the maximum flexibility for later calculations, Checkmk’s RRDs are simply preset to store all three values at once — minimum, maximum and average. For each compression level and consolidation function the RRD includes a ‘ring’ style of storage — a so-called Round Robin Archive (RRA). In the standard structure there are 12 RRAs. The standard structure for Checkmk therefore requires 384,952 bytes per metric. This number is derived from: 2880 + 2880 + 4320 + 5840 measurement points, times three consolidation functions, times 8 bytes per measured value — which gives a total of exactly 382,080 bytes. Adding the file header of 2872 bytes gives the final size of 384,952 bytes quoted above.
An interesting alternative scheme would be, for example, to store one value per minute for an entire year. This method would have a small advantage: the RRDs would at all times have the optimal resolution, and could thereby dispense with consolidation and, only generate average value for example. Calculating 365 x 24 x 60 measurement points, times 8 bytes, the result is a total of almost exactly 4 MB per metric. In this way although the RRDs have a tenfold storage requirement, the 'disk I/O' is actually reduced! The reason is that it is no longer necessary to store and update in twelve separate RRAs, instead only one is needed.
9.2. Customising the RRD structure
If the predefined storage scheme does not suit you, it can be altered via
rule sets (and even different versions per hosts
or services are possible). The required rules set can be most easily found
via the rules search — thus the Setup menu. — and once there simply enter
RRD. Here you will find the rule
Configuration of RRD databases of services. There is also a similar rule
for hosts, but hosts have performance data only in exceptional cases.
The image below shows the RRD rule with its default settings:
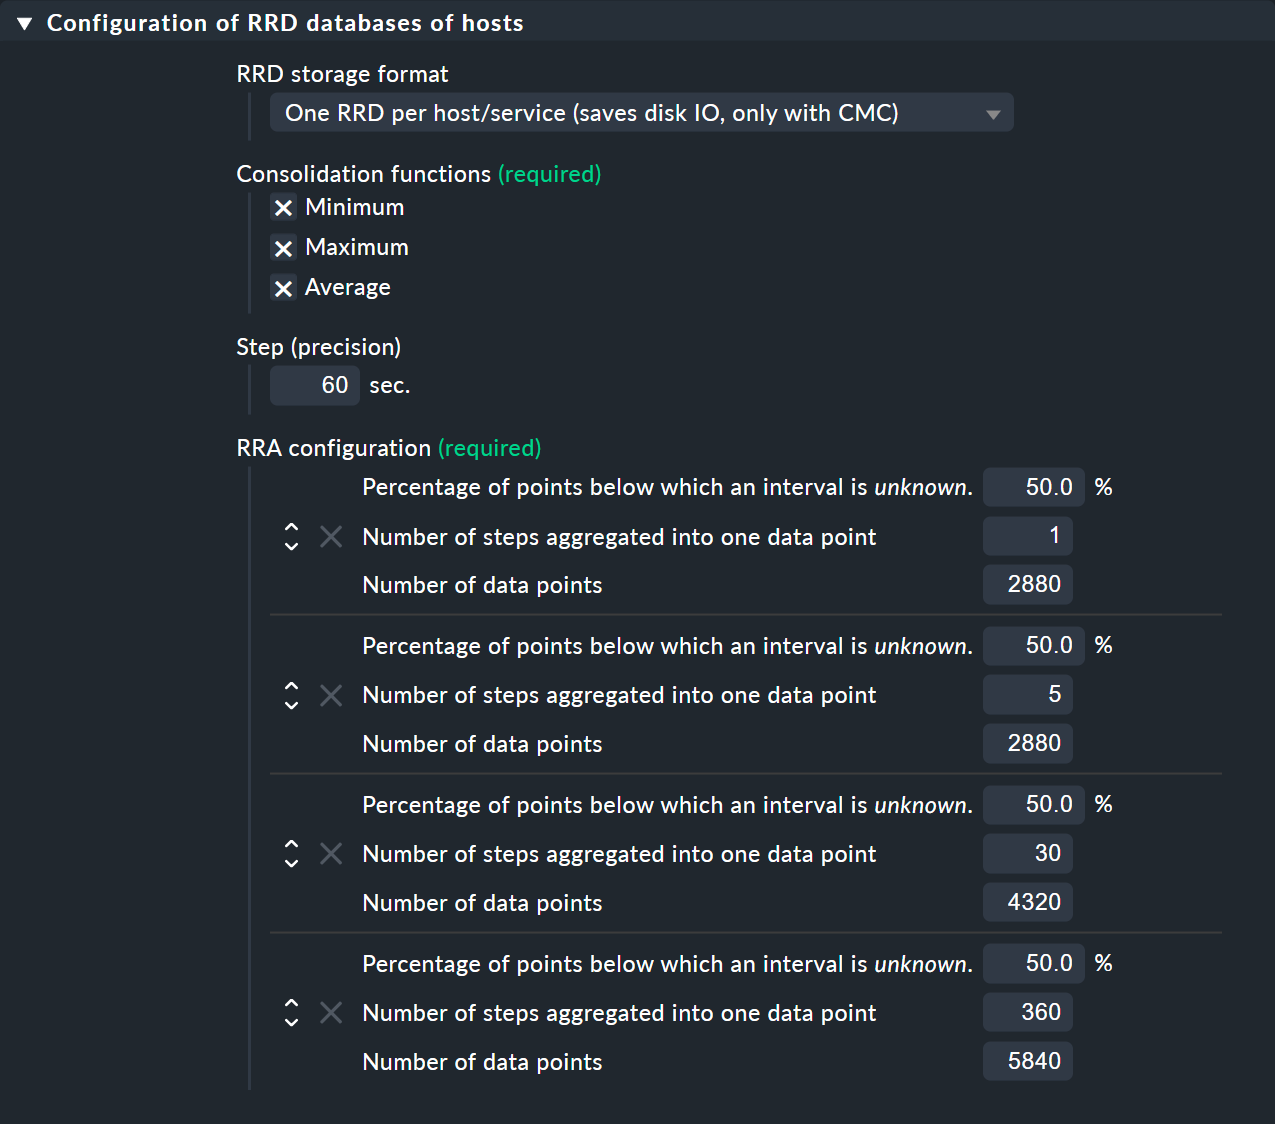
Under Consolidation functions and RRA configuration you can define and set the number and size of the compression phases ready for use by consolidations. The Step (precision) field defines the resolution in seconds, and as a rule it is 60 seconds (one minute). For services with a check interval of less than a minute it can be sensible to set this number lower. Note however that the value in the Number of steps aggregated into one data point field will no longer represent minutes, but instead the time interval set in Step (precision).
Every change to the RRD structure initially has an effect only on
newly created RRDs — that is to say, on hosts or services
newly-incorporated into the monitoring. You can also allow Checkmk to
restructure existing RRDs. This is performed by the cmk --convert-rrds
command, for which the -v (verbose) option is always available.
Checkmk will then inspect all existing RRDs and restructure them as needed
into the defined target format.
Important: To ensure the integrity of the data contained in the RRDs, always stop your site (with omd stop) before converting existing RRDs with cmk --convert-rrds.
OMD[mysite]:~$ cmk -v --convert-rrds
myserver012:
   Uptime (CMC).....converted, 376 KB -> 159 KB
   Filesystem / (CMC).....converted, 1873 KB -> 792 KB
   OMD mysite apache (CMC).....converted, 14599 KB -> 6171 KB
   Memory (CMC).....converted, 14225 KB -> 6012 KB
   Filesystem /home/user (CMC).....converted, 1873 KB -> 792 KB
   Interface 2 (CMC).....converted, 4119 KB -> 1741 KB
   CPU load (CMC).....converted, 1125 KB -> 475 KB
The command is intelligent enough to recognise RRDs that already have the desired structure:
OMD[mysite]:~$ cmk -v --convert-rrds
myserver345:
   Uptime (CMC).....uptodate
   Filesystem / (CMC).....uptodate
   OMD mysite apache (CMC).....uptodate
   Memory (CMC).....uptodate
   Filesystem /home/user (CMC).....uptodate
   Interface 2 (CMC).....uptodate
   CPU load (CMC).....uptodate
If the new format has a higher resolution or extra consolidation functions, the existing data will be interpolated as best it can be so that the RRDs will contain the most meaningful values possible. It is however naturally obvious that if, for example, instead of 2 days, you now require 5 days with values at one minute intervals, then the accuracy of the existing data cannot be retroactively increased.
9.3. The RRD storage format
The rule described above has a further setting: RRD storage format.
With this you can choose between two methods that Checkmk can use when
creating RRDs. The format One RRD per host/service (Checkmk format,
for short) stores all of a host’s or service’s metrics into a
single RRD file. This enables more efficient writing of data on a drive, so that a
complete set of metrics can always be written in a single operation. These
metrics are then located in neighbouring storage blocks, thereby reducing the
number of blocks that must be written to the disk.
If your Checkmk sites were created with any of the Checkmk Enterprise Editions older than version
1.2.8, you might want to have a closer look at whether your measurement
data was ever converted to the current and much more efficient format. Should the
data still be stored in PNP format you can convert it into the Checkmk format by
applying a rule as shown in the rule set above.
Here, too, you will also require the cmk --convert-rrds command, and again, always stop your site before converting existing RRDs.
OMD[mysite]:~$ cmk -v --convert-rrds
myhost123:
   Uptime PNP -> CMC..converted.
  WARNING: Dupliate RRDs for stable/Uptime. Use --delete-rrds for cleanup.
   OMD mysite apache PNP -> CMC..converted.
  WARNING: Dupliate RRDs for stable/OMD mysite apache. Use --delete-rrds for cleanup.
   fs_/home/user PNP -> CMC..converted.
  WARNING: Dupliate RRDs for stable/fs_/home/user. Use --delete-rrds for cleanup.
   OMD mysite apache PNP -> CMC..converted.
  WARNING: Dupliate RRDs for stable/OMD mysite apache. Use --delete-rrds for cleanup.
   Memory PNP -> CMC..converted.
...
You can see by the warning that Checkmk at first leaves the existing files
unaltered. This enables you, if in doubt, to return to this original data format, since
a conversion in the reverse direction is not possible. The
--delete-rrds option ensures that this copy is not created, or is
later deleted. You can easily perform the deletion later manually by again using the
command:
OMD[mysite]:~$ cmk -v --convert-rrds --delete-rrds9.4. The RRD cache daemon (rrdcached)
In order to (drastically) reduce the number of write accesses to a disk drive,
an auxiliary service can be used: the RRD cache daemon (rrdcached). This is
one of the services started when a site is started:
OMD[mysite]:~$ omd start
Temporary filesystem already mounted
Starting mkeventd...OK
Starting liveproxyd...OK
Starting mknotifyd...OK
Starting rrdcached...OK
Starting cmc...OK
Starting apache...OK
Starting dcd...OK
Starting redis...OK
Initializing Crontab...OK
All new performance data for the RRDs are sent from the Checkmk Micro Core (Enterprise Editions) or from
the NPCD (Raw Edition) to the rrdcached. This does not write the data directly into
the RRDs, but rather holds it in main memory for later writing as a collection
to the respective RRD. In this way the number of write accesses to the disk
drive (or to the SAN!) are noticibly reduced.
So that no data is lost in the case of a restart the updates are additionally written to journal log files. These are also write accesses, but as the data is arranged sequentially, they generate little IO.
For the RRD cache daemon to be able to work efficiently, it needs a lot of main
memory. The amount required depends on the number of RRDs and on how long the
data should be cached. The latter can be defined in the
etc/rrdcached.conf data. The standard setting is to store for 7200
seconds (two hours) — this value can be customised by the user — plus a random
range of 0-1800 seconds (this maximum value is fixed). This randomised delay
per RRD averts ‘pulsed’ writing and ensures that IO is distributed regularly
over time:
# Tuning settings for the rrdcached. Please refer to rrdcached(1) for
# details. After changing something here, you have to do a restart
# of the rrdcached (reload is not sufficient)

# Data is written to disk every TIMEOUT seconds. If this option is
# not specified the default interval of 300 seconds will be used.
TIMEOUT=3600

# rrdcached will delay writing of each RRD for a random
# number of seconds in the range [0,delay). This will avoid too many
# writes being queued simultaneously. This value should be no
# greater than the value specified in TIMEOUT.
RANDOM_DELAY=1800

# Every FLUSH_TIMEOUT seconds the entire cache is searched for old values
# which are written to disk. This only concerns files to which
# updates have stopped, so setting this to a high value, such as
# 3600 seconds, is acceptable in most cases.
FLUSH_TIMEOUT=7200

# Specifies the number of threads used for writing RRD files. Increasing this
# number will allow rrdcached to have more simultaneous I/O requests into the
# kernel. This may allow the kernel to re-order disk writes, resulting in better
# disk throughput.
WRITE_THREADS=4
Activate an alteration to the settings in this file with:
OMD[mysite]:~$ omd restart rrdcached
Stopping rrdcached...waiting for termination....OK
Starting rrdcached...OK
9.5. Files and directories
Here is an overview of the most important files and directories associated with performance data and RRDs (all those related to the site’s home directory):
| Path name | Description |
|---|---|
|
RRDs in Checkmk format |
|
RRDs in the old format (PNP) |
|
Journal log files of the RRD cache daemon |
|
Log file of the RRD cache daemon |
|
Log file of the Checkmk core (contains error messages on RRDs, if applicable) |
|
Settings for the RRD cache daemon |
