1. Introduction
1.1. What do SLAs do?
In Checkmk you can evaluate availability, and for these also configure a rudimentary SLA evaluation. Now the absolute availability over a given period is not particularly meaningful. To take an extreme example: an availability of 99.9 percent would allow less than 10 hours of downtime per year — actually only 8 hours, 45 minutes and 36 seconds to be precise. Distributing these 8.76 hours over a year averages a bit more than 43 minutes per month — which may be acceptable for many systems. A complete hour outage at a stretch would however cause a lot of damage. It is obvious that such an outage should be reflected in the assessment of availability.
If you’re using one of the Enterprise Editions Checkmk has a separate function for Service Level Agreements (SLA).
The SLA feature builds on the availability data and now enables a much more detailed evaluation.
Two basic types of evaluation can be implemented:
Percentage SLA: Percentage that a service status (OK, WARN, CRIT, UNKNOWN) is above or below a given value.
Outage SLA: Maximum number of outages – more precisely, occurrences of the CRIT, WARN, and UNKNOWN statuses over a given time frame.
You can combine one or both types for multiple sites – for example, to ensure that during the reporting period a particular service is at least 90 percent OK, and that a maximum of two events of two or more minutes are permitted to flag the CRIT condition.
The results of these calculations can later be rendered in two formats in views:
Service-specific: A service will display its associated SLA.
Column-specific: A fixed SLA is displayed for each service.
For example, here you can see the evaluation for a file system in the overview: from today (with 3 icons in the rightmost column) and for the previous 15 days — and also immediately see that there were obvious problems up until 4 days ago:

But what do these evaluations reveal to you now? On the one hand you can see the fulfillment or non-fulfillment of completed SLAs, and for example, inform your customers of these evaluations. On the other hand, you can already identify an impending failure in advance: By default, the SLA indicator will light up CRIT when its value has been exceeded. But it can also be adjusted so that it goes to CRIT if, for example, the permitted CRIT status for the service has reached 80 percent – and before that point it could change to a WARN flag.
Ultimately, SLAs are mostly very detailed views, generated from the analysis of availability data. You will see these later at two points: in tables, optionally for all hosts and services listed there, or only for services that are specifically tied to individual SLAs. Secondly, there is a comprehensive detail page for each service-SLA combination.
1.2. Functionality
The basis for the SLA function is the availability data. The calculations on the SLA specifications are, of course, not applied to the entire raw data inventory – after all, SLA reports should cover specific time periods. So first it is determined for which period the SLA requirements should be met – the so-called 'SLA period’. For example: "Over each monthly monitoring period, the status of the service MyService should be at least 90 percent OK." For this SLA period not necessarily (inevitably) all data for the month over a 24/7 operation will be used. The data can be converted to the time periods defined in the Setup, i.e., be limited roughly to working hours.
This then results in a more concrete requirement such as: "The service MyService over one month (the SLA period), during working hours (the time period) – Monday to Friday from 10:00 to 20:00 – should be 90 percent OK (SLA request)." The SLA and time periods complement each other, where of course, the latter does not have to be restricted: You can use all of the monitoring data generated over the SLA period.
In summary: You need two periods to restrict the data basis for the calculation of an SLA requirement:
SLA period: The period (e.g., weekly) agreed in the SLA that forms the basis for the report.
Time period: Active time periods as specified in the Setup configuration (such as business days only).
An independent result is generated for each SLA period. How many of these individual results you show in a table can be configured via views. So, for example, the last five weeks, limited to business days, shown as five individual SLA periods directly on the hosts and services.
As usual with Checkmk, between the data source (SLA definition) and the output (view) there is still a rule to assign for SLA-specific services — but this is not a must. And thus for SLAs this usually results in a three-step process, when they apply to specified services:
Define the SLA via Customize > Business reporting > Service Level Agreements.
Assign the SLA to hosts/services with Setup > Services > Service monitoring rules > Assign SLA definition to service rule (optional).
Create or adapt views for the SLA as required.
Here’s how to set up a simple SLA including a view:
The file systems of the hosts MyHost1 and MyHost2 over a reporting period of one week are required to be in an OK condition for at least 90 per cent of the time (here in this example a maximum of 80 percent has been reached).
In addition they are allowed to assume the WARN condition for two or more minutes for a maximum of five occasions.
2. Setting up SLAs
2.1. Creating an SLA
First, create the actual SLA. The configuration can be found via Customize > Business reporting > Service Level Agreements (by the way, you can only see this menu item in Show more mode):

Create a new SLA via ![]() New SLA.
In the General Properties section, first give a unique ID, here
New SLA.
In the General Properties section, first give a unique ID, here MySLA, and a title, such as Filesystems:

Under SLA settings set the SLA period to the desired period, such as Weekly. The following requirements will therefore always be valid for this one week period.
But you can, before you set up the actual requirements also add further restrictions under Filtering and computation options, and set options which are not however needed for our simple example SLA:
| Option | Function |
|---|---|
Scheduled Downtimes |
Take scheduled downtimes into consideration. |
Status Classification |
Take flapping, downtimes and times outside the monitoring times into consideration. |
Service Status Grouping |
Reclassification of a status. |
Only show objects with outages |
Show only objects with given failure rates. |
Host Status Grouping |
Interpret the UNREACH host status as UNREACH, UP or DOWN. |
Service Time |
Take service times into consideration. |
Notification Period |
Include notification periods. |
Short Time Intervals |
Ignore intervals shorter than a given duration, so that brief interruptions are ignored (similar to the concept of soft states). |
Phase Merging |
Directly successive reporting periods of the same status should not be amalgamated. |
Query Time Limit |
Limit the query time as a solution for slow or non-answering systems. |
Limit processed data |
Limit the number of data lines to be processed; 5000 lines is standard. |
Next specify the actual requirements in the SLA requirements section with Add new timeperiod.
As long as you have specified time periods, these can also be used with the SLAs, as already mentioned for general availability.
Select a time period under Active in timeperiod, or as here in the example 24X7 - Always to define the requirements for a 24/7 operation.
Under Title, give a meaningful name, say 90 percent OK:
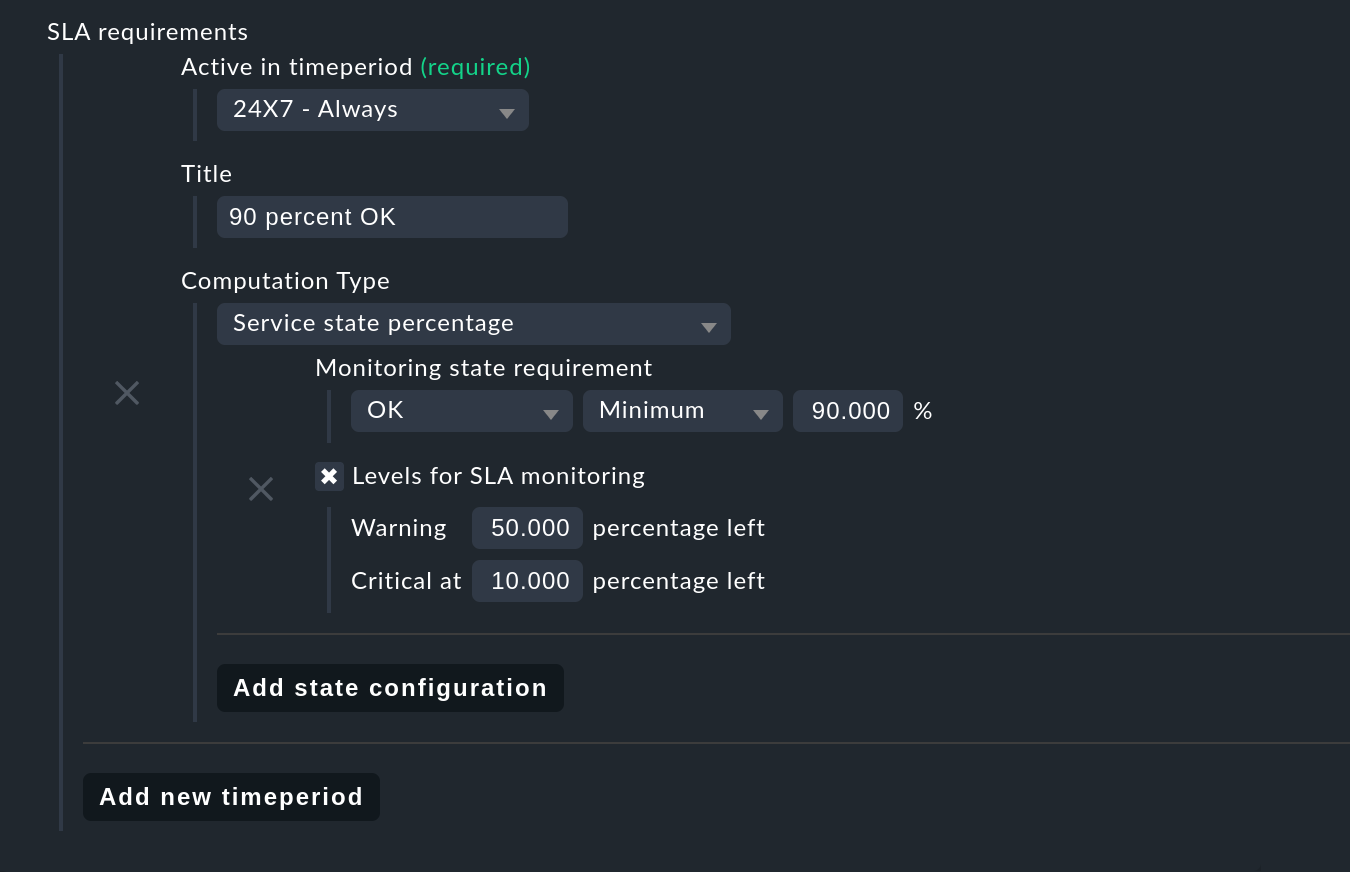
For Computation Type, for the first request select Service state percentage and add a new criterion via Add state configuration. A new paragraph opens for the Monitoring state requirement. To ask for at least 90 percent availability, set this record to OK, minimum, 90. If this value falls short, the SLA is considered broken and assumes the status CRIT, as will be seen later on the results page.
Perhaps the SLA should not wait until it breaks and then go to CRIT, but directly to WARN as soon as 50 percent of the buffer is consumed, and then to CRIT if there are 10 percent buffers left. The thing really breaking the SLA would then produce broken but no further status changes (more on this below in section SLA detail page). For such a configuration check the box at Levels for SLA monitoring. Here you can enter residual values for the transition to WARN and CRIT. This completes the first request.
Now add a second request with Add new timeperiod.
Again set the time period – under Title,
for example, specify Max 5 warnings of 2 minutes as the name and in this case set the Computation Type to Maximum number of service outages:
The actual request is then: Maximum 5 times WARN with duration 0 days 0 hours 2 mins 0 secs:
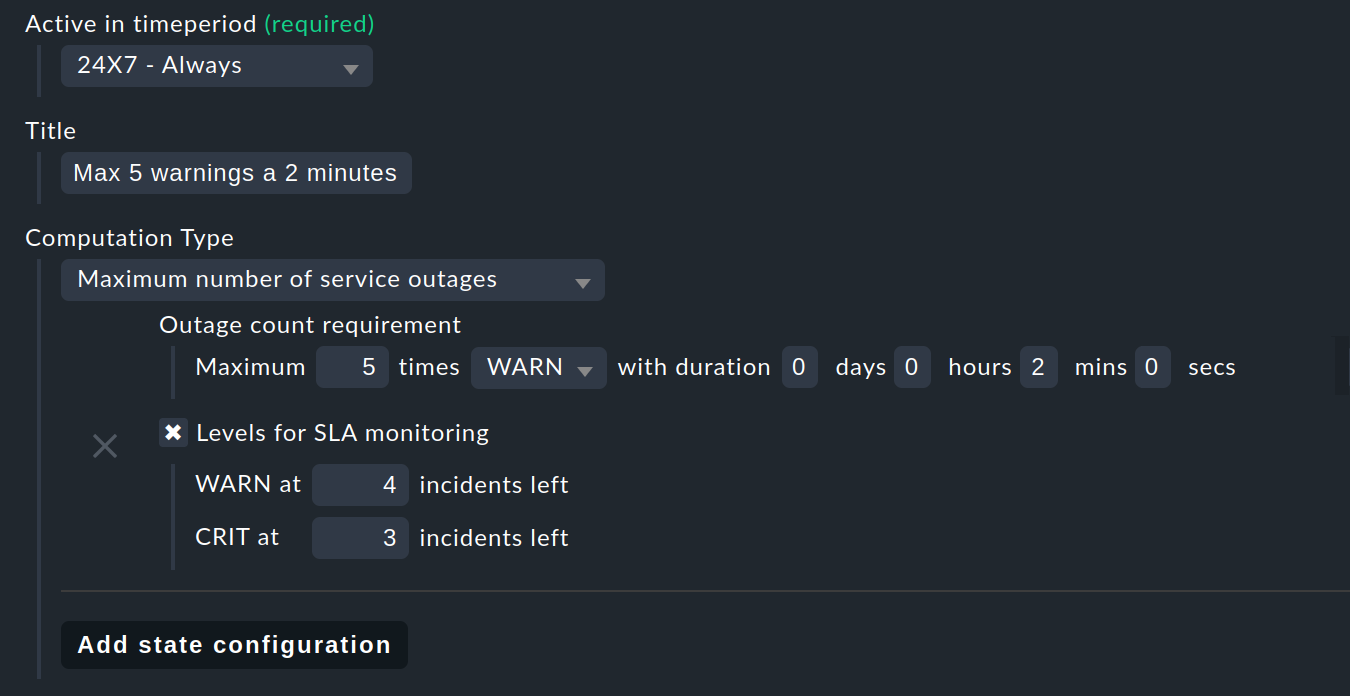
According to the SLA, per SLA period the service is now allowed the specified status on a maximum of five occasions, and each occurrence for a maximum of two minutes, without the SLA being flagged as broken. Instead of WARN another status could of course also be specified at this point. And again via the Levels for SLA monitoring you may also refine and determine how many remaining incidents will trigger a warning, before the SLA actually breaks with a WARN or CRIT.
As mentioned earlier, you can add more of these requirements and knit detailed SLAs together. But there are still no services that 'react‘ to this SLA — in our example, a rule must make this connection. How to use the configuration created up to this point without such an SLA service connection is described below under column-specific SLA displays.
2.2. Linking an SLA to a service
The SLA is connected to a service via the Setup > Services > Service monitoring rules > Assign SLA definition to service rule set.
Create a rule, enable the only rule-specific option Assign SLA to service, and then choose your SLA definition MySLA, listed here by its title Filesystems.

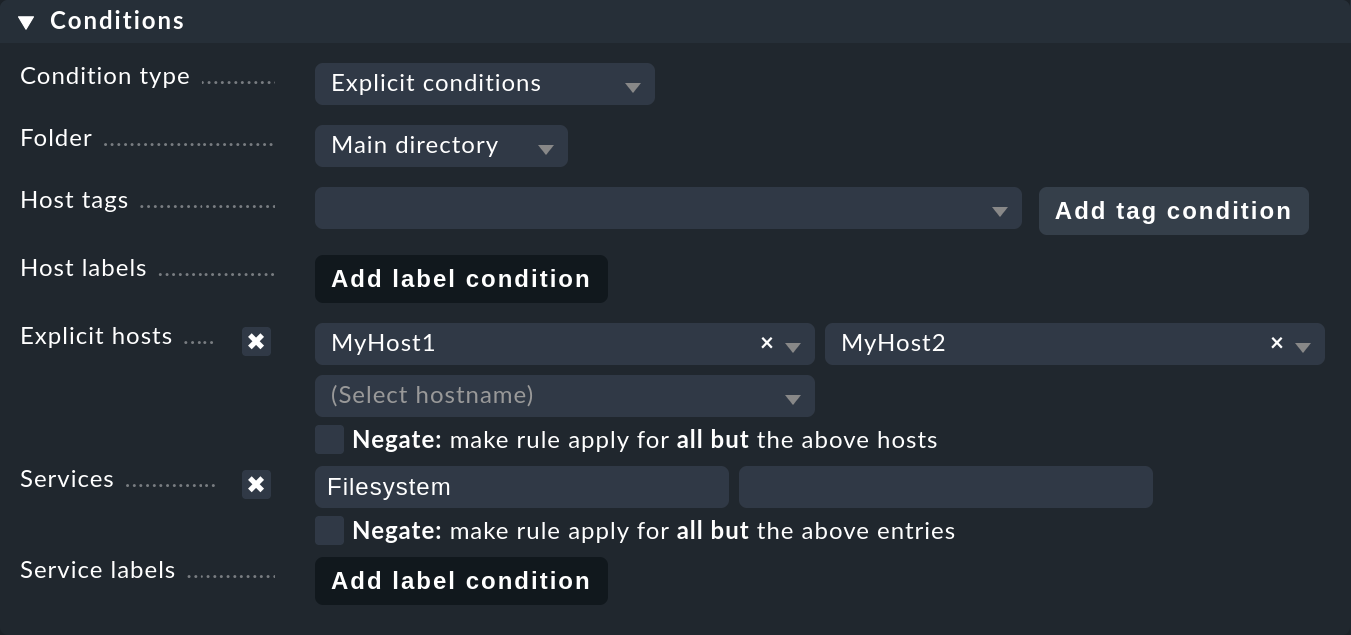
Next under Conditions in the Services section define further filters for the desired services.
As always, here you can work with regular expressions, and as in this example link the SLA definition to all local file systems via Filesystem.
Optionally you can still restrict everything using the rule-specific filters for folders, host tags and explicit hosts;
in our example they are the hosts MyHost1 and MyHost2:
Of course at this point you could also omit any service filtering and simply bind the SLA to all services. How and why it is better to do that with a column-specific SLA view is explained below.
2.3. Integrating an SLA in view
So you have now created the SLA definition MySLA, and tied it to all services for the two hosts that start with Filesystem.
Now create a new view for the SLAs.
For the SLA example a simple view of the two hosts with their file system services and SLAs should be sufficient.
For clarification, the Checkmk services to which no SLA is currently tied are added.
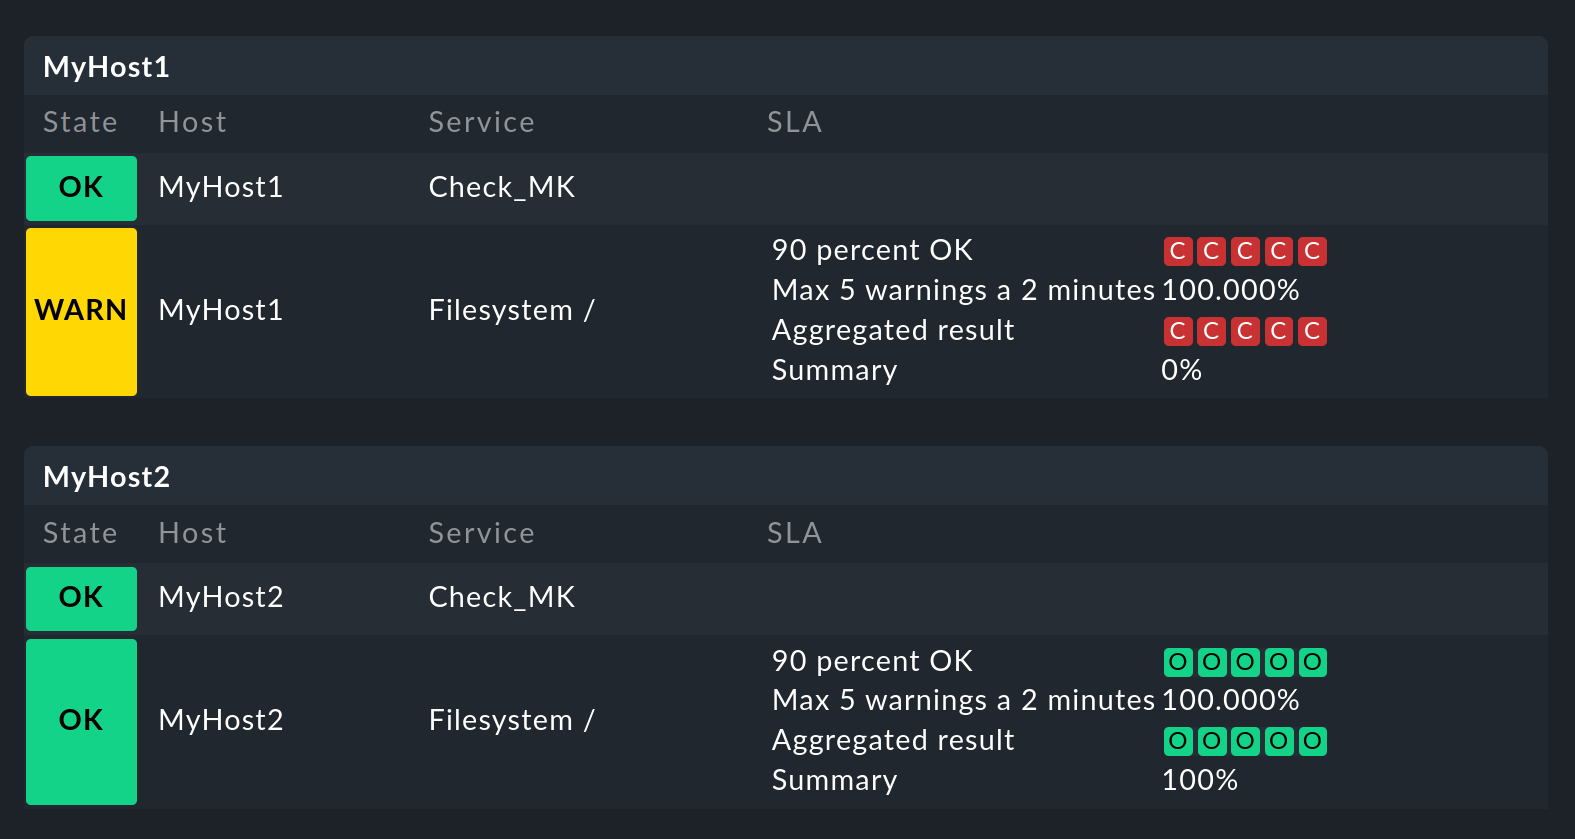
The result will look like the image at the end of this chapter.
Create a new view with Customize > Visualization > Views > Add view. In the first query specify All services as Datasource. Confirm the following query whether information of a single object should be shown with the default value No restrictions to specific objects.
Under General Properties, enter an ID (here MySLAView_Demo), a title (such as My SLA Demo View), and finally select a theme such as Workplace if you want to see the SLA views later under a separate item in the Monitor menu.
All other values can be left unchanged for this test.
Now navigate to the Columns box and initially via Add column add the three general columns Services: Service state, Hosts: Hostname and Services: Service description as the basis for the view.
The column selector also contains two SLA-specific columns: Hosts/Services: SLA - Service specific und Hosts/Services: SLA - Column specific. The latter shows a fixed SLA definition for each service in the view — the better alternative to an SLA for all services as mentioned above. More on this later.
Add the Hosts/Services: SLA - Service specific column at this point. Here all sorts of options are now available for the presentation of the SLAs’ results:
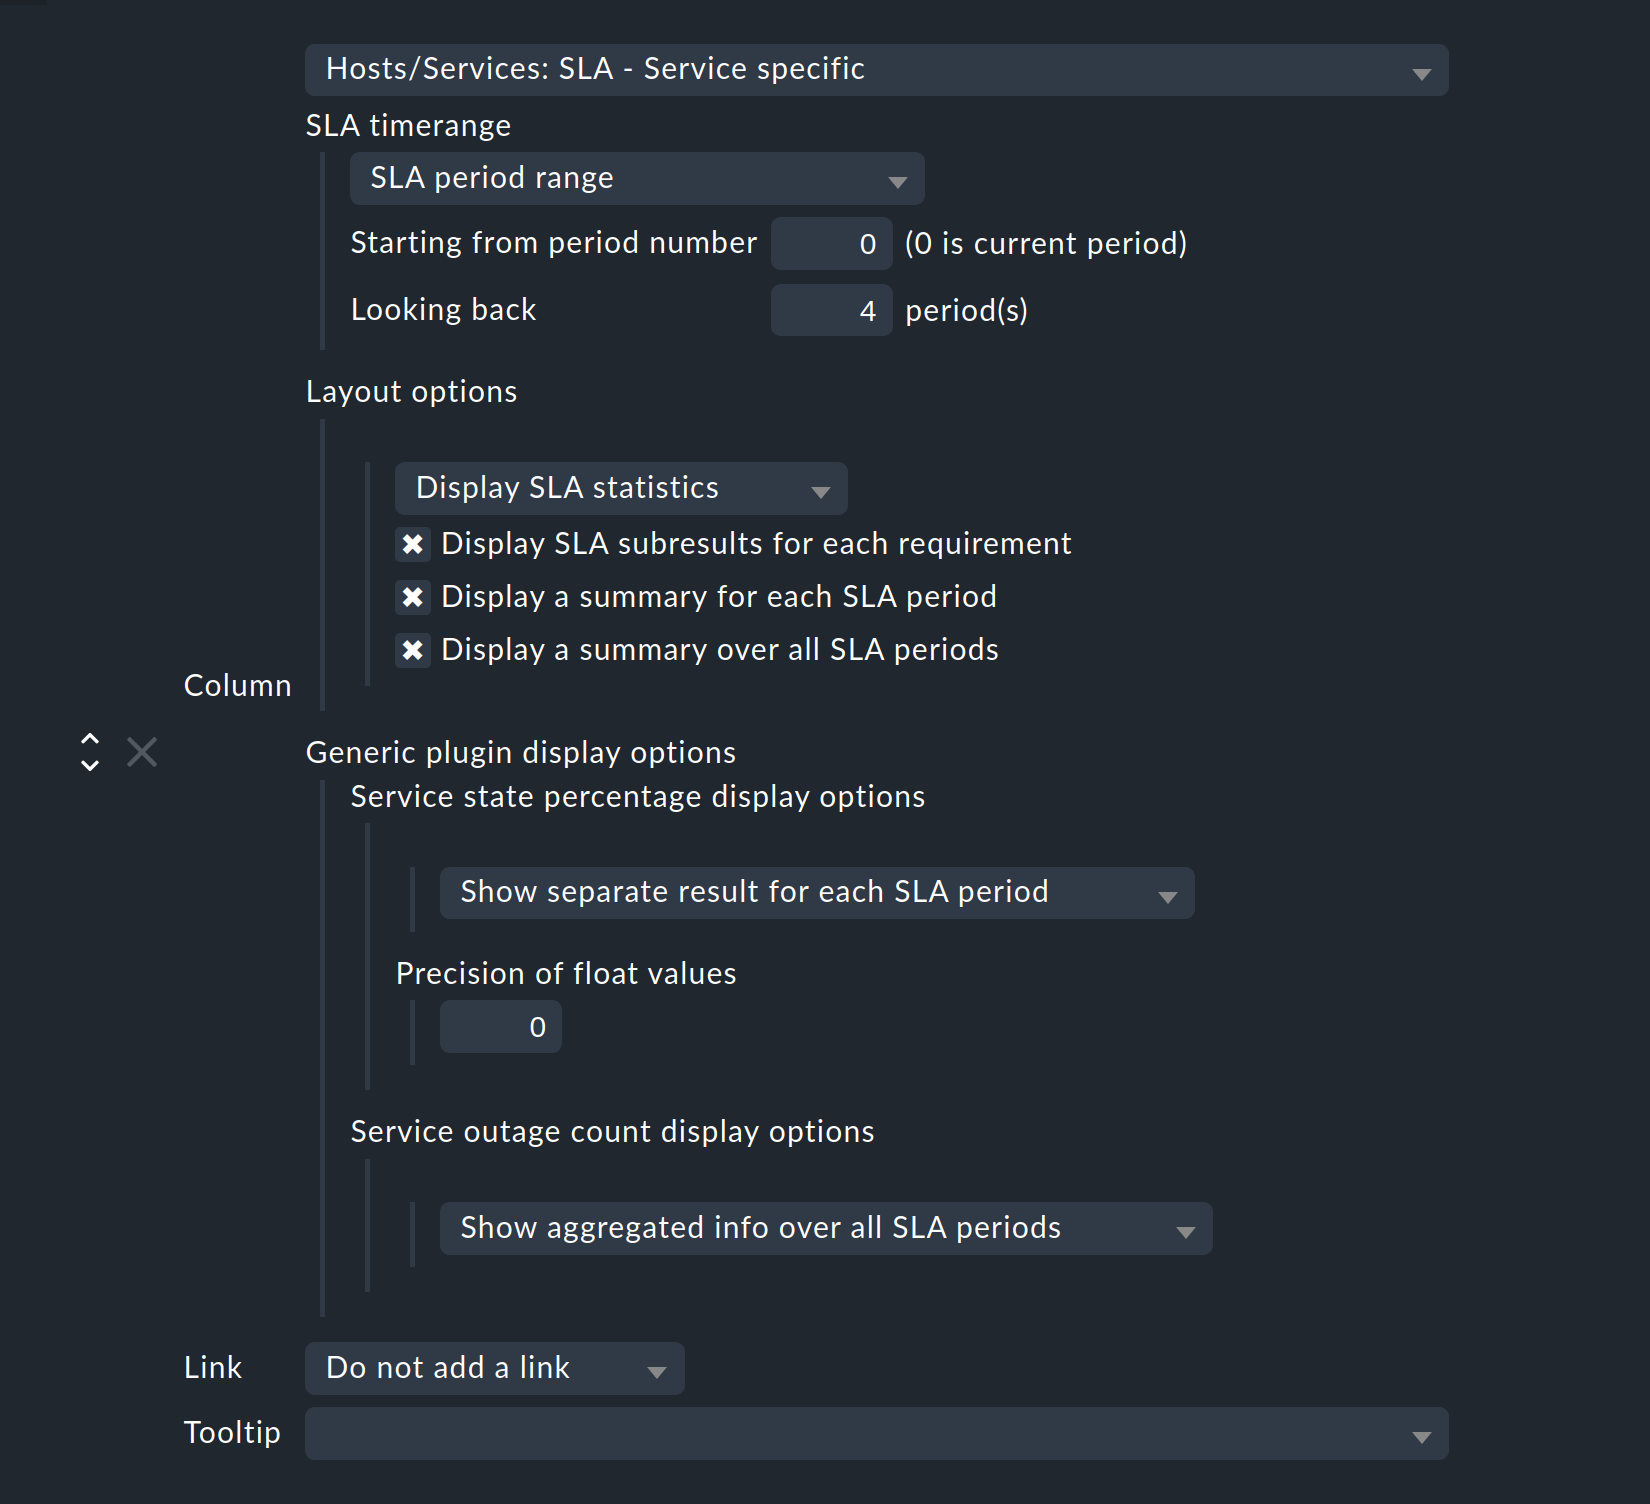
SLA timerange: Use this to set the time frame for for which you want to see SLA results.
For example, if you have the reporting period Monthly in your SLA definition and here Last Year, you receive twelve individual results.
In this example the SLA period range option is used to directly specify the number of displayed reporting periods:
For five periods/results set Starting from period number to 0, and Looking back to 4.
Layout options: By default, this option is set to Only Display SLA Name. To actually see the results of the SLAs, here choose Display SLA statistics. You can select up to three different elements:
Display SLA subresults for each requirement displays each affected SLA with name in a separate line.
Display a summary for each SLA period shows a graphic summary in the Aggregated result line.
Display a summary over all SLA periods: Shows a textual, percentage summary of all SLAs in the Summary line.
Activate all three options for this current example.
Generic plugin display options: At this point, for the display of outage/percentage SLAs, define whether summaries (texts) or respectively individual results (icons) for the reporting periods should appear. To see both in action, leave the percentage SLAs option at Show separate result for each SLA period and select Service outage count display options to Show aggregated info over all SLA periods.
If you want to group the view by individual hosts, under Grouping add the column Hosts: Hostname — which ensures a visual separation of the hosts.
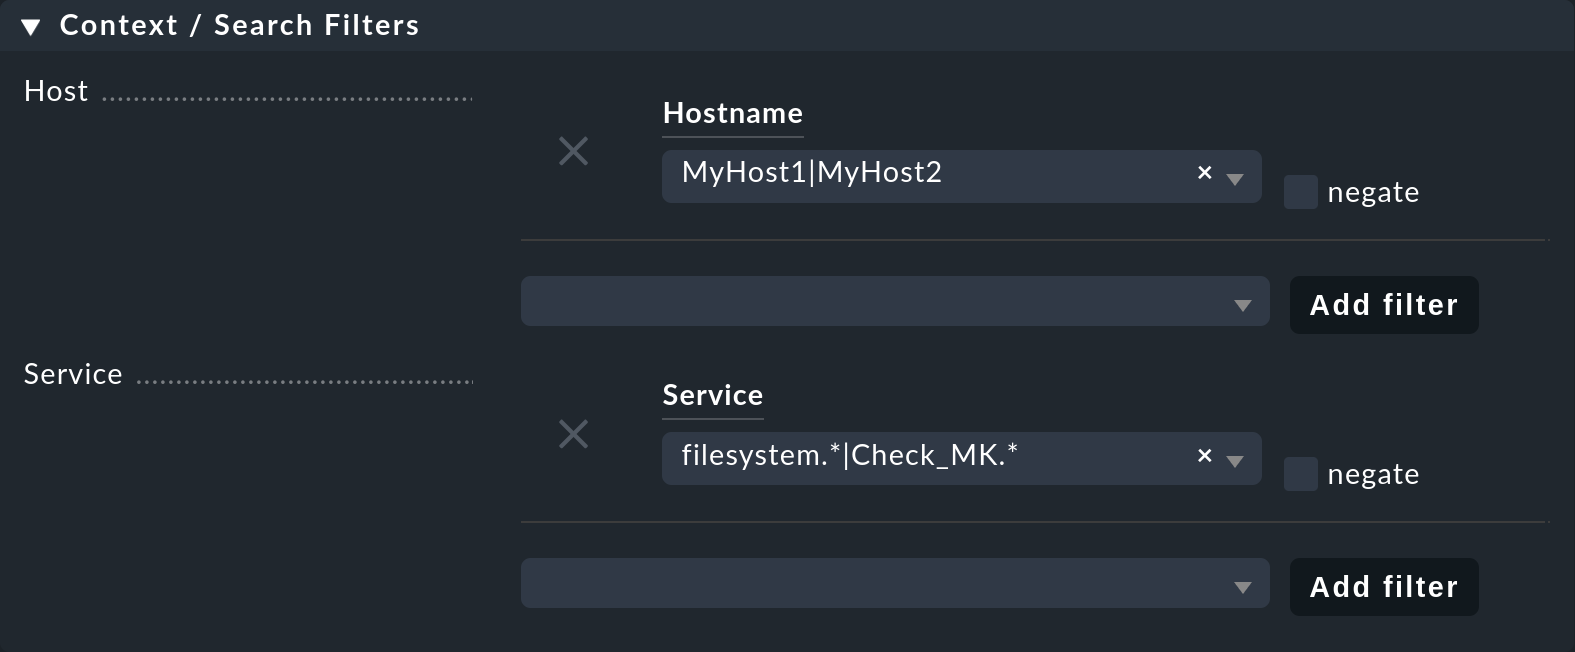
Since the view should only show the MyHost1 and MyHost2 hosts, in the last step you have to set a filter under Context / Search Filters for the Hostname: MyHost1|MyHost2.
For a slightly clearer example view you can still set a filter under Service, for example filesystem.*|Check_MK.*.
You then get the SLA-monitored file system services, and as an unmonitored counterpart the Checkmk services – in this way the results from using the service-specific SLA display will simply be clearer.
This completes the view setup. After selection in the Monitor menu as the result you will get a view with five status icons as single results from the percentage SLA, and a summary as a percentage for the outage SLA — of course only in the file system services lines, the Checkmk lines remain empty.
3. Further views
3.1. Column-specific SLA displays
The service-specific view has a disadvantage: you can indeed create multiple rules that assign the same service to different SLAs, however you can only display the SLA assigned to the first of these rules – there is no way the SLA of a second controlling rule can be displayed in a second column.
You can however easily show several columns with different fixed, specified SLAs. Such column-specific views are useful, for example, if you need multiple SLAs which should apply for all services of some or all hosts. So it could be about defining something like gold, silver and bronze SLAs, each in a separate column next to the services of a host. Then at a glance it will be clear which SLA definitions a service/host meets. In short: the column-specific view allows you to display more than just a single SLA for services.
In the example completed above, those three steps mentioned at the beginning were executed — create an SLA, bind it to a service, install it in a view. For column-specific views you can just leave out the second step. Create only the SLA, and arrange a view with the Hosts/Services: SLA - Column specific column. The SLA results will then be displayed in each line independently of the respective service.
The following image shows the above SLA view for MyHost1 with an additional column showing SLA results (maximum three outages of Checkmk services) for each service:

The difference between service and column-specific displays is thus clearly visible. What should also become clear: the SLA designed specifically for Checkmk services of course makes only moderate sense in the file system columns. It is therefore worth planning this thoroughly before beginning an implementation!
One more small note: In the options for the service-specific views, above under Generic plugin display options we have seen the settings for outage and percentage SLAs. In the options for the column-specific views you can see these two as well — but only if the SLA actually includes outage and percentage criteria. Here generic is not appropriate, but static, a fixed SLA definition is invoked. Only the options that belong to this SLA will be seen.
There are many ways to bring SLAs, services and views together — here good planning is required for what precisely you want to display via SLAs.
3.2. The SLA detail page
Integrating the SLA information into tables provides a fast overview, but of course you can also consider the results in detail. In a view, a click on the cell with the SLA data takes you directly to the detail page of the SLA results for the affected service:
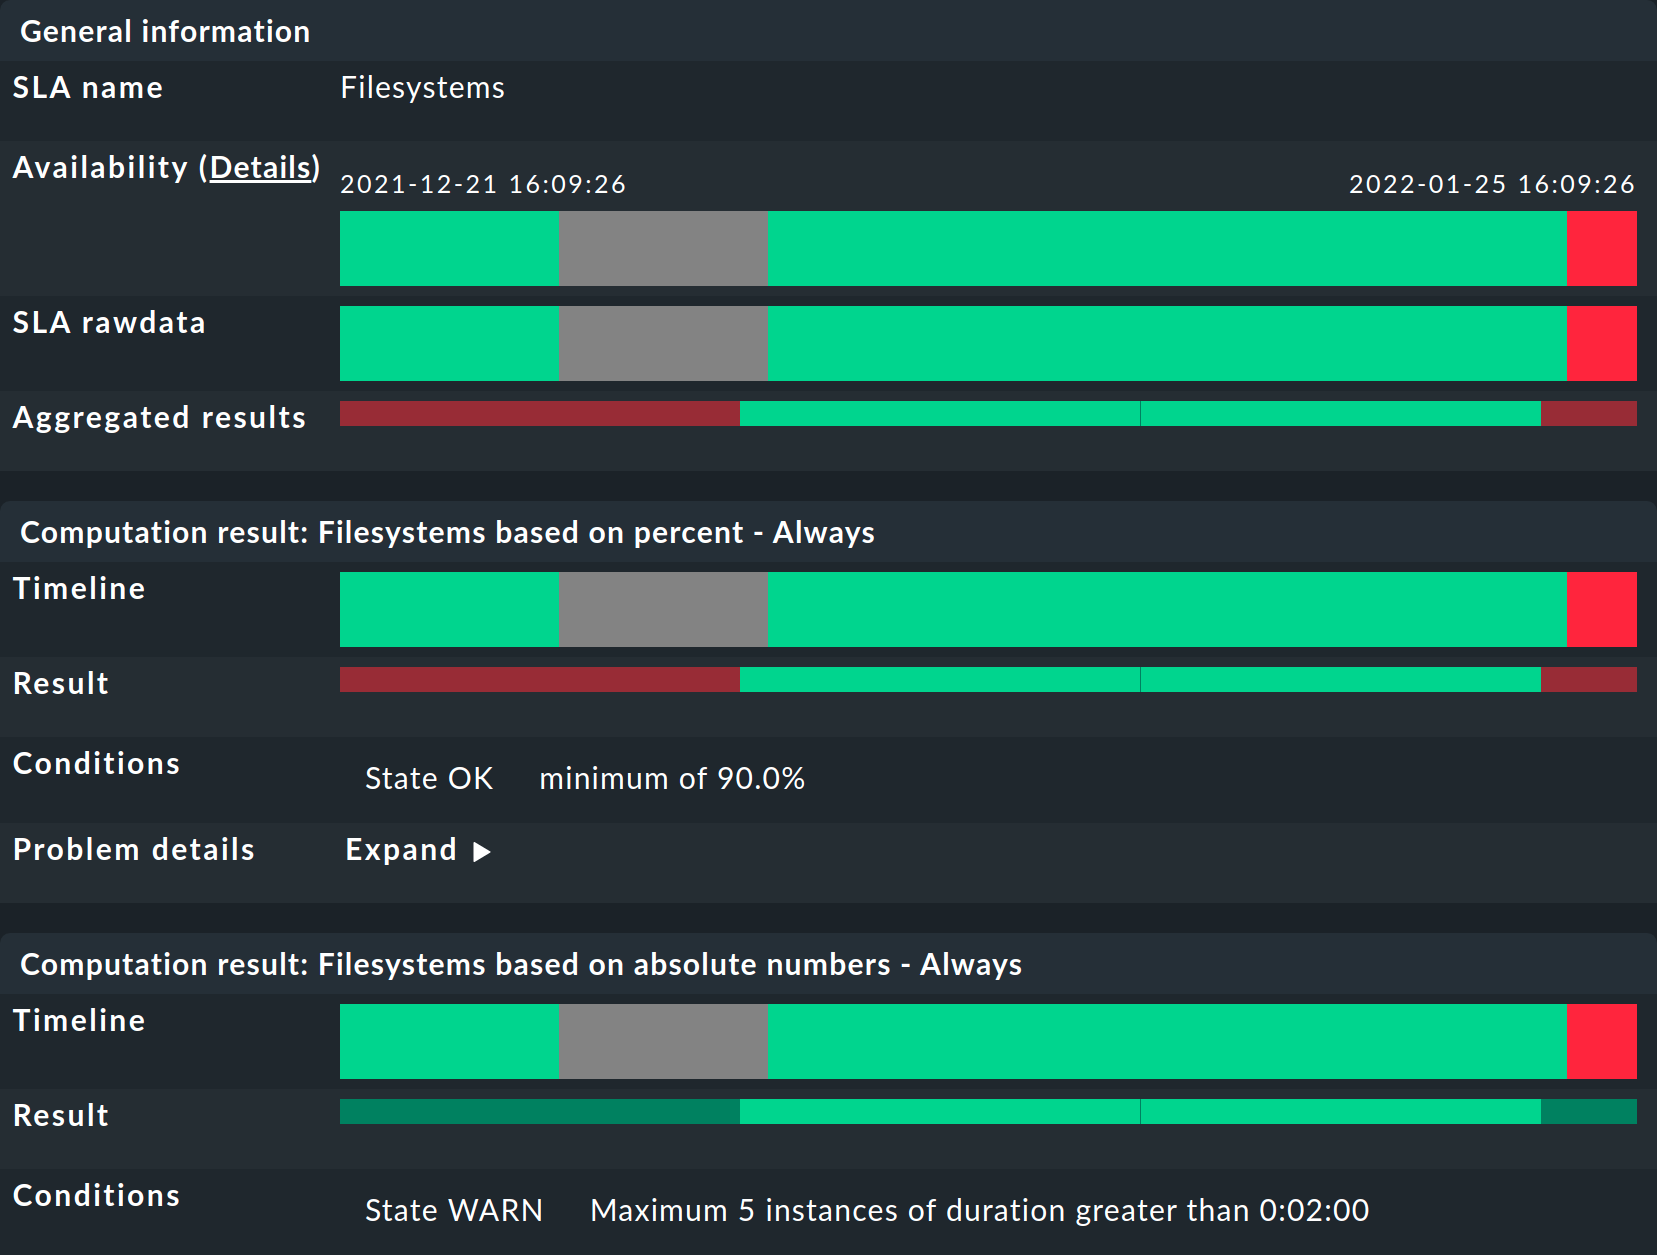
Here four different types of information can be found:
raw data of the availability,
a summary of all of the requirements of an SLA,
individual results of all of the requirements of an SLA and
the SLA specification.
General information: Here you can see the raw availability data, and thus the SLA calculations as an overview of the status for each period, and below it the aggregated results of the SLA’s requirements.
This is followed by tables for each individual SLA requirement. The Timeline shows every single state and the Result row shows the results for each individual reporting period. A special feature here: If you, as described in the example, have set SLA levels and the SLA goes to CRIT before breaking, this will be indicated here by an orange bar and not the usual red bar. The bars will then turn red when the SLA breaks. Once you get that, move the mouse pointer to the result bar where, via a tooltip, you will be able to see the individual events that are responsible for the status. In the following picture the status is WARN – because only two out of the three permitted outages remain:

The message SLA broken would also appear in this tooltip.
A small note about using the view: If you move the mouse over the result bar Aggregated results or Result of a period, this period will be highlighted — for all individual requirements as well as the summary under General information. With a click you can select/deselect one or more periods.
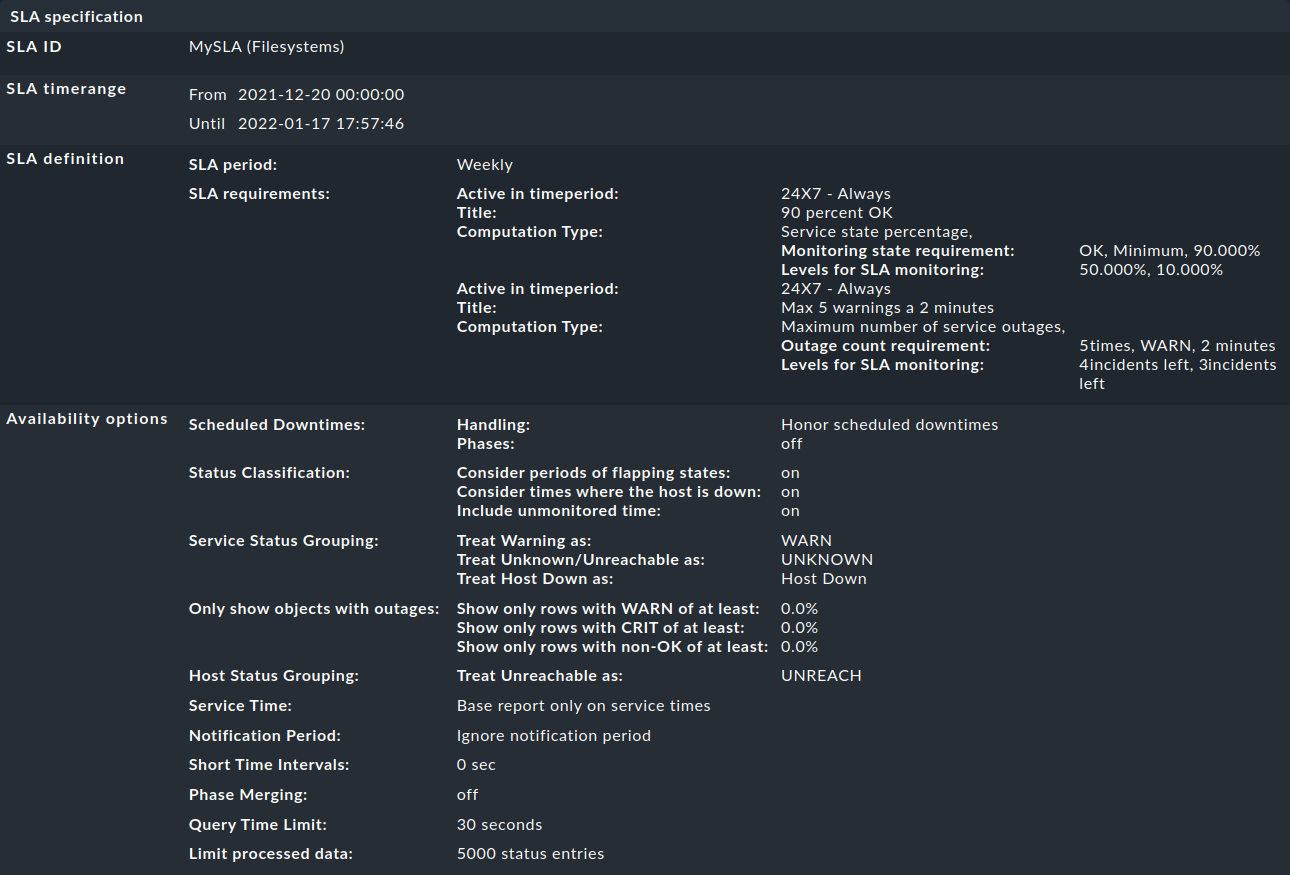
Finally, under SLA specification, the configuration data for your SLA follows, which will help you to better evaluate and understand the results presented:
3.3. SLAs for BI aggregations
In the availability article you’ve already read about using the availability for BI aggregations. The SLAs are also available to the aggregations (the top level) – via a small detour: The state of a BI aggregation can be monitored via the Check State of BI Aggregation rule set as a normal service. This then appears, for example, as Aggr My Bi Rule Top Level in the views and can in turn be associated to an SLA via the Assign SLA definition to service rule already used above. As a result, it will look something like this:

You will find this rule under Setup > Services > Other services > Check State of BI Aggregation and a description of the rule set in the BI article. The rule is also designed to query BI aggregates on remote Checkmk servers. For this you will need to connect the URL to the server and specify an automation user — and of course the desired BI aggregation: In the Aggregation Name field, enter the title of a top-level rule from your BI package, in the following example the rule with the My BI Rule Top Level title:

Note: There is a risk of confusion here: In the BI configuration, you create the actual aggregation, i.e. the logic, via rules — and in this example one of the top-level rules is entered via its title as Aggregation Name.
4. Error handling
4.1. Incorrect or no functionality
In practice SLAs are an interplay of many different configurations: the SLA itself, the view and service options, time periods, rules and of course availability data. If the SLA shows different results to those expected, just go through the complete chain. In case of doubt it also helps to visualize the entire process with pen and paper — to see all of the information involved at a glance. The following points can be used as a basic checklist:
Time periods: Setup > General > Time periods
Scheduled downtimes: Setup > Hosts > Host monitoring rules > Recurring downtimes for hosts and Setup > Services > Service monitoring rules > Recurring downtimes for services (both rules only in the
Checkmk Enterprise Editions)
Service periods: Setup > Hosts > Host monitoring rules > Service period for hosts and Setup > Services > Service monitoring rules > Service period for services
Service configuration: Setup > Services > Service monitoring rules > MyService
SLA configuration: Customize > Business reporting > Service Level Agreements
SLA service link: Setup > Services > Service monitoring rules > Assign SLA definition to service
View configuration: Customize > Visualization > Views
BI configuration: Setup > Business Intelligence > Business Intelligence > MyBiPack > MyTopLevelRule
BI monitoring: Setup > Services > Other services > Check State of BI Aggregation
After you have checked the configurations, you can verify the functioning of the SLA using manual (fake) status changes and scheduled downtimes by applying commands to the objects in a view.
4.2. An SLA is not shown
In such a case, open the settings for the affected view and first check the obvious: Is there even a column with an SLA? Contradictory filters are however a more likely cause: If you have tied the SLA to a service using a rule, this service of course may not be excluded from the view options under Context / Search Filters.
Service-bound SLAs still have one more source of error: As described above, you can display only one rule-linked SLA for each service in a view — that of the first matching rule. Finally, the view receives only the instruction to display in each line the SLA associated with the service – not the second or fifth connected SLA. If you have created corresponding rules, they will simply be ignored. In such cases, you can switch to the column-specific display.
4.3. An SLA status change is not shown
In its simplest form, an SLA status only changes in the GUI views when its requirements are broken. To be informed of a status change beforehand, you must configure the SLA levels.
