1. Introduction
The most important task performed by Checkmk’s user interface is displaying the current status of hosts and services. This is achieved largely with views in a table format. In order for the daily operations to run as efficiently as possible, these tabular views provide numerous functions, and they can be customised to meet your requirements.
1.1. Global and context views
We distinguish between global views and those that require a context. Global views can always be called-up directly. An example of a global view is the list of all current service problems. A context view — the Status of Host … view for example — namely needs to specify by name the host whose status is to be displayed. Such views can only be called-up in situations relevant to a particular host.
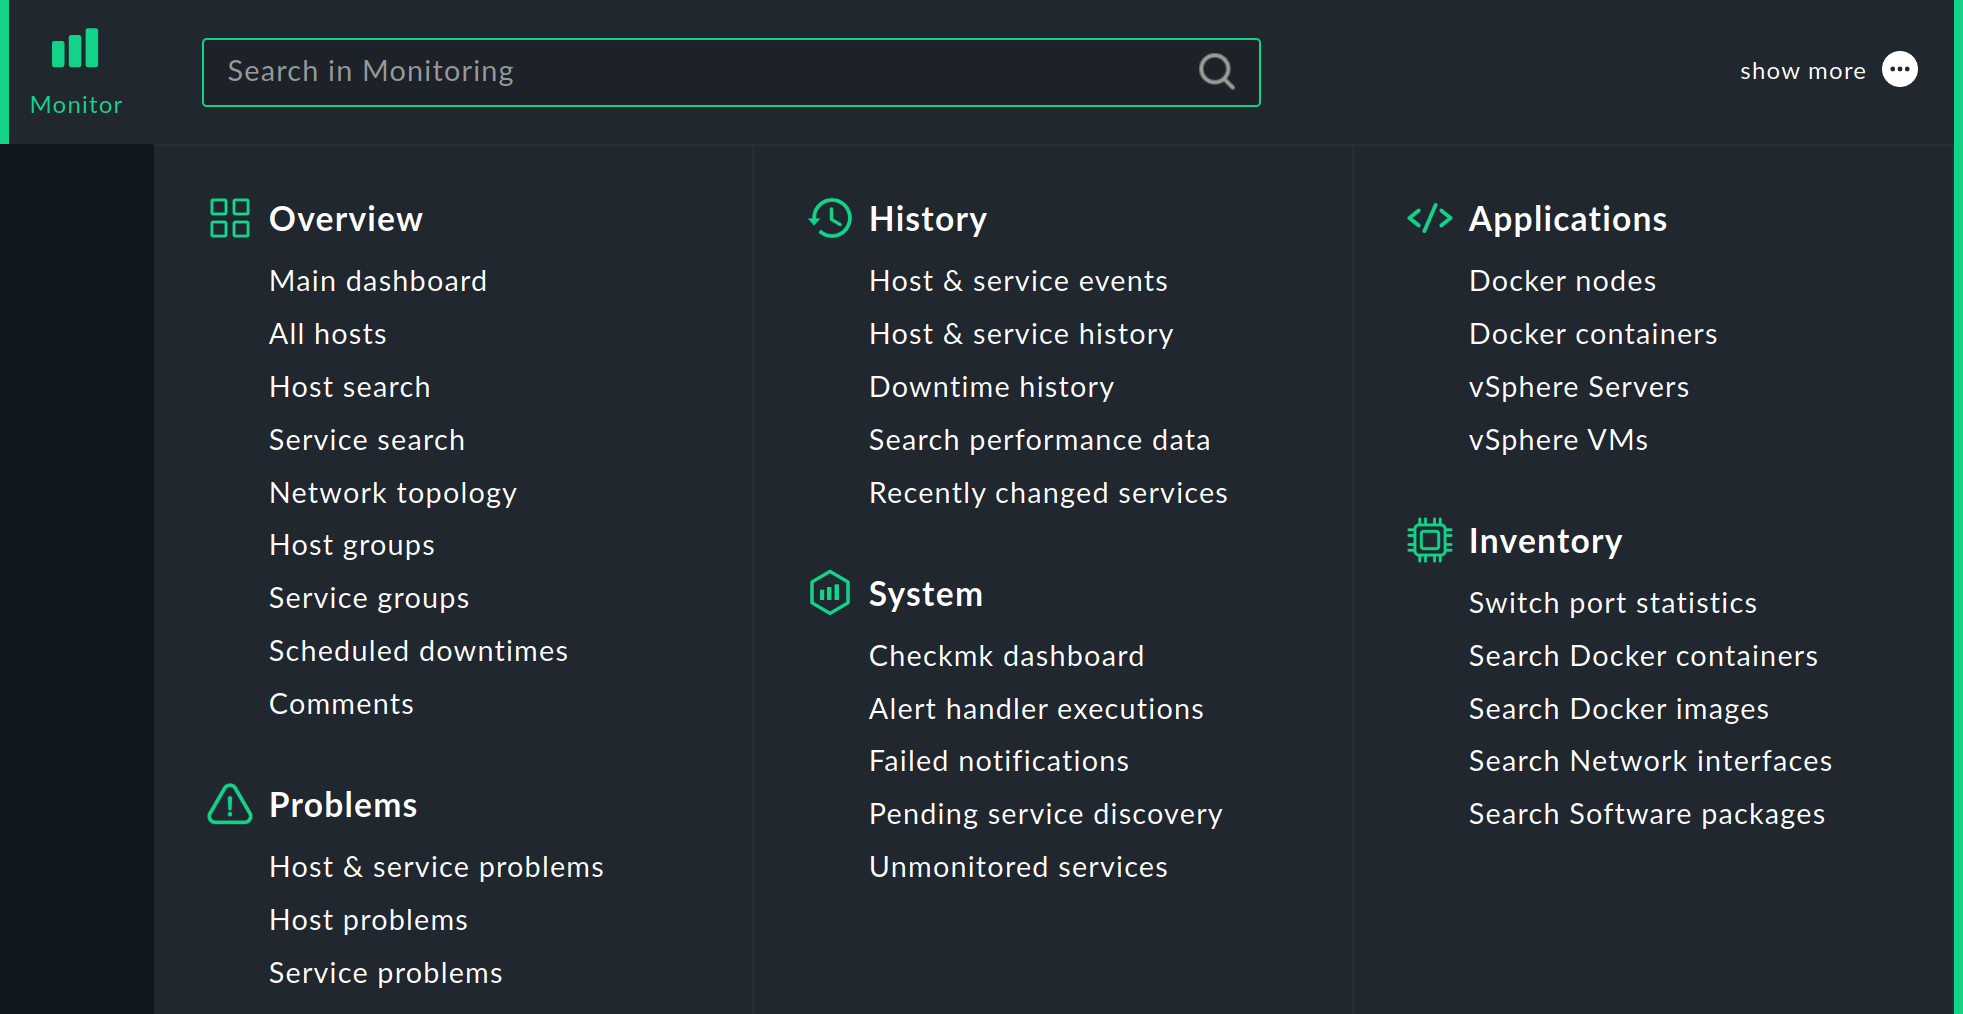
The global view is most easily accessed via the monitor menu.
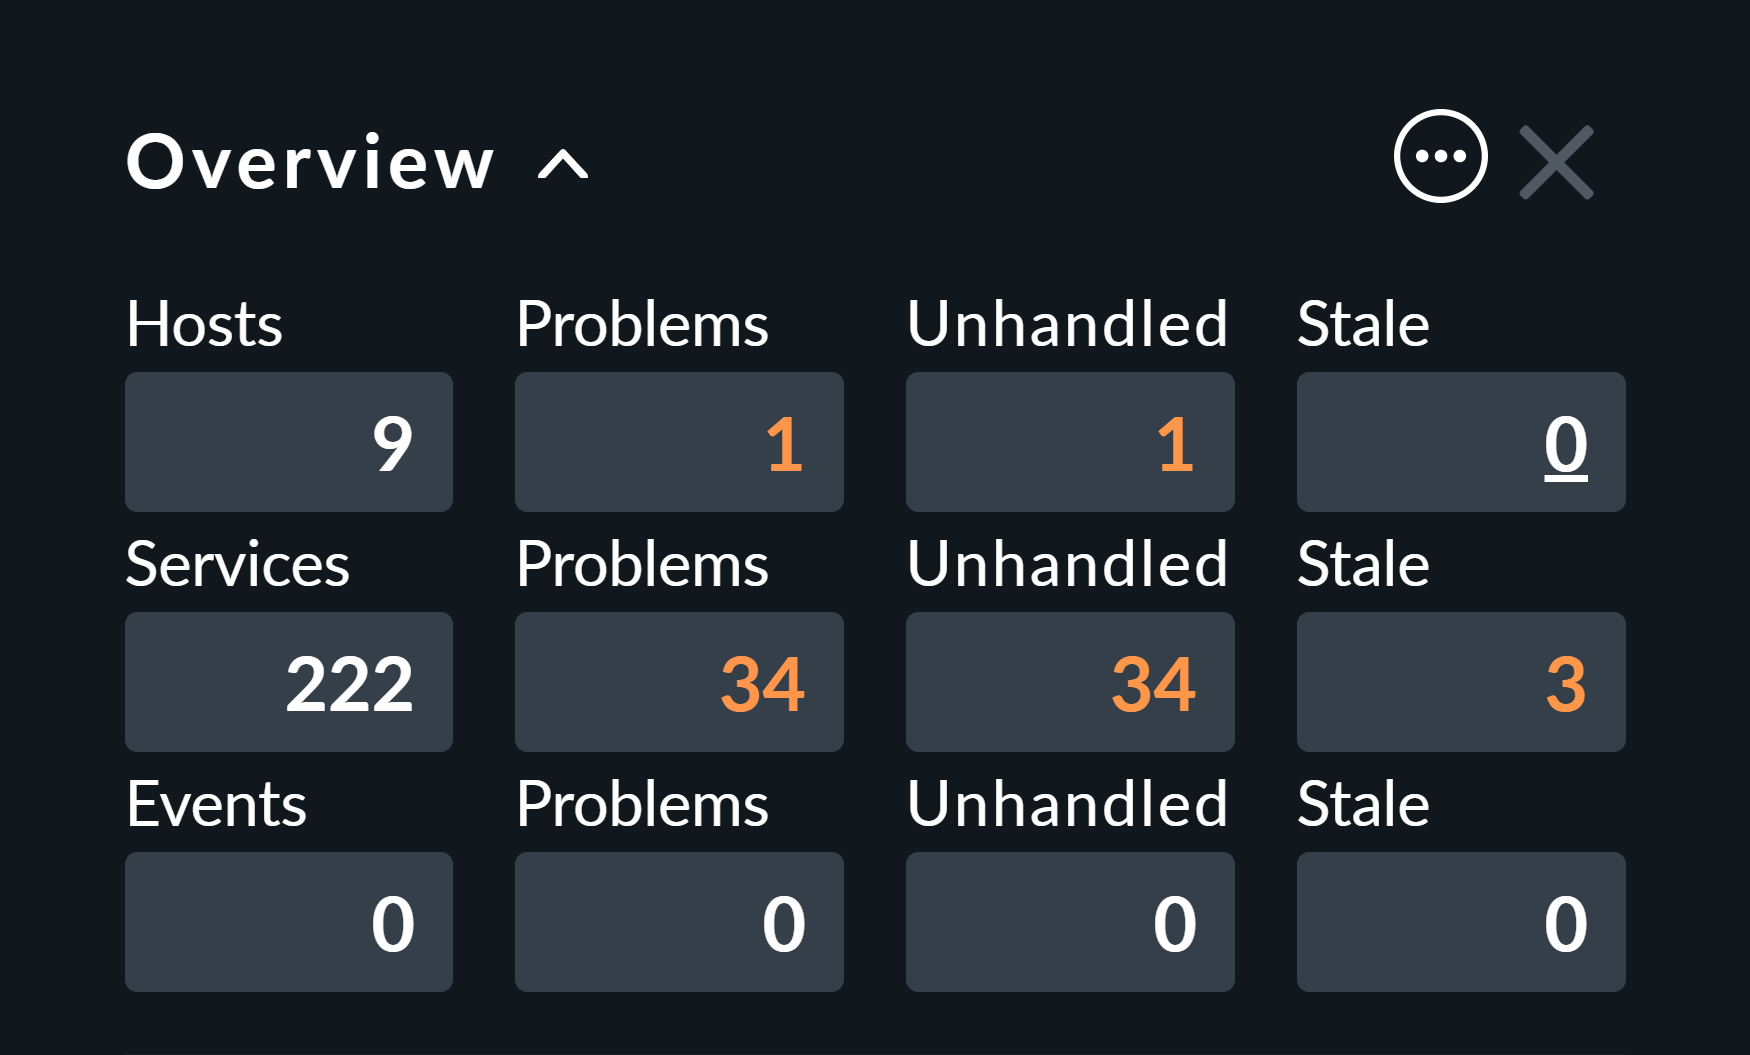
Alternatively, you can use the Overview and Views sidebar elements. In the overview each number is clickable and takes you to a global view that individually lists the hosts or services counted in each case.
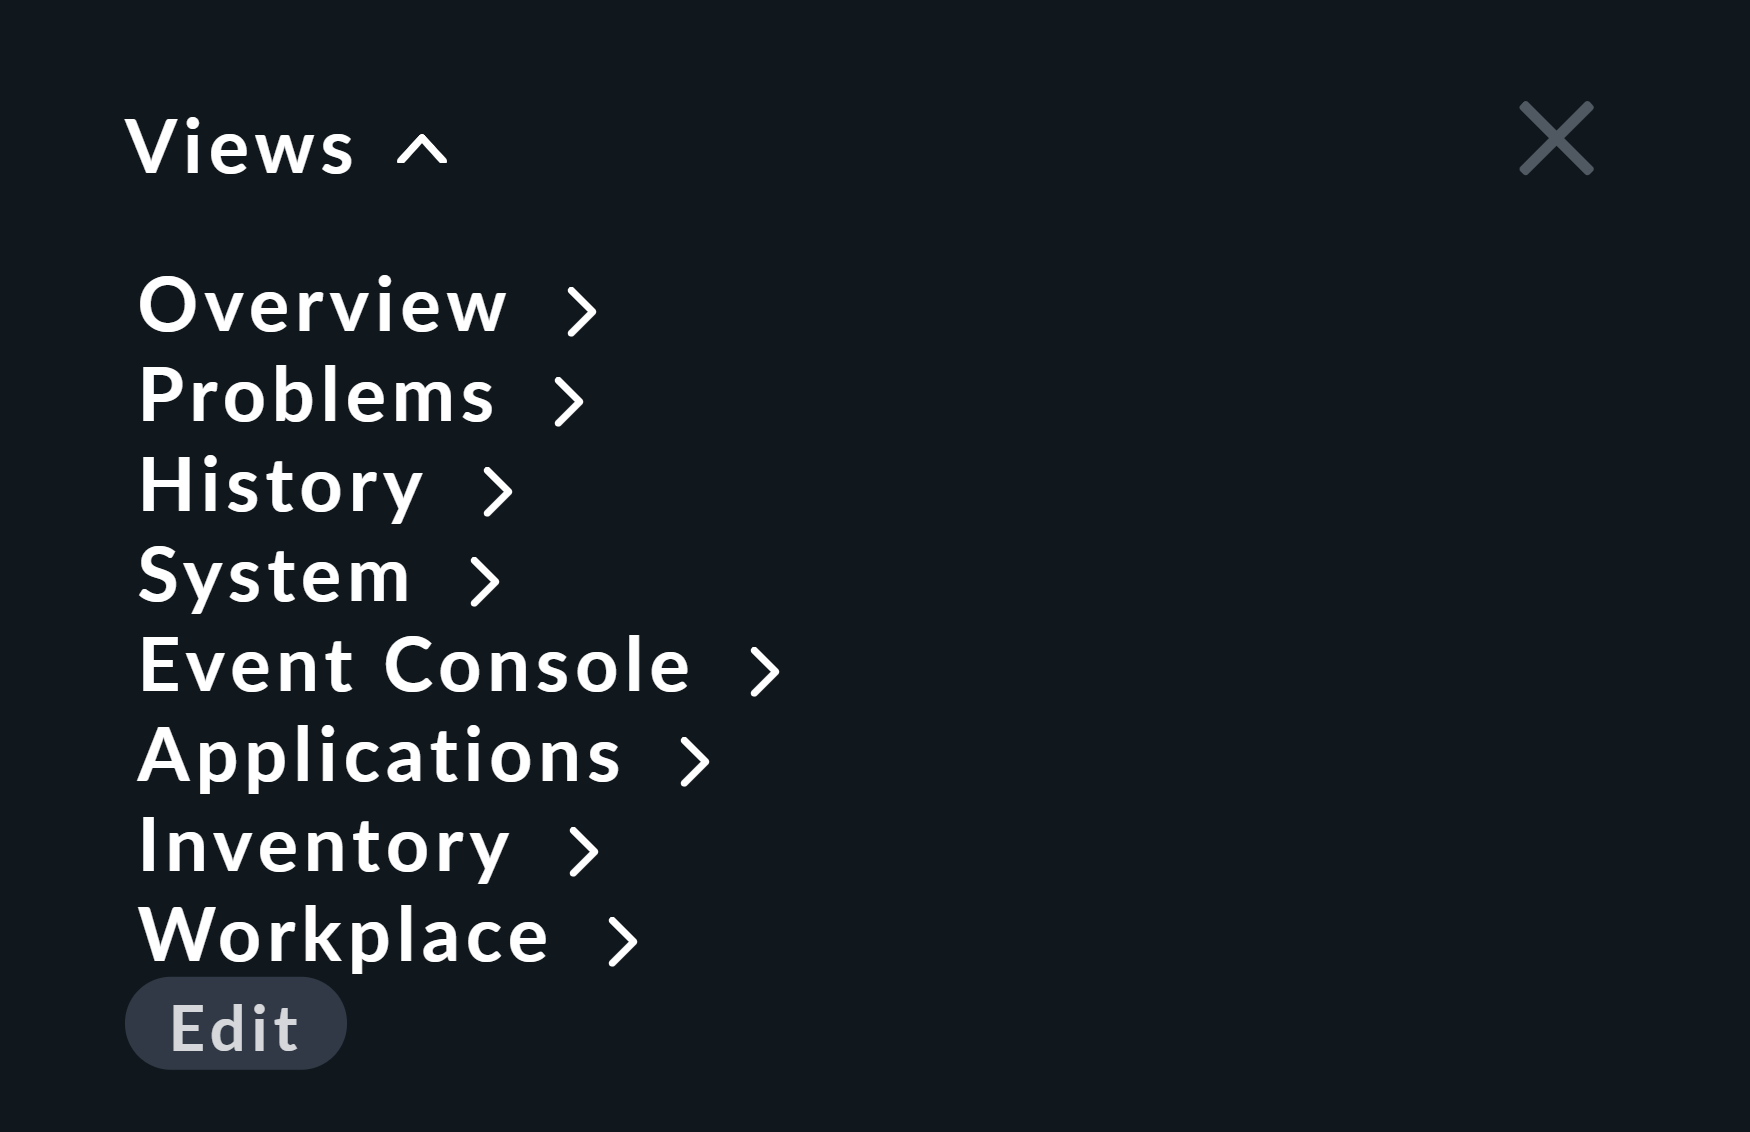
All global views are accessible in the Views element — grouped according to theme. In addition you will find a few entries that aren’t actually Views — such as for example, the Dashboards, which are sorted under the Overview theme. Dashboards can however contain views.
From a global view, with a further step you can access the details for a particular host or service. The names of hosts and services and the individual cells in other columns are clickable …
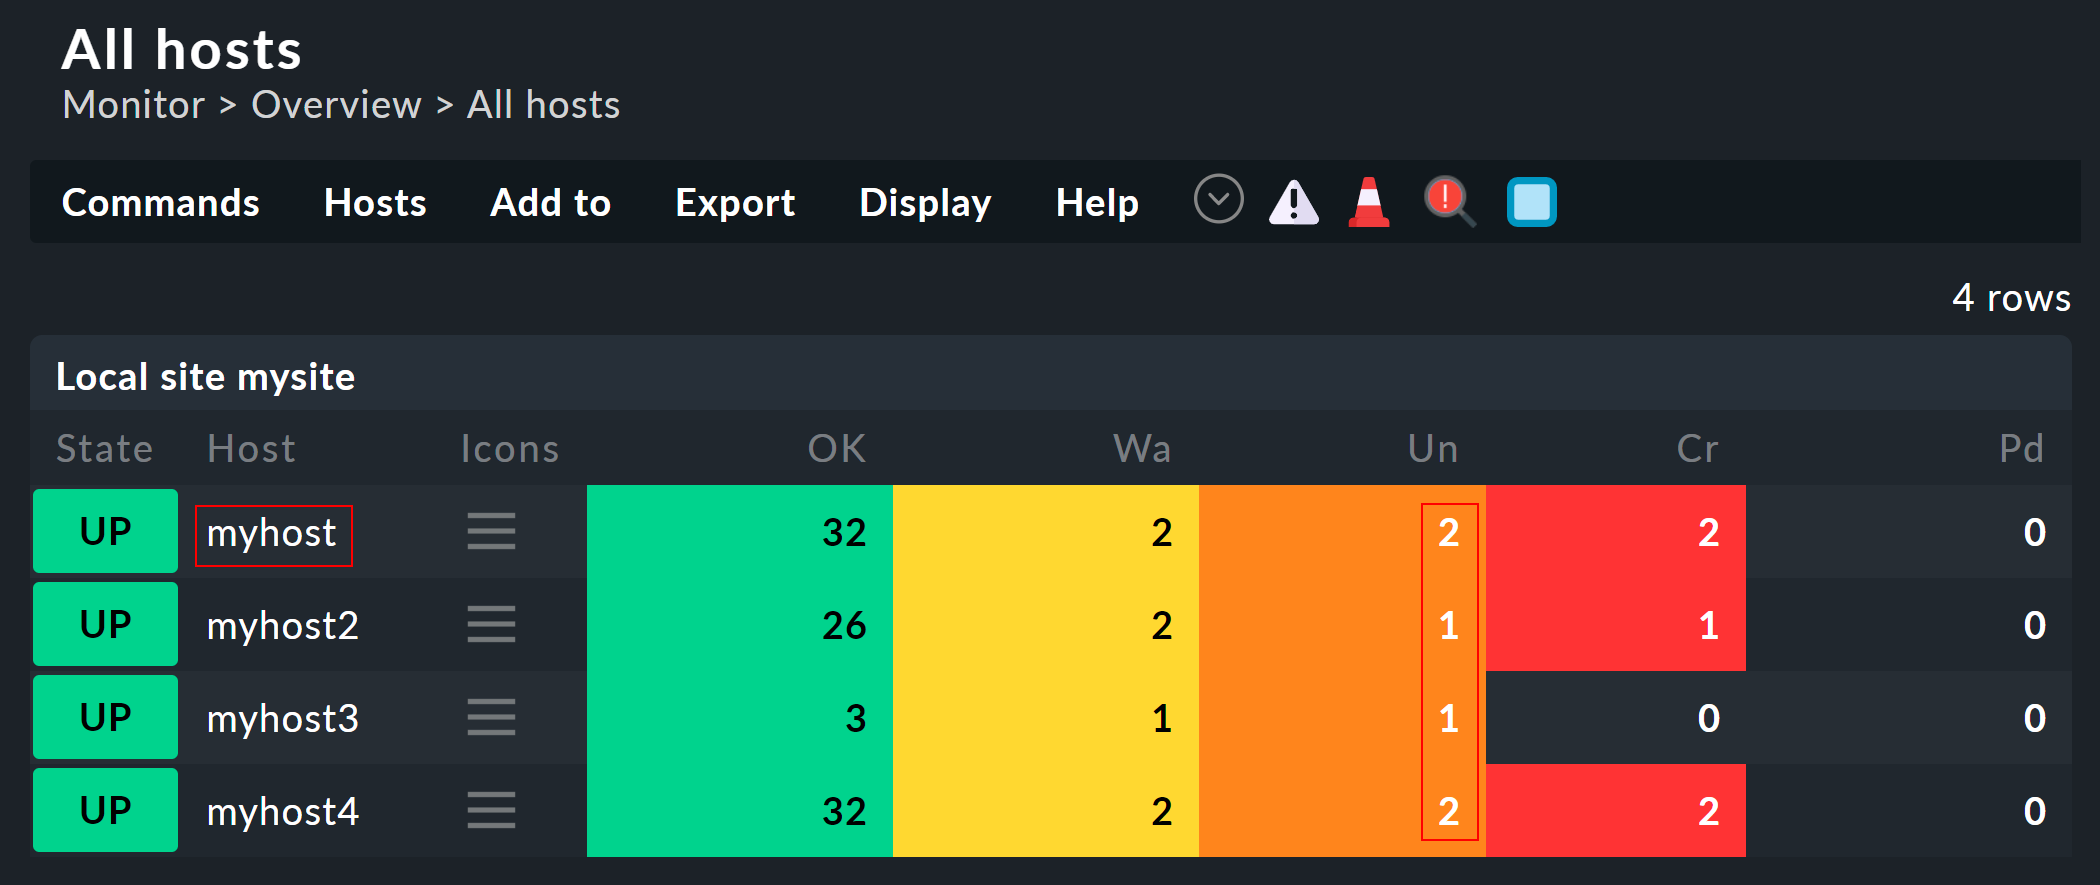
… and bring you to a more detailed (context-dependent) view.
Context-dependent views
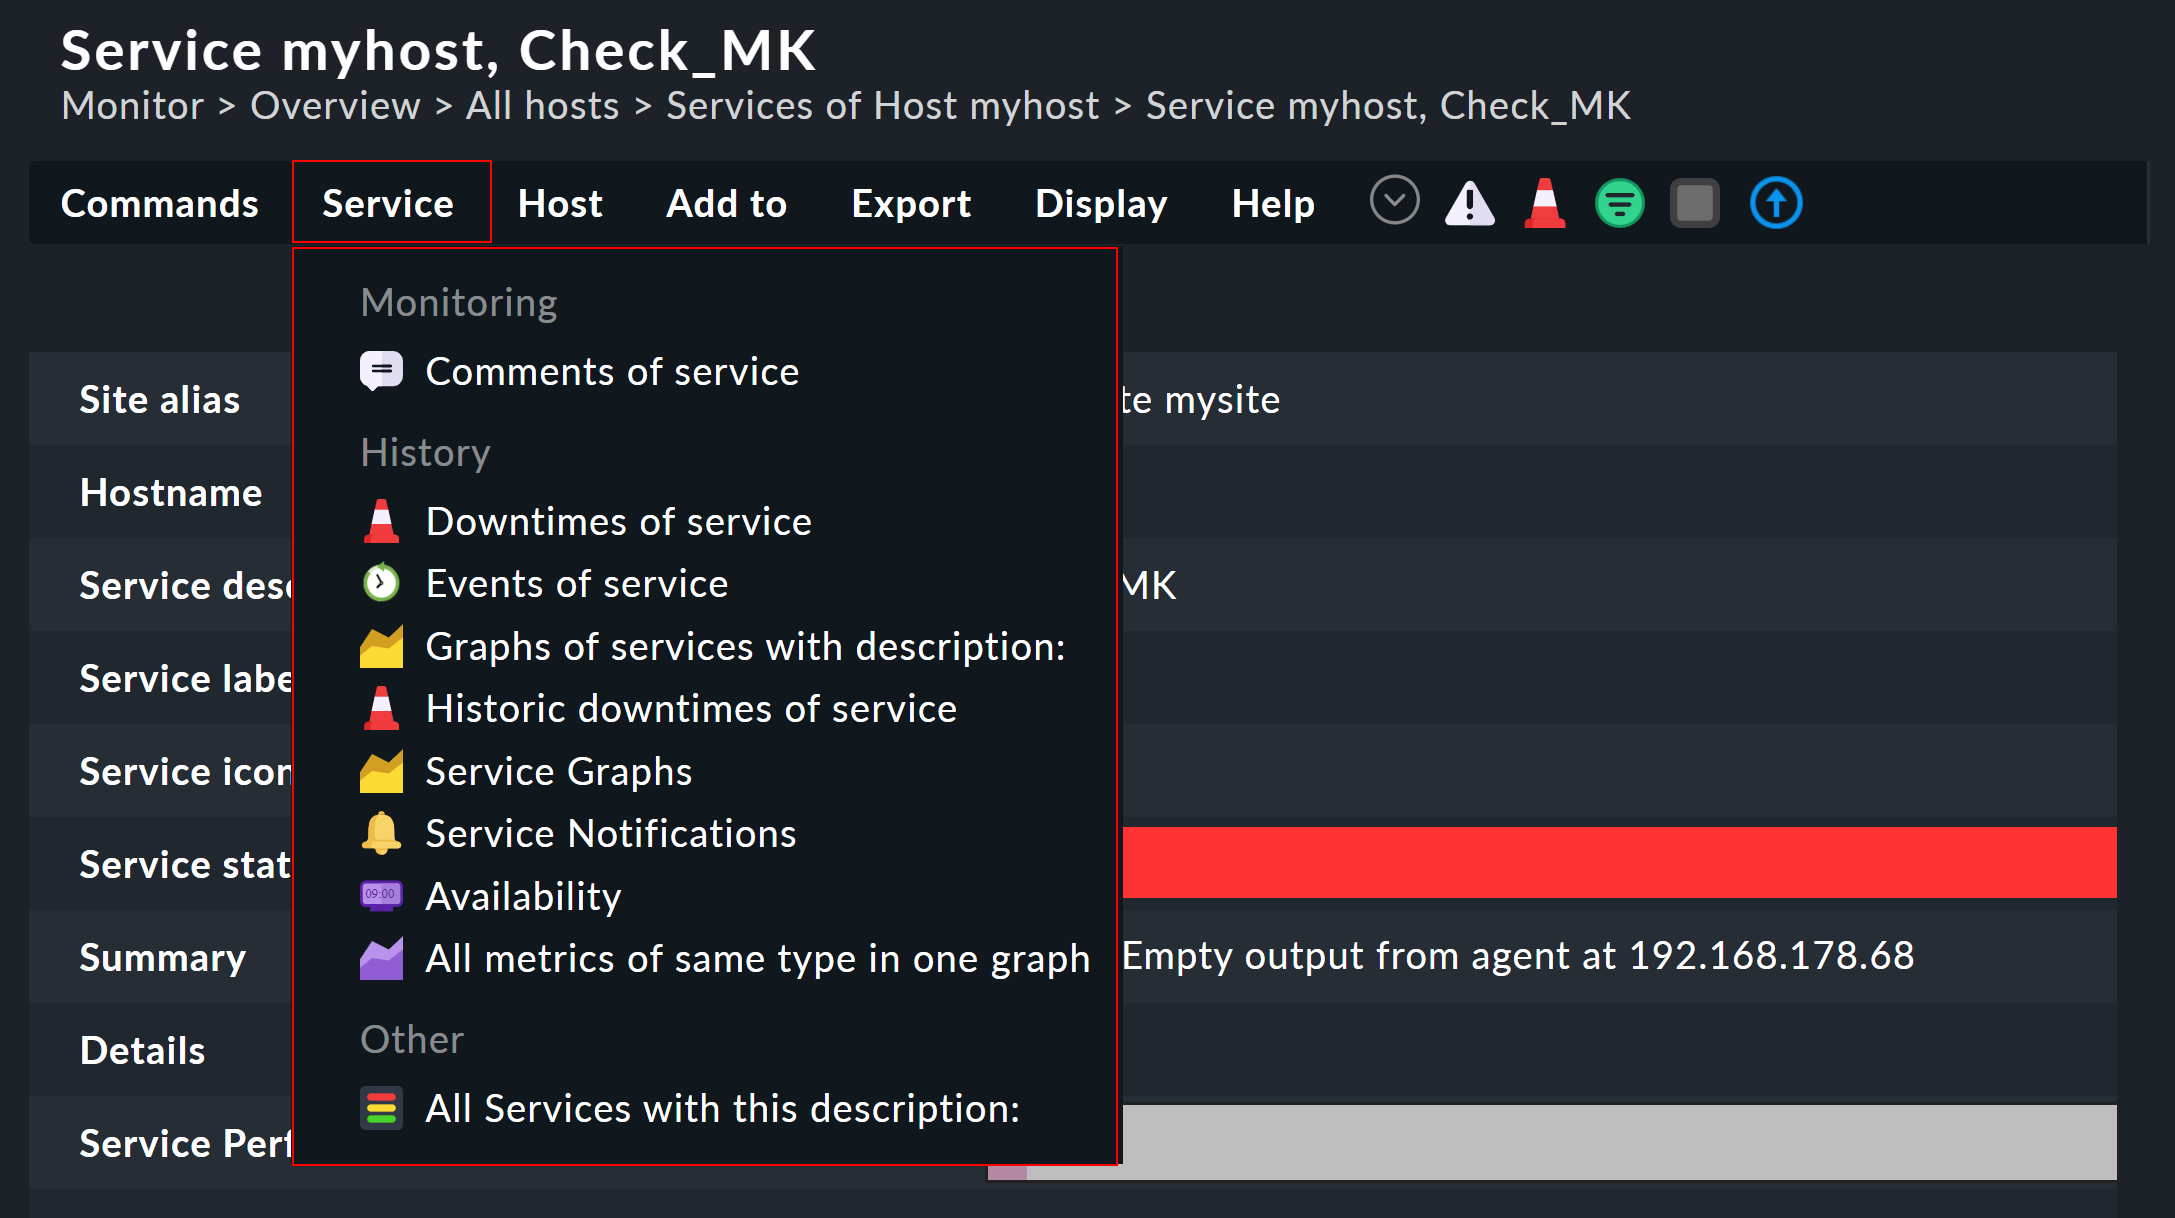
In views that relate to a specific host or service, you will find all sorts of entries in the menu Host or respectively Service, which will then take you to other views with the same context — i.e. for the same host or service.
You can also access host- and service-specific views by searching within the Monitor menu:
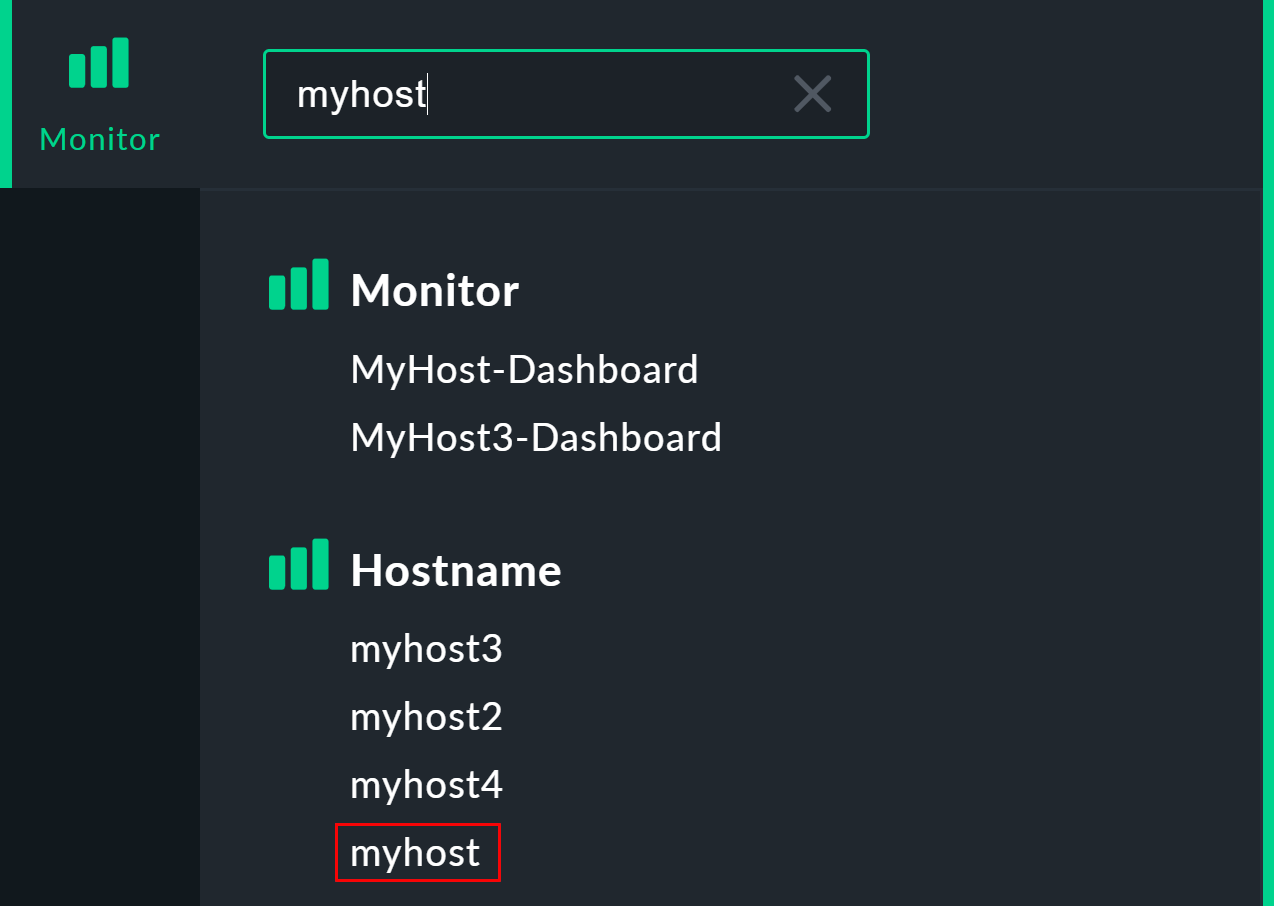
Another way to the detailed view is via the Quicksearch snapin in the sidebar:

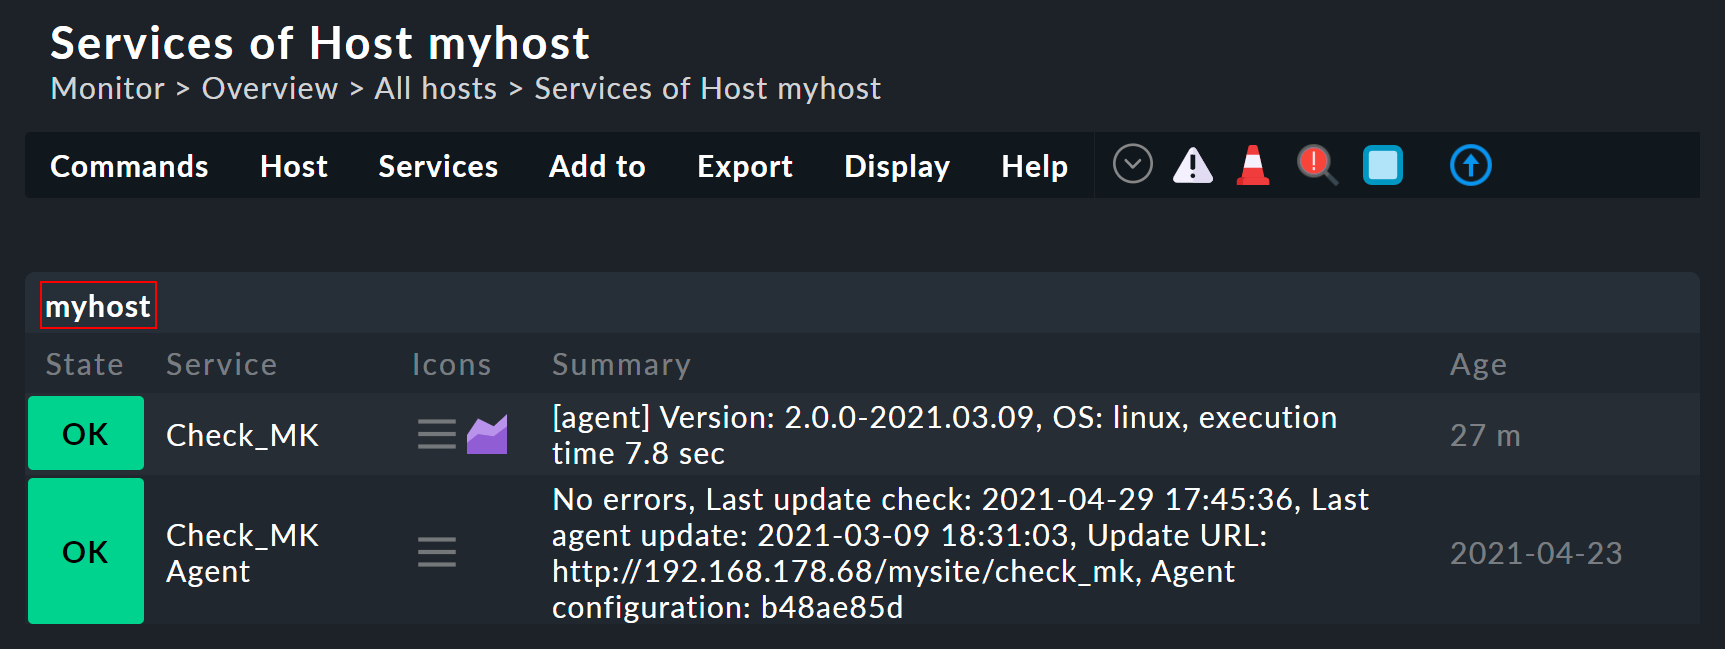
Which view you receive will depend on the result of the search. If the search identifies a host explicitly, you will reach this host’s Services of host … page directly. There you will again find the menu items for the other views of this same host. A click on the host’s name takes you to the Status of Host view.
Effect in the menu bar
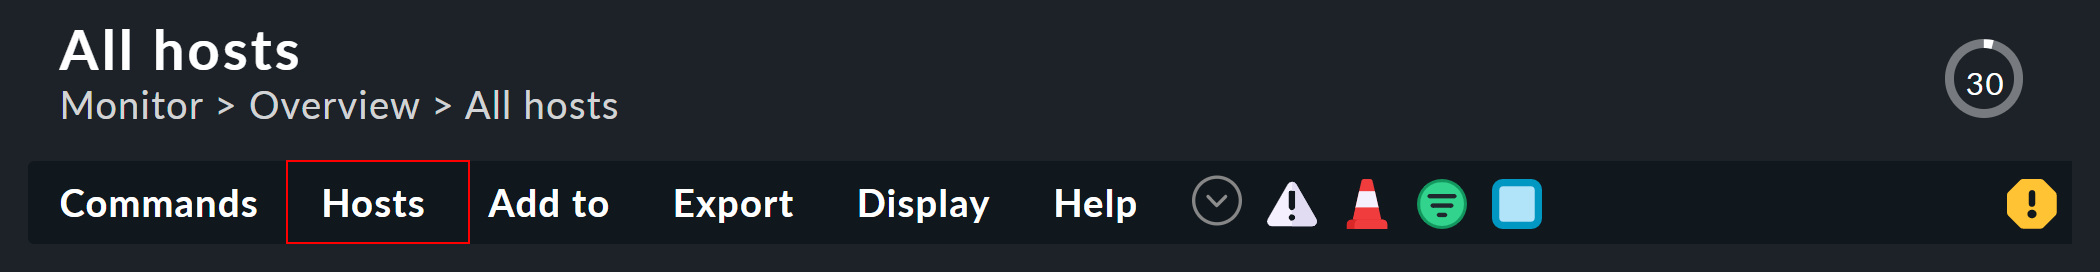
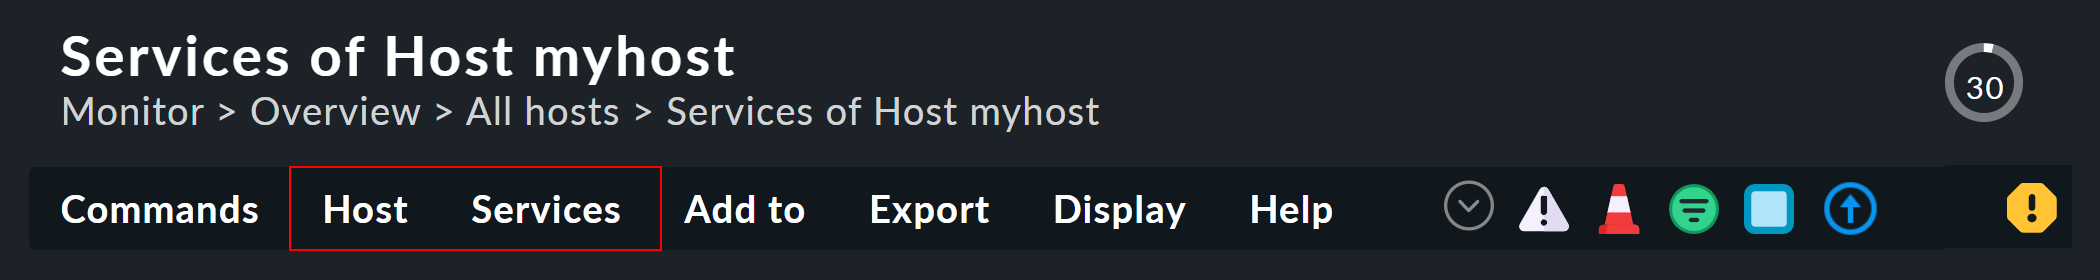
In global host views there is also the item Hosts as well as in global service views Services — note the plural here! You can use this, for example, to call up the availability of all hosts or services of the current view.
Views of a single host, on the other hand, contain the menu items Host and Services with all actions for the current host and all services for the current view.
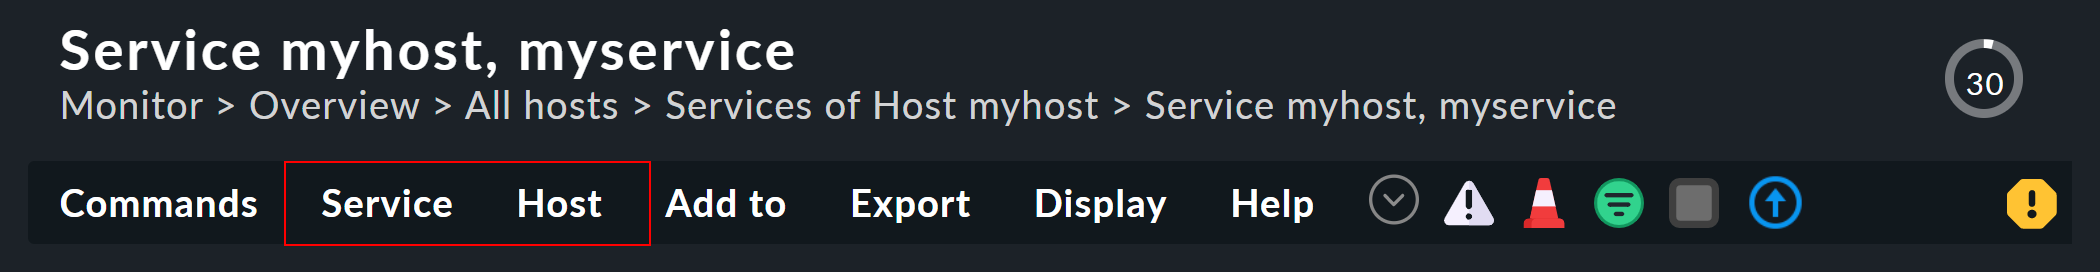
Views of a single service likewise contain the entry Host, but additionally, now in the singular, the entry Service, with actions for this one service.
2. Using views
2.1. Options, filters and commands
At the top left of every view there are six symbols with which you can influence the display, and trigger actions:
| Menu item | Function |
|---|---|
Commands |
Here you can execute commands to the object shown (e.g., entering scheduled downtimes). The commands are described in detail in their own article. |
Display > Filter |
Opens the dialogue with the filters. With this you can further restrict the displayed data. As soon as you set a filter the symbol on |
Display > Show checkboxes |
With this you switch checkboxes on or off. Using the checkboxes you can restrict the commands to selected data sets. |
Display > Modify display options > Number of columns |
Defines the number of columns for the selected view. Views with multiple columns allow the space available on wider monitors to be fully-utilised. For views that only display a single data set this setting has no effect. |
Display > Modify display options > Refresh interval |
Defines the view’s refresh interval. You can also disable the automatic refreshing. Be aware that in this case it is possible that you will not be informed of problems that occur in the meantime! |
Display > Modify display options > Date format |
Change the format for the date display. |
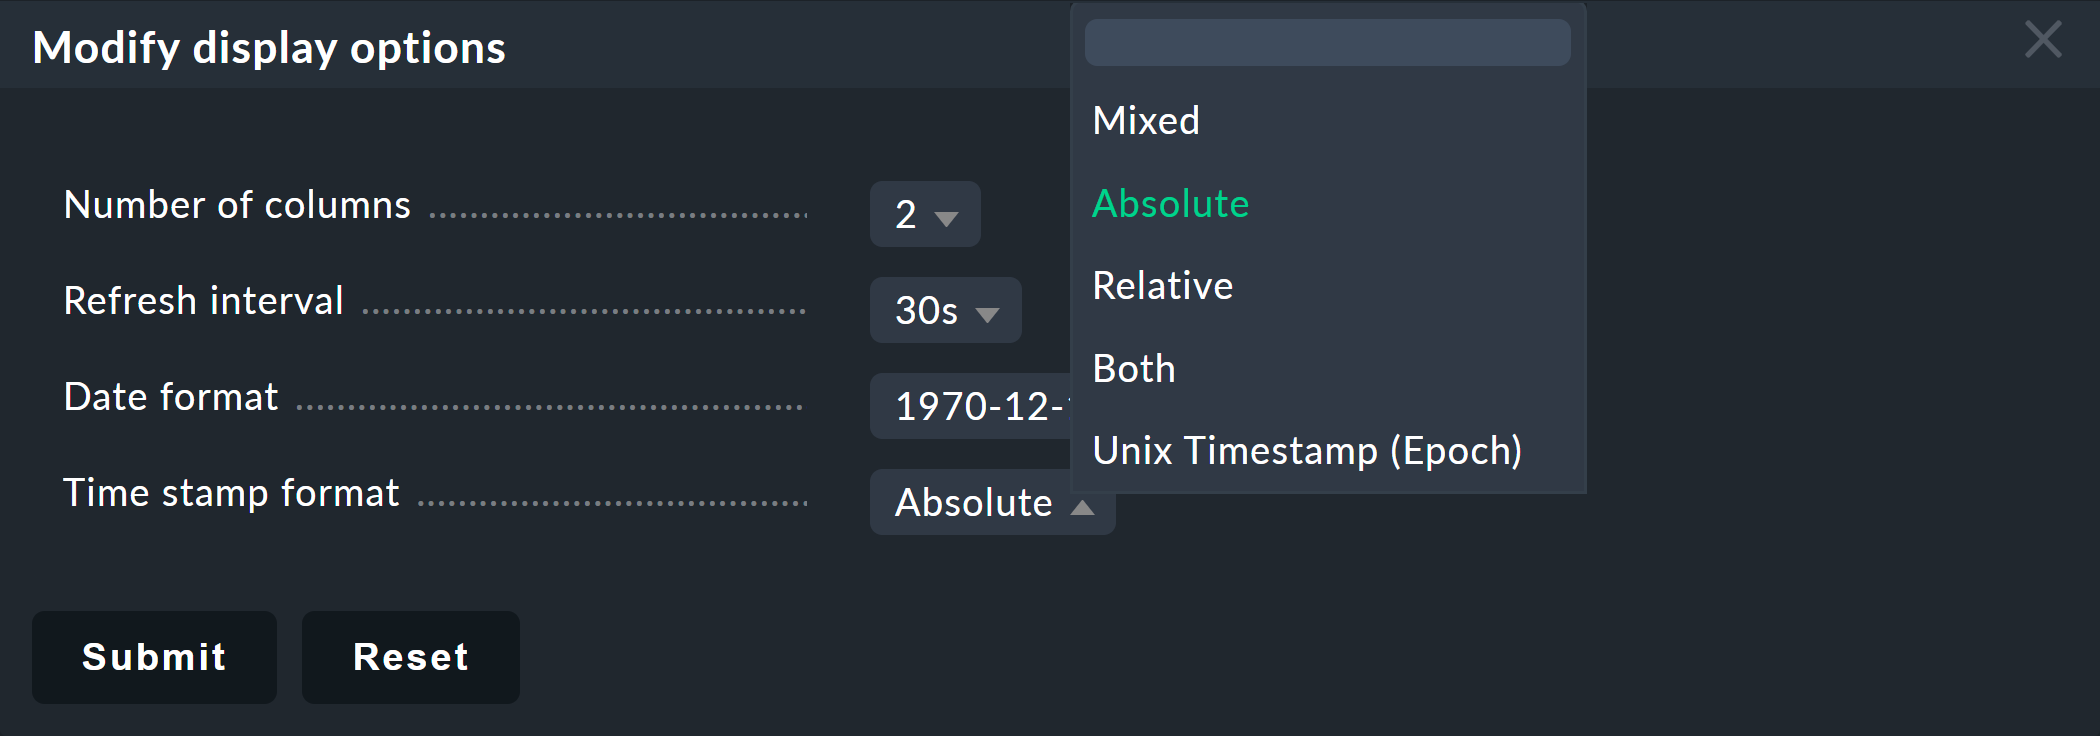
Display > Modify display options > Time stamp format |
Timestamps can be displayed as absolute, relative, mixed, in combination or as a Unix time stamp. |
2.2. Time and Date
Checkmk shows time stamps as relative values in all of the views of states if these are less than 24 hours in the past or future — e.g., 16 hours. You can switch this in the menu via Display > Modify display options and choose between displaying only absolute, only relative or both values, or also the Unix timestamp. You can also specify the date format in this dialog.
2.3. Sorting
The tabular views can be sorted by clicking on a column’s heading. A column has three states that can be selected through a loop of multiple clicks:
sorted in ascending order
sorted in descending order
column unsorted
Views are initially sorted ‘naturally’ according to how the view is defined. In service lists the sorting is alphabetic by service name — with the exception of Check_MK services which are always at the top. The Check_MK service is responsible for managing the monitoring agent. There are also the Check_MK Discovery and Check_MK HW/SW Inventory services. In order to sort such a list by the current state of the services a click on STATE will suffice.
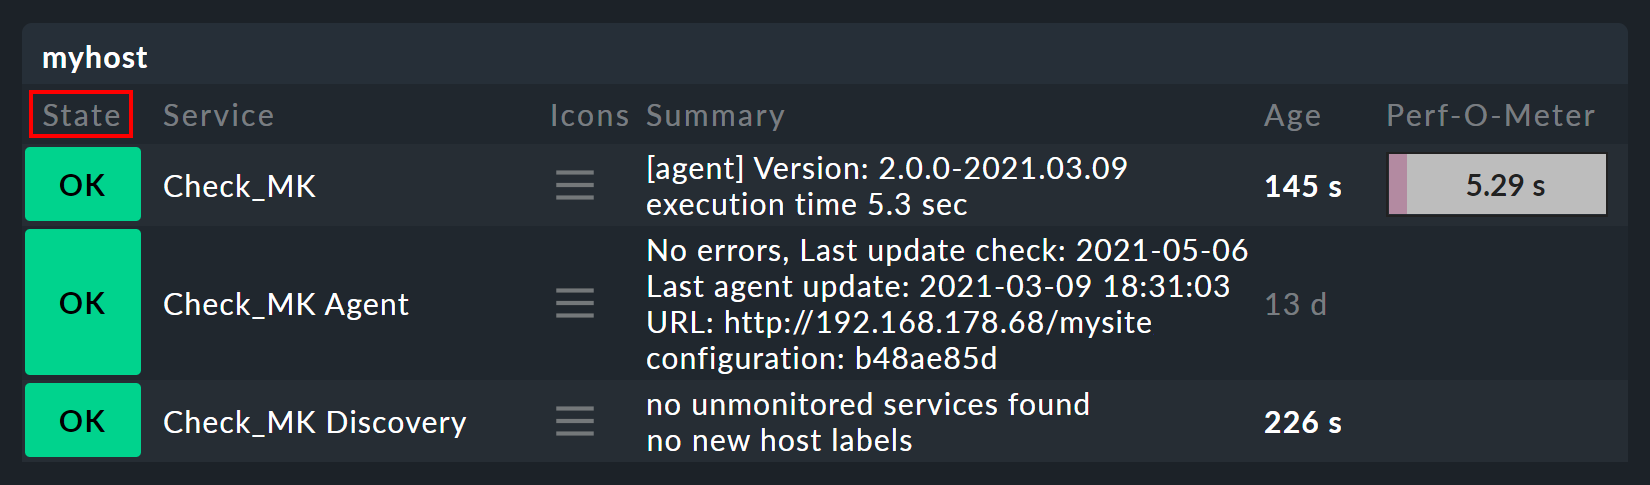
Sorting by the Perf-O-Meter column sometimes produces surprising results. This is due to the graphic display of the values being partly a percentaged summarisation of the actual values. The sorting is however performed according to absolute values, and is always based on the first metric produced by a service.
2.4. Exporting
Data displayed in a view can be exported a number of formats:
| Menu item | Action |
|---|---|
Data > Export CSV |
A semicolon is used as a separator. The individual cells are enclosed in quotes. The first line contains the internal abreviations for each column. |
Data > Export JSON |
For an export in JSON-format, the cells also end up in quotes, separated by breaks and commas, enclosed by square brackets. |
Reports > This view as PDF |
Only in Enterprise Editions: This creates a so-called Instant-Report, which converts the current table view into a PDF document, minus icons, navigation and so on. Its layout can be customised with special templates in the report module. |
Reports > Various |
Depending on the current table view, further PDF exports are offered, e.g. for availability, as well as individually-created report templates, if available. |
REST API > Query host/service resource |
Output of the REST API for host/service selection of the current (filtered) table view. |
2.5. The display limit
In a larger monitoring environment displaying all views is no longer practical. When you are monitoring 50,000 services and select the All Services view, not only will the display require a very long time — it will also not be very useful.
In such situations, in order to protect the user from long waiting times and to avoid crippling the system with absurd quantities of data, views are limited to 1000 entries in their display. Exceeding this limit produces the following warning:

As you can see, the records being displayed are not necessarily the first 1000 corresponding to the selected sorting method! There is a technical reason for this: namely that the limit is applied to the data source in the connected site’s monitoring cores. This is very important, because if we accumulate one million data records from your environment spread around the world, then 99.9% of the data will be deleted immediately. The sorting takes place from the end of the list, thus it happens after the limit. The data from all instances must, after all, be sorted together.
If you really want to see more than one thousand records, then you can reach the next level by clicking on Repeat query and allow more results. Here the limit is 5,000 records. If this limit has again been exceeded, with unlimited you can continue. Insofar this is a potentially risky action, you will require Administrator rights. You have been warned!

You can define both levels under Global Settings > User Interface:

3. Customising views
3.1. The basics
Checkmk allows you to customise its standard views, and even to create new ones that you can incorporate into reports and dashboards. Thus you can define numerous different aspects for every view:
General items such as title, theme, etc.
Which data source is to be displayed (e.g. hosts, services, events on the Event Console, etc.)?
Which selection of records is to be displayed (filtering)?
Which columns will be displayed?
Which other views are linked to the text in the columns?
What is the standard sorting method?
Is there a grouping, and if so, how does it look?
Where and for which user should the view be visible?
Which style of table layout should be used?
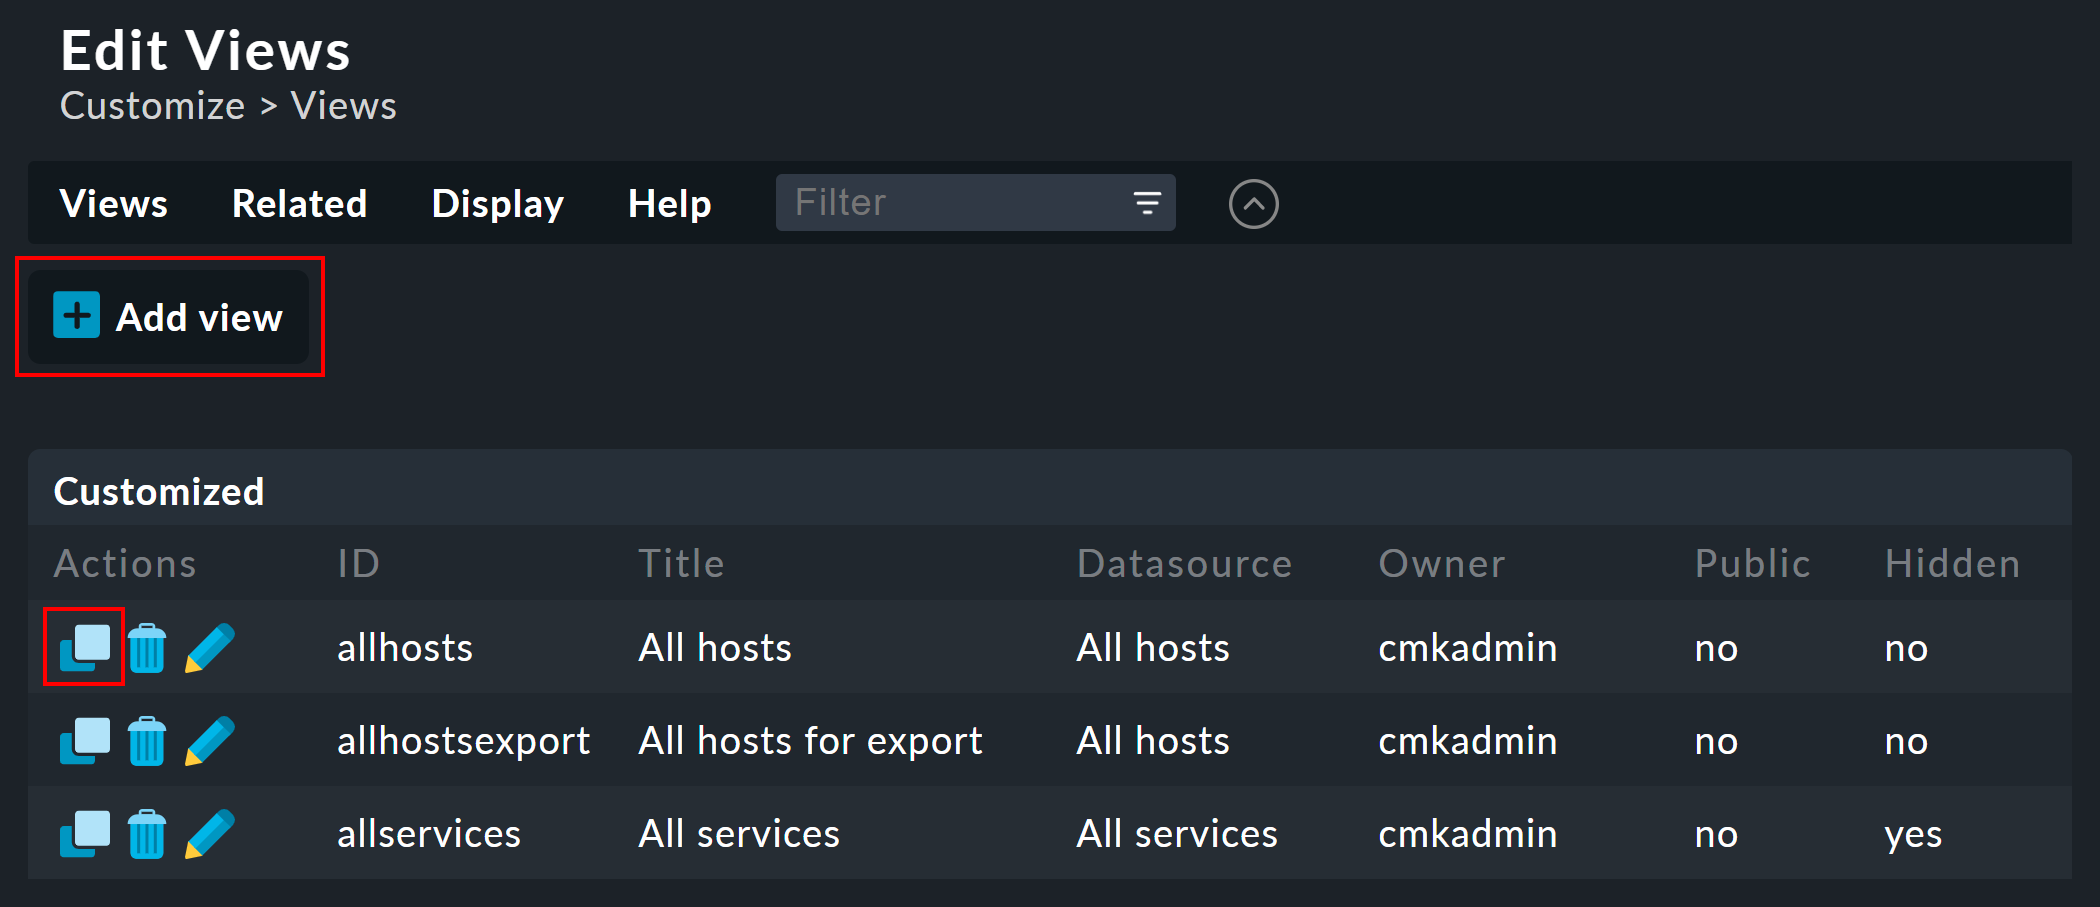
The edit mode for views can be accessed in two ways:
From an active view via the menu item Display > Customize view — with which a clone of the current view is created.
In the menu Display > Customize view. There you can create completely new views with
 , or customise existing ones with
  :
:
3.2. Clone first — then modify
The views supplied as standard are a part of the software and as such cannot be
changed, however Checkmk does recognise the concept of cloning. When a view
is first customised (regardless if by using ![]() or via the list) a copy of that view is created automatically. This copy is
added to your user profile.
or via the list) a copy of that view is created automatically. This copy is
added to your user profile.
This copy can then be customised as desired. The original view is retained but
is greyed-out — overlaid by your new version in effect. You can return to
the standard view later by simply deleting your clone (achieved in the table of
views, as you might expect, with ![]() ).
).
This concept has one further advantage: namely, that you can define whether the view should be changed for all users or just for yourself. This is specified in the view’s General Properties with the Make this view available for all users checkbox. Not surprisingly, you can only select this checkbox if you have administrator permissions (or more correctly, this function has its own permission — Publish views). Additionally, single views can be locked in the role definitions.
What happens when a view has been customised and published by several users? Each user then has their own variant of the view. Which view will be visible for which user(s)? This can be determined with the following rules:
When a user creates a view for themselves, this will always have priority for them.
After this are views that have been customised and published by an administrator (to be precise, someone with the Modify builtin views permission).
If there are none here, then those views apply that another normal user with the Publish Views permission has published.
And when there is also nothing here then the supplied default version will be visible.
How can you create a real copy of a view, so that when done you can have both the supplied and your own views? This is defined by using Unique ID in the General Properties. Simply give your view a new name, so that it will no longer be identified as a clone of the supplied view, rather it will begin its own independent life.
This ID is the decisive keyword for opening views in the URL. The schema is very
simple. Here for example is how the global view with its ID allhosts
is opened:
/mysite/check_mk/view.py?view_name=allhosts
The concepts of cloning, customising and visibility can be found at many other locations in Checkmk, namely in:
3.3. Integrating a view into the sidebar
How and if a view will be shown in the sidebar’s Views element, is defined under General Properties by the following characteristics:
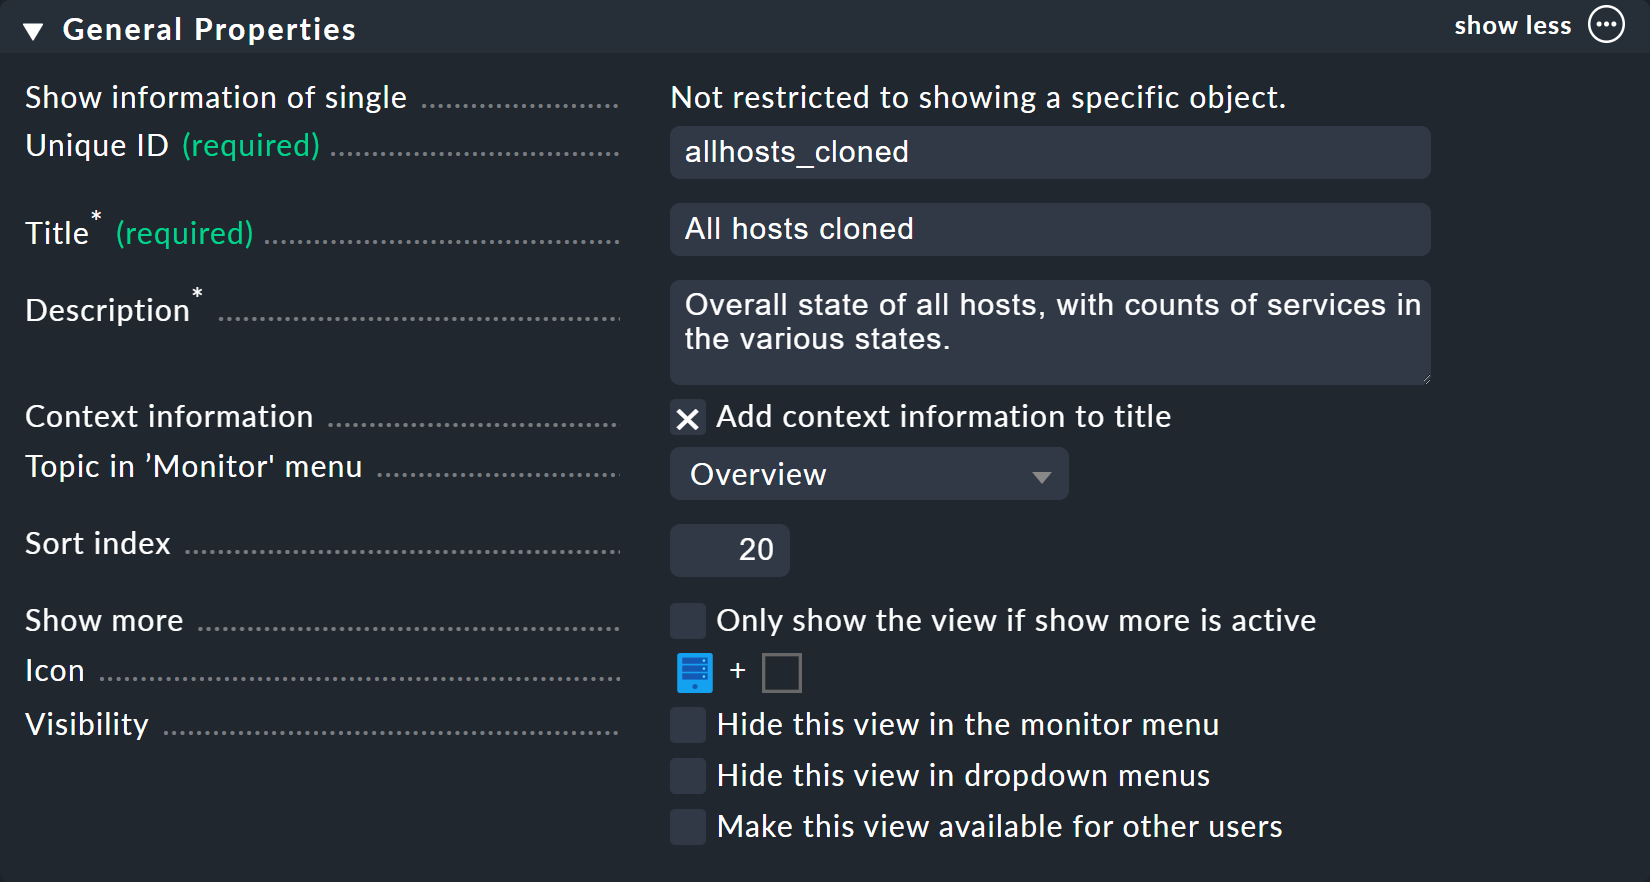
Title — the item’s name
Topic — the view will be sorted under this topic. You can also define other topics.
HSort index — how high up the view appears in the menu
Visibility — Suppress entry and/or share with other users
3.4. Basic layout
The next block — View Properties — defines a view’s general appearance:
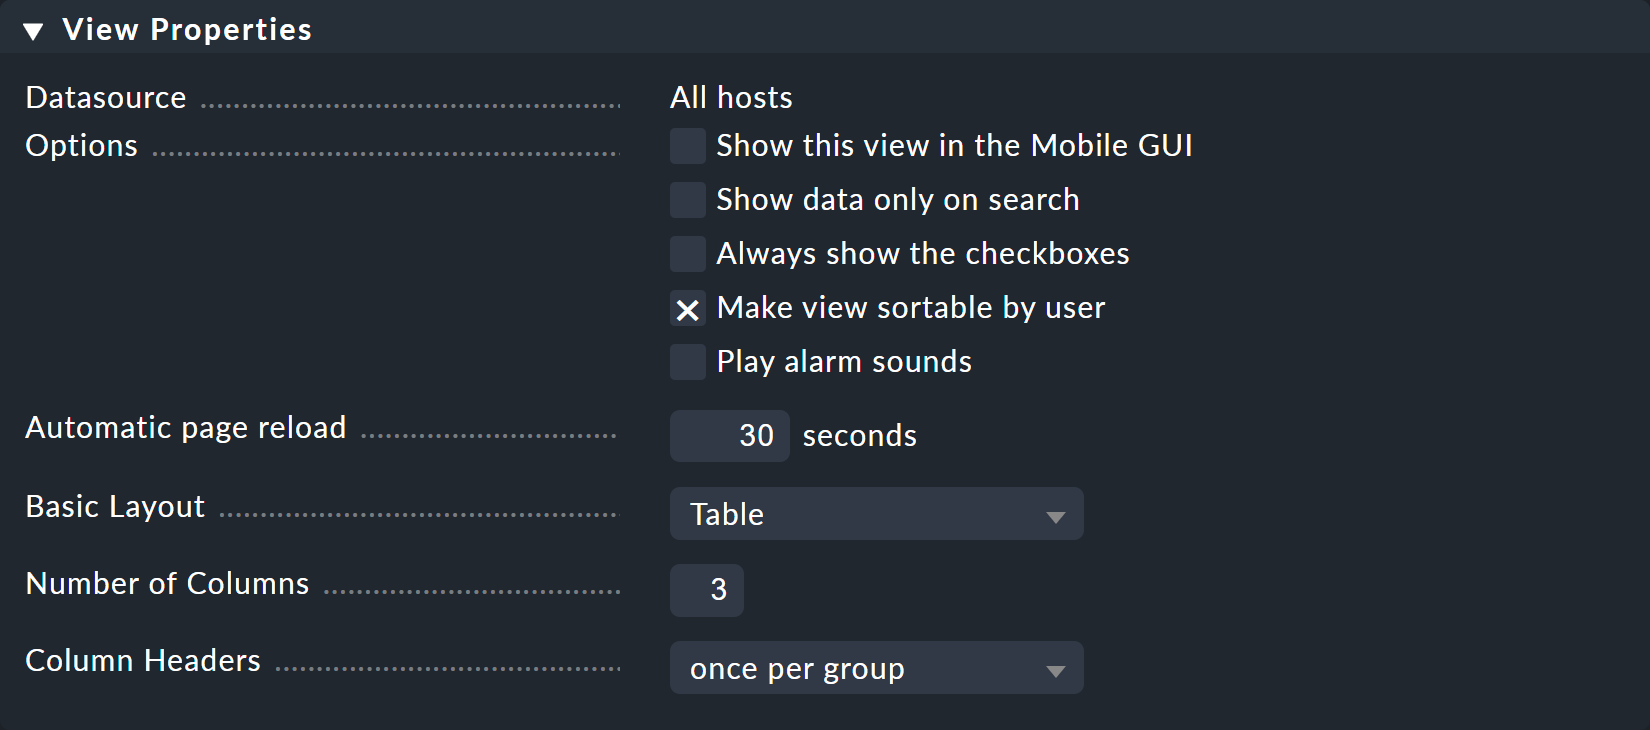
The Number of Columns option sets the default for the number of columns shown in the view, the Automatic page reload the default for the refresh counter. Both values can be modified by the user in the view itself via Display > Modify display options.
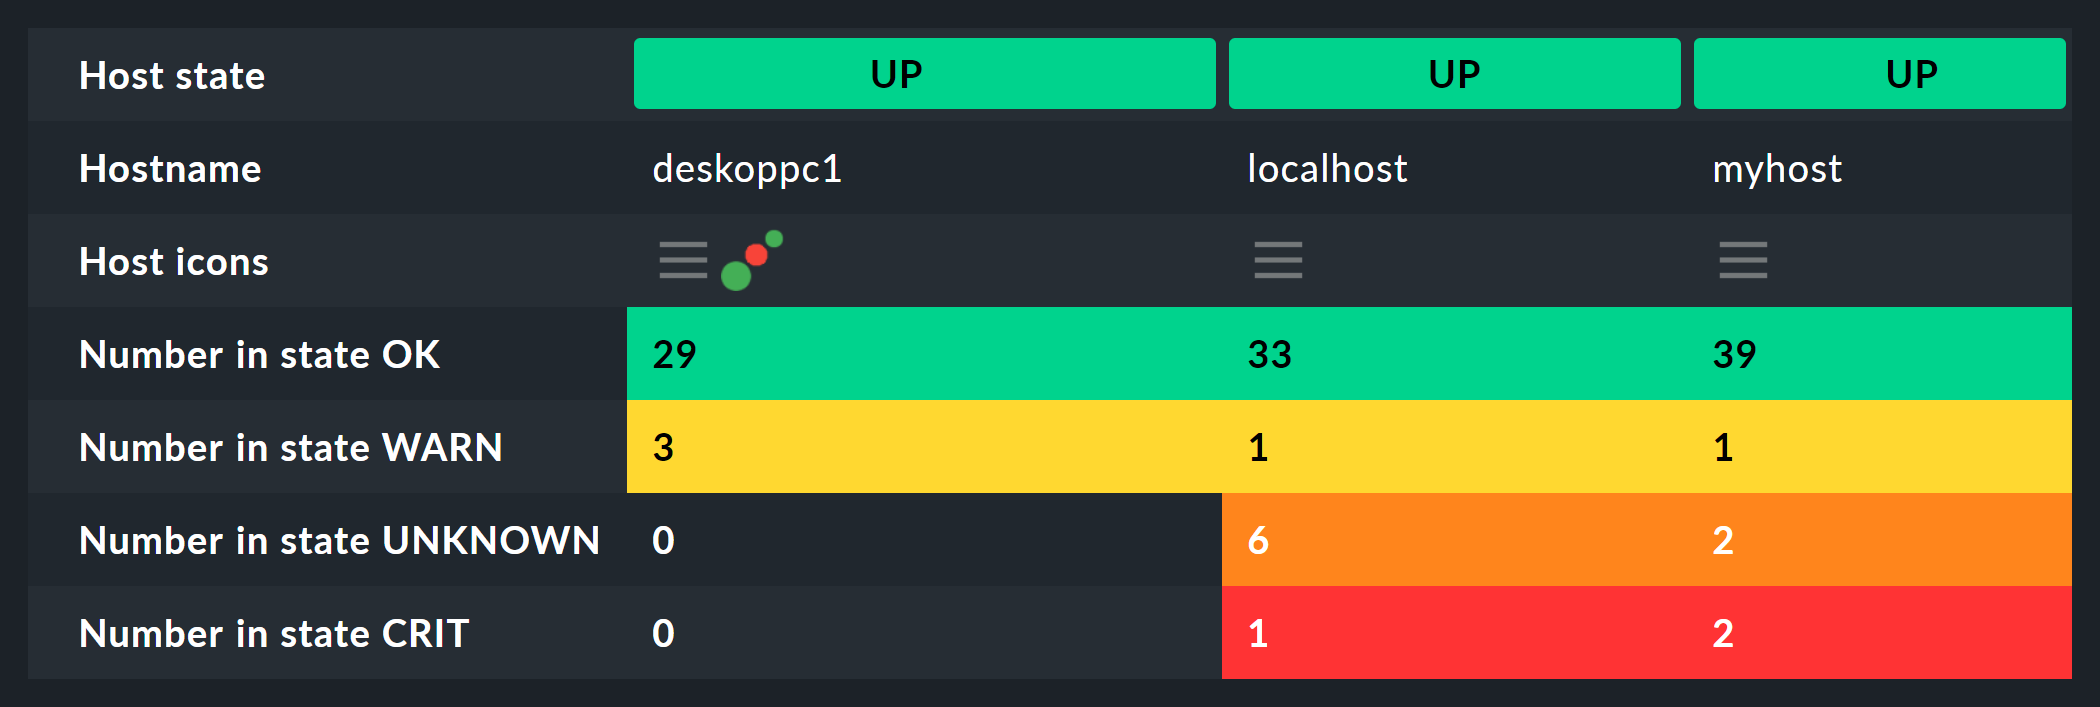
Under Basic Layout there are various styles for displaying the data in tables. Most views use table — a normal table that can be sorted by columns — or Single data set — which has the legend on the left and which is mostly used for single data sets. You can however also use single data set for views with more than one object. The All Hosts view looks something like this when altered to Single data set:
3.5. Columns and grouping
The Columns box defines which columns you wish to see. The number of columns possible selection depends on the selected data source. The most columns are found in services, naturally, as all information for the particular service is available. The list can be quite long here, and if you are uncertain which column is the right one, there is only one thing to do — try it out:
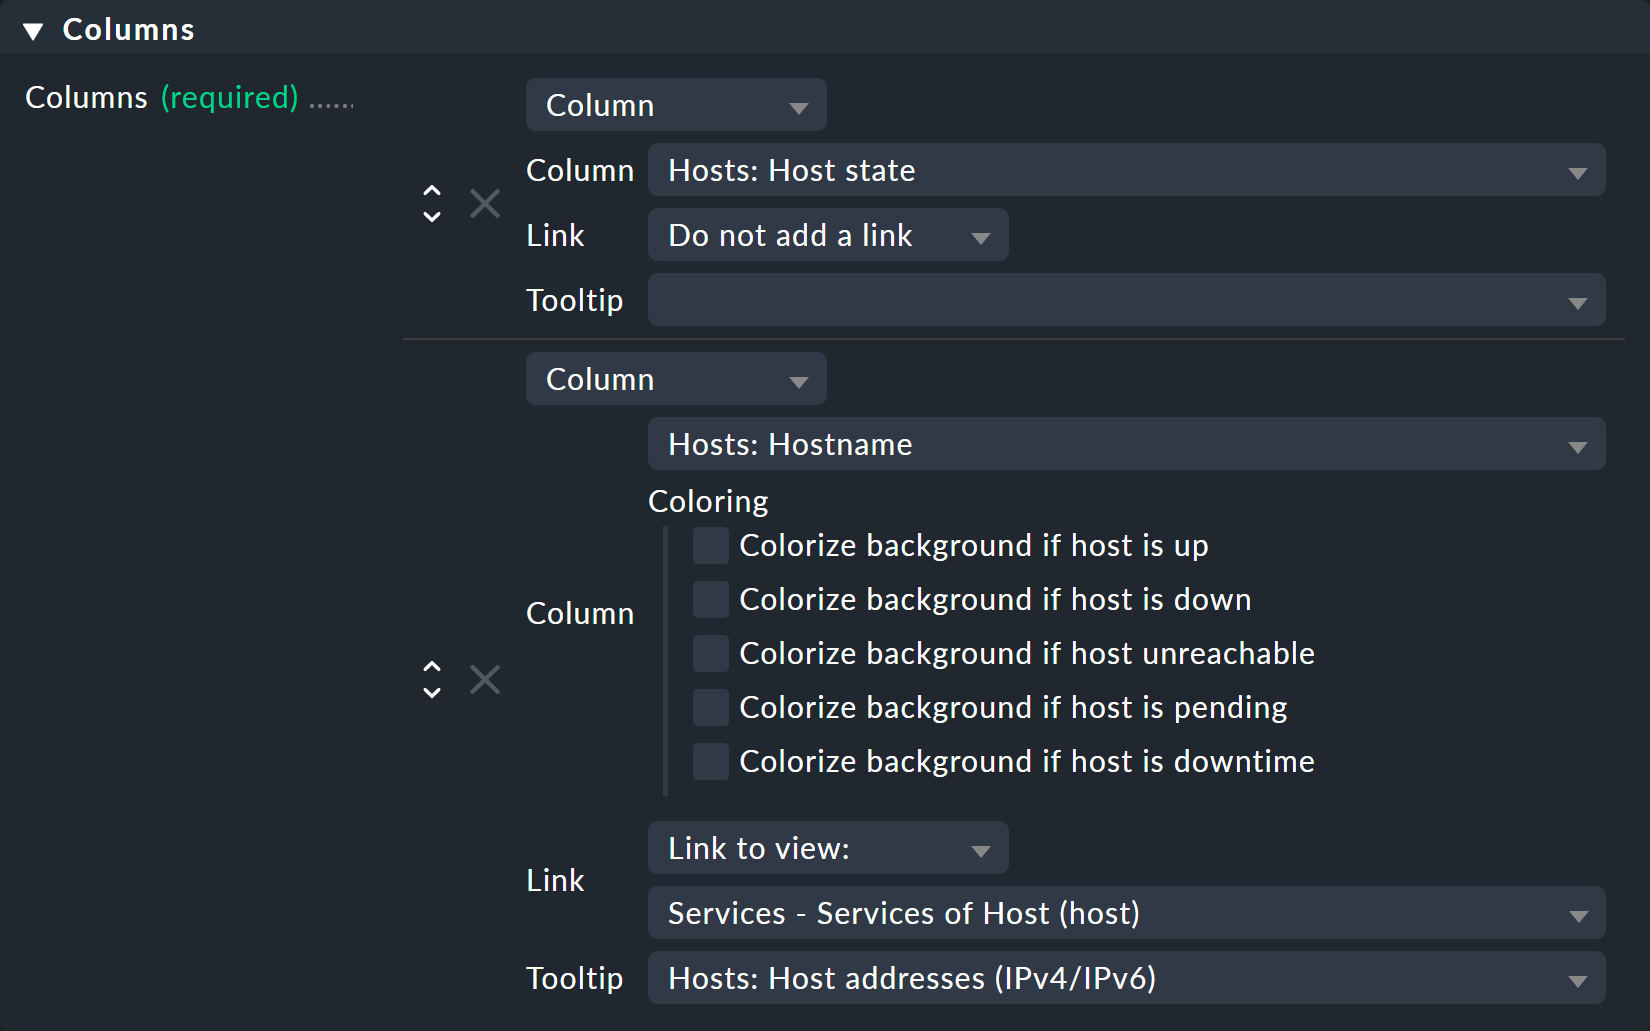
Depending on the column selected, there may be specific options for this. With the column Hosts: Hostname, for example, it is possible to color the hostname according to its status using the Coloring option.
The Link field offers a selection of all views. If a view is selected here, then the column’s respective cell is clickable and takes the user to the chosen view. This really only makes sense if the targetted view has a context. The best example is the All Hosts view. The Hostname column is clickable here and takes the user to this host’s Services of host. Alternatively, dashboards can be specified here — which obviously do not require a context.
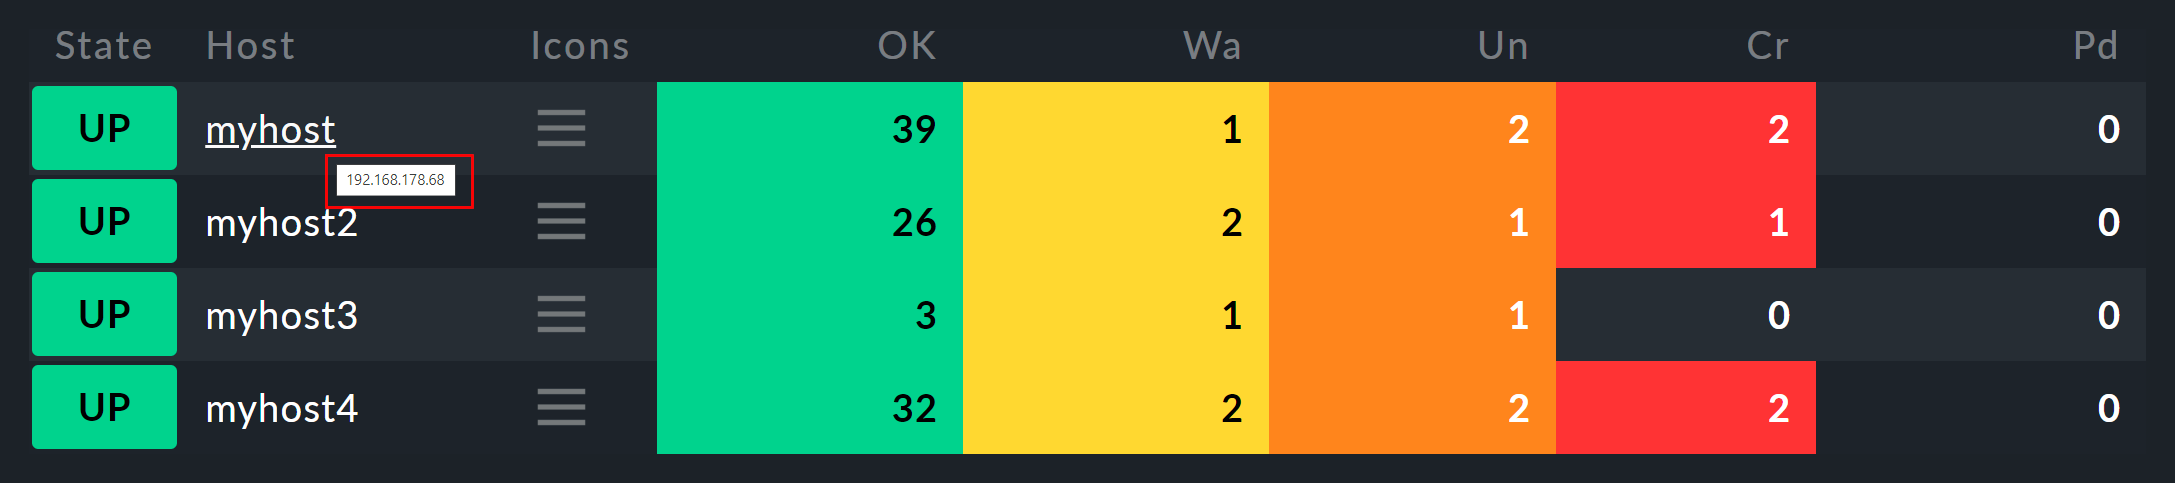
Under Tooltip, on the other hand, you will find a list of all columns. Thus you can show further information for the host or service when the user moves the mouse cursor over the respective cell (the IP-address in this example).
3.6. Information for services in a host view
Let’s imagine that you’d like to display the information for particular services in a table of hosts. The following example illustrates this situation very well: here the current uptime, the CPU load, the memory usage and the NTP-synchronisation are shown for each host:
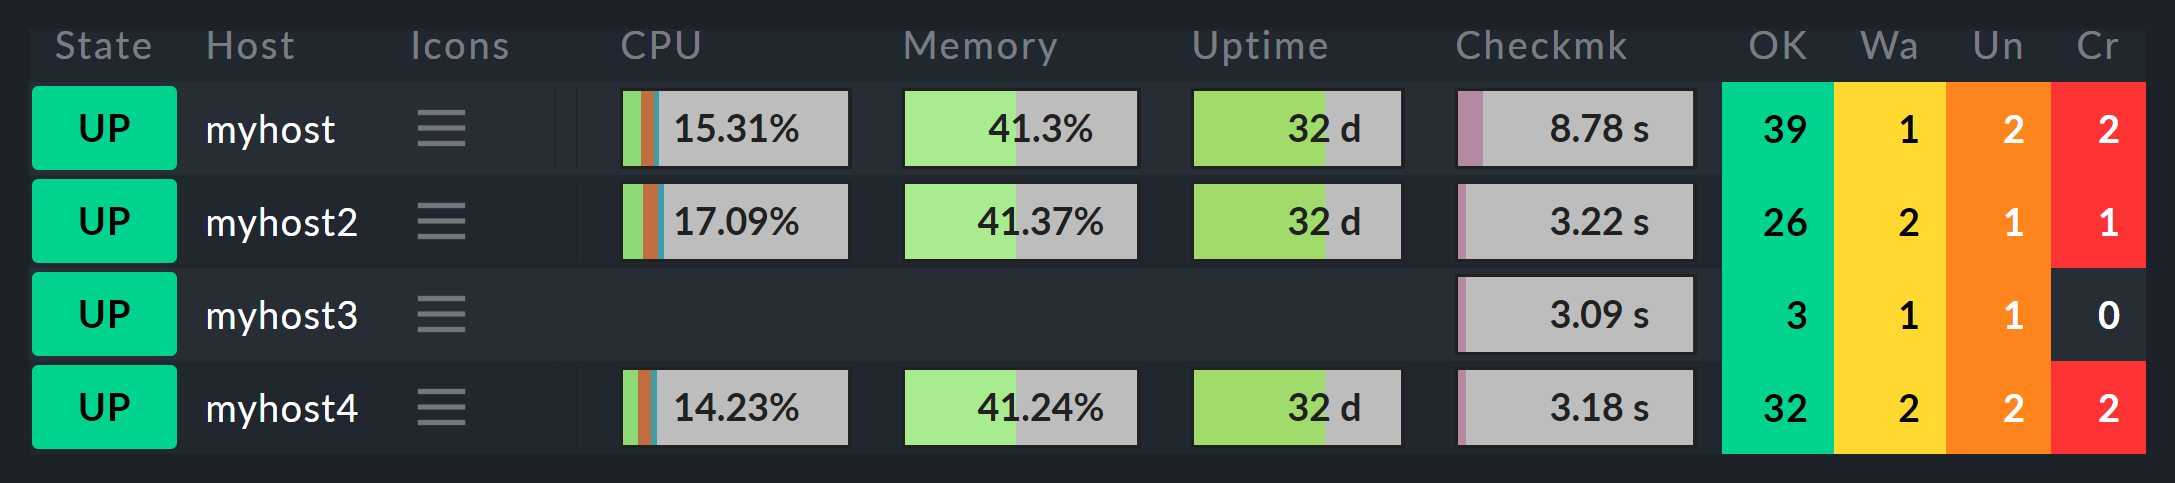
Here a table of hosts has been generated in which for each host the Perf-O-Meter service column for four different services is displayed. One sees that for one of the three hosts the CPU load and the Memory services do not exist and that the column is consequently empty.
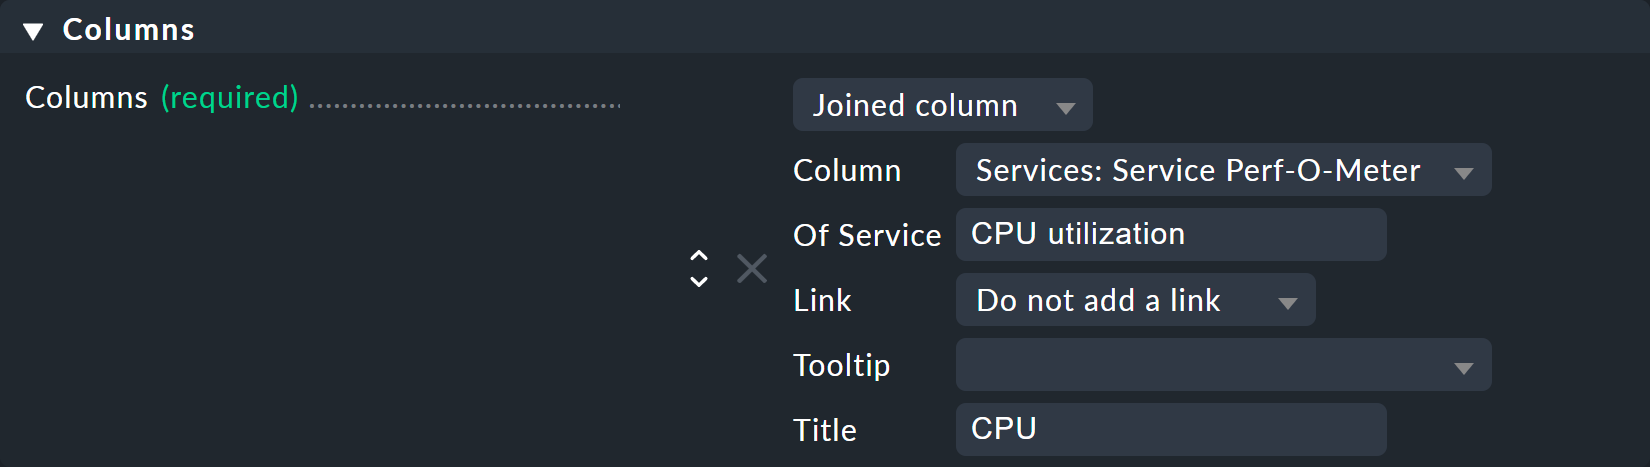
This view’s configuration was achieved by adding columns of the Joined column type. Here the column for services in which Perf-O-Meter has been selected appears under Column. The Title entry defines the column’s heading. The service’s exact name must be entered (upper and lower case sensitive!) in the Of Service field:
Of course such a display is only useful when the view shows a list of similar hosts, all of which also utilise the selected services. This is also the reason why Checkmk does not provide views of this type — which columns are meaningful here depends entirely on the type of host selected. For Linux servers the information of interest is certainly completely different to that for USVs, for example.
3.7. Sorting in views
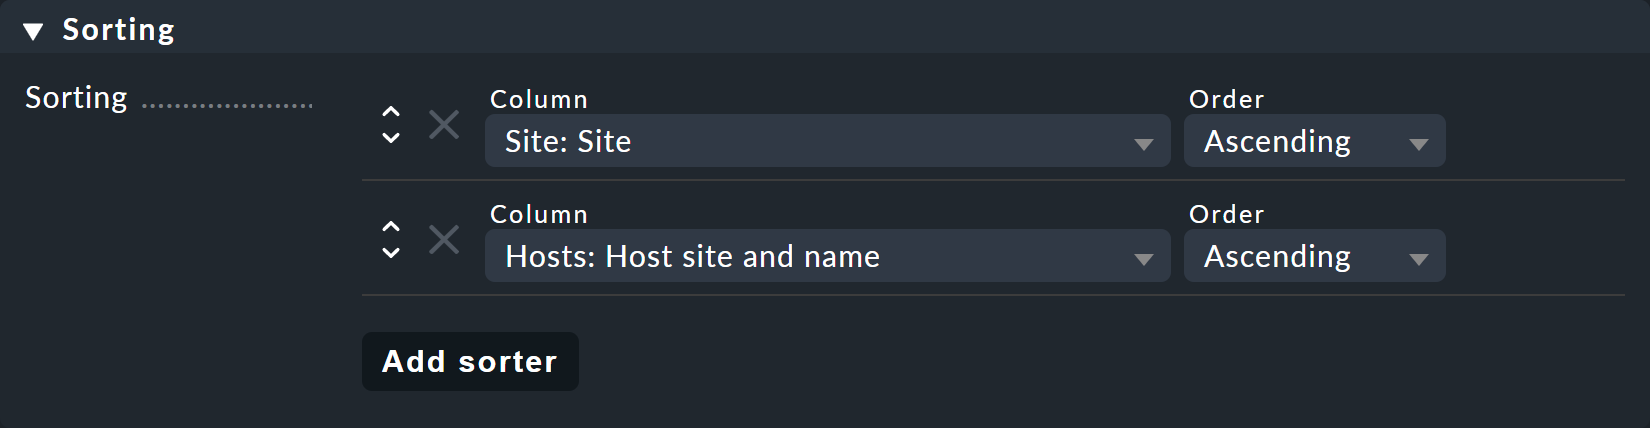
The sorting within a view is configured in the fourth block. It’s only a matter of the predefined sorting method. Users can — as described above — determine the sorting order themselves with a click on the column heading. In the view’s configuration however you have more possibilities — you can define a multi-step sorting order, e.g. first by service-status, and for the same status by service name. The order so determined is retained as a subordinate sorting when the user resorts in a specific column.
3.8. Grouping
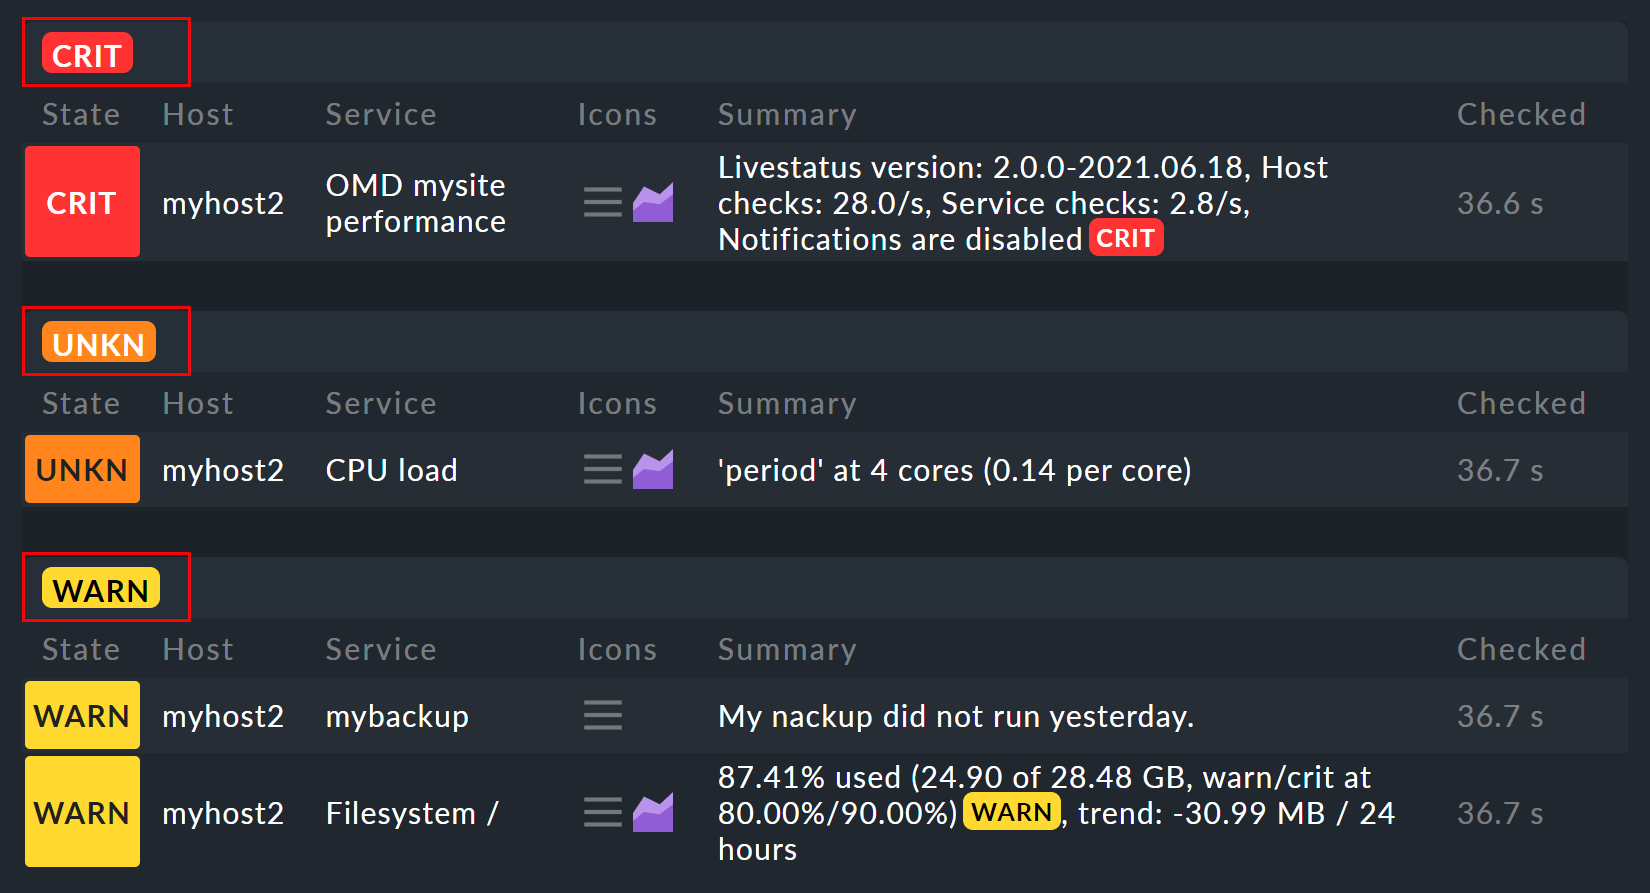
Through grouping you can divide a table into several segments — in which each segment’s data is related in some way. The best example of this is the Service problems view, which is easily reached via the Overview snapin.
As you can see, this table is grouped with Service status (first all CRIT, then UNKNOWN, then WARN) - each with its own group header:
The grouping in a view is configured similarly to that with the columns. Simply define which column the grouping should relate to. It is usually only one, but can be more. All records with the same value for all selected columns will then be displayed in a group — and the column heading will be shown as the group title.
It is important that you also sort the records by priority according to the group’s selected characteristic! Otherwise it can be possible that the same group makes multiple appearances (which may at times be desirable). Incidentally, a resorting by column performed by a user has no effect on the grouping — in such a case only the group’s sequence is determined and the records sorted within the group. The groups themselves are unchanged.
3.9. Filters, contexts and searches
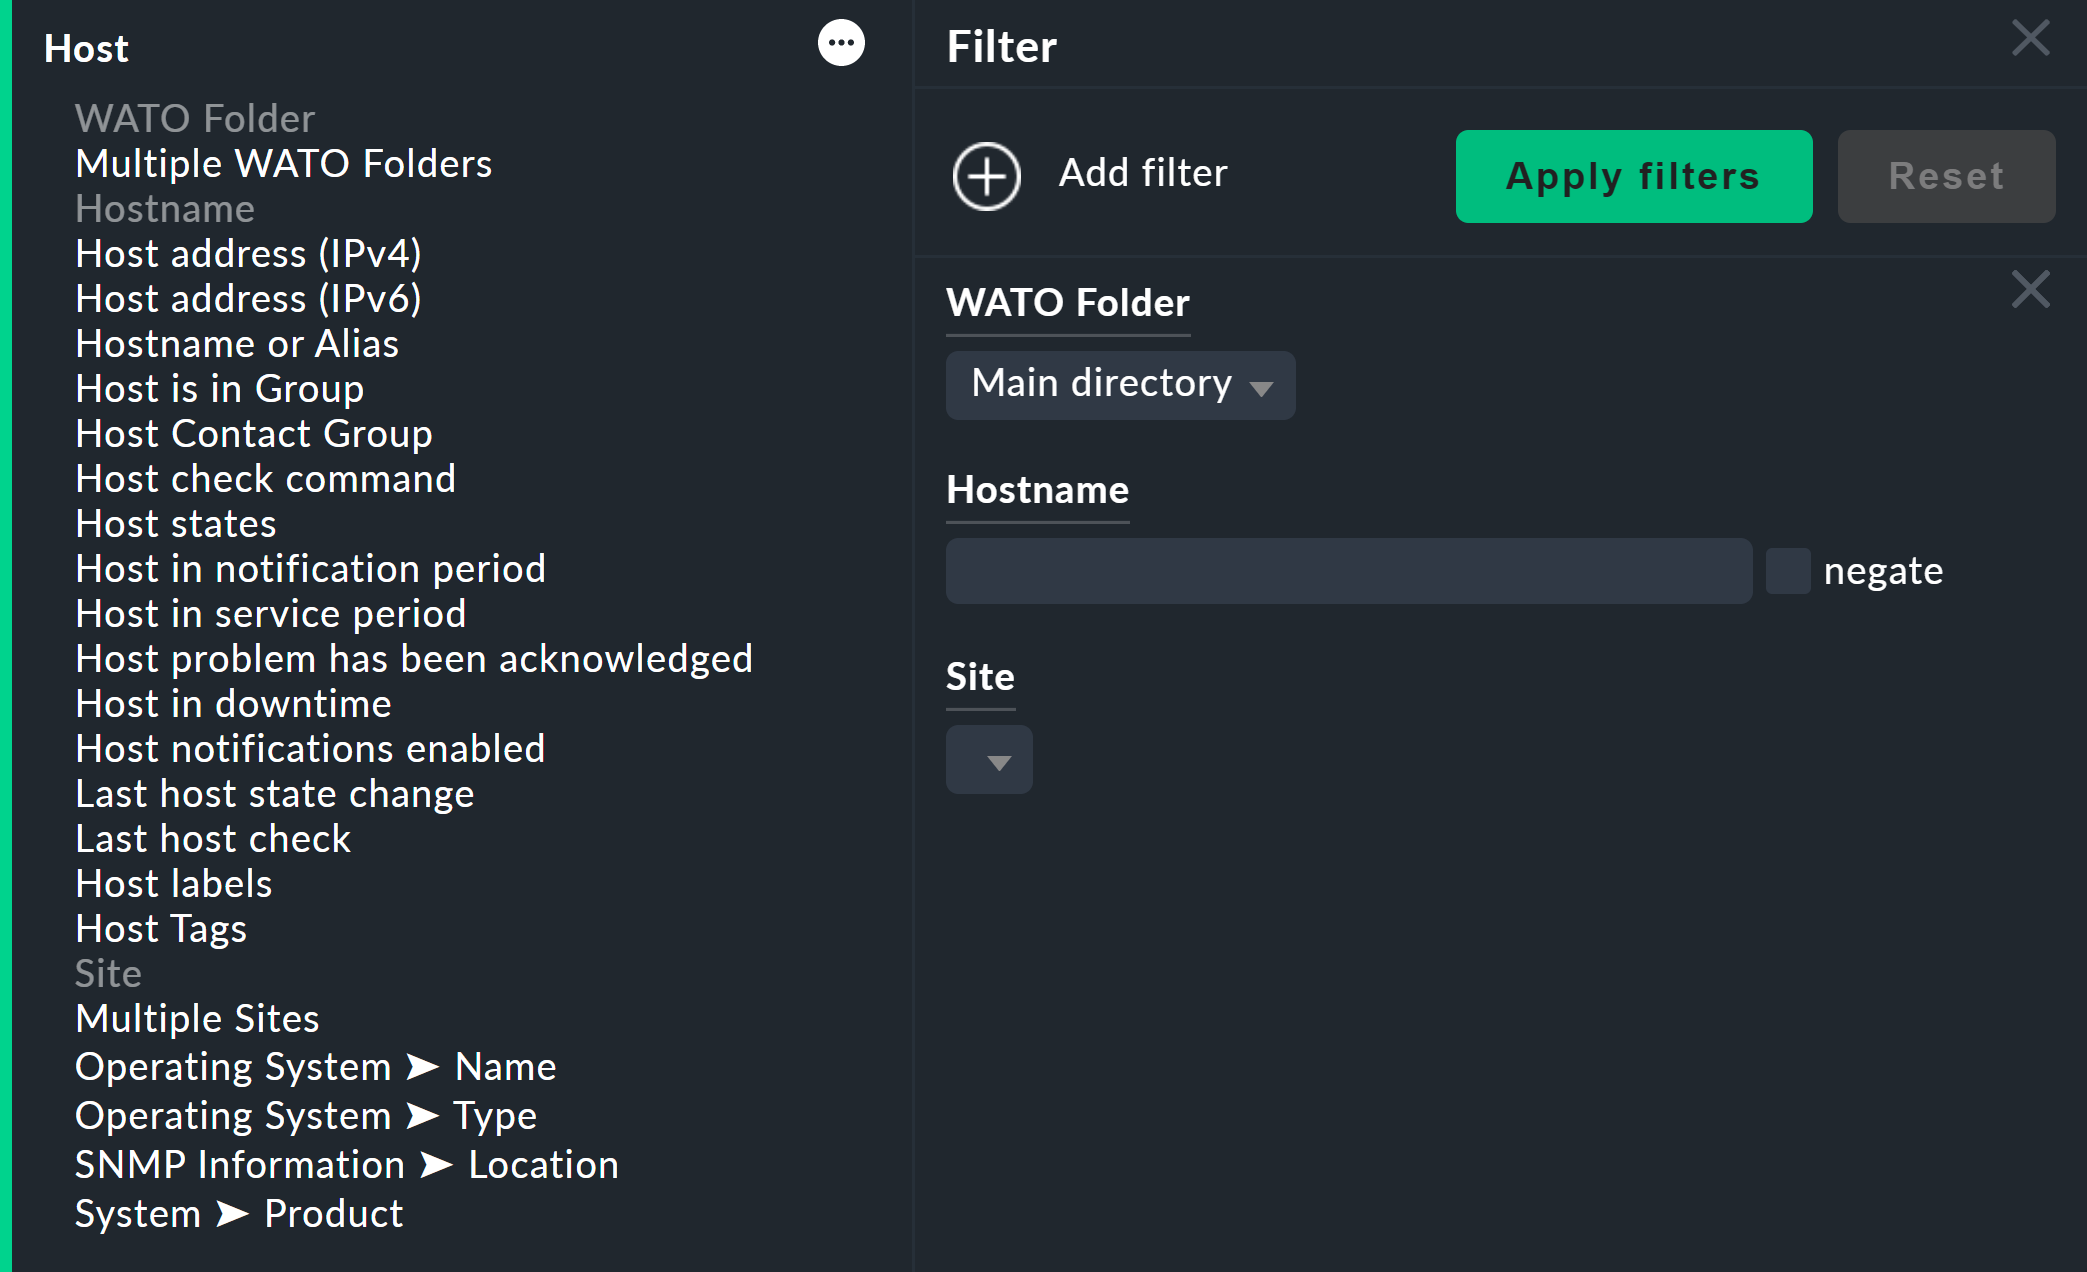
An important aspect of views is the data selection. Which hosts or services should be displayed in a table? Checkmk uses the Filter concept for this purpose. Here are a couple of examples of host-filters:
Every filter can be defined with search terms or other criteria by a user, thus reducing the list of results to those records meeting the criteria. In this way the filters are AND-linked. The filter criteria actually used for a view are assembled from three sources:
Filters with criteria defined as standard for the view
Filters set interactively by the user with
 in the view
Filters that can be set with variables via the URL
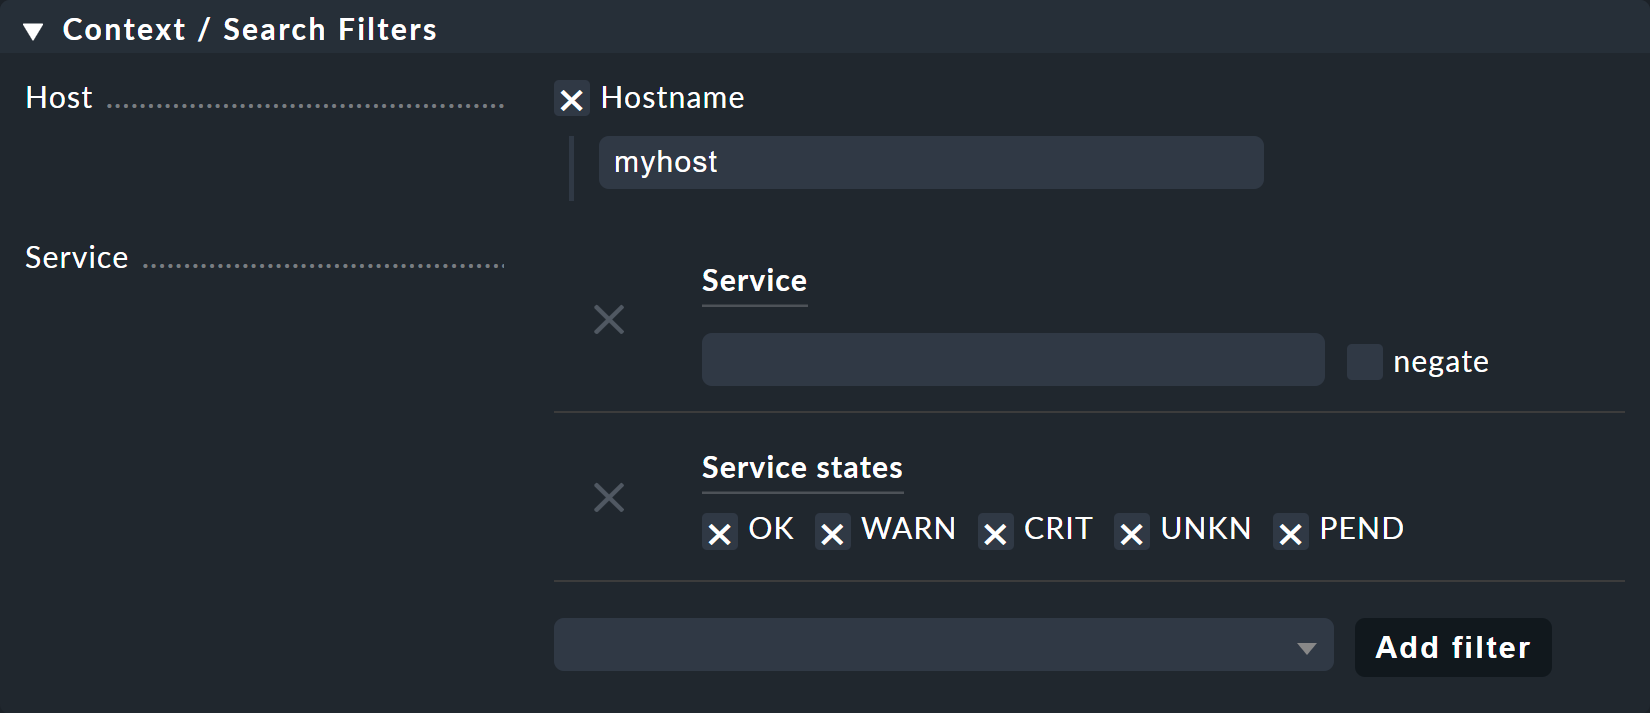
The filters you assemble by editing in the view’s context/search filters box
have two functions. Firstly, by clicking on ![]() you can decide which filter will be available to a user. Secondly, you can predefine
filters using criteria, thus limiting the data to be displayed in the view
(point 1 above).
you can decide which filter will be available to a user. Secondly, you can predefine
filters using criteria, thus limiting the data to be displayed in the view
(point 1 above).
When you create or edit a view by using context — instead of the filter for
the relevant object only an optional entry field appears. In this an
exact comparison always applies (upper and lower case sensitive). As an
example we can take the host view, which displays all services of a
specified host. The host’s name can be specified by adding a context to the
view. You can also build a display in which the host to be displayed is effectively
hard-coded directly in the view:
In this way you can call the view without context, or if desired, simply add it to the sidebar’s Views element without problem.
3.10. Special search views
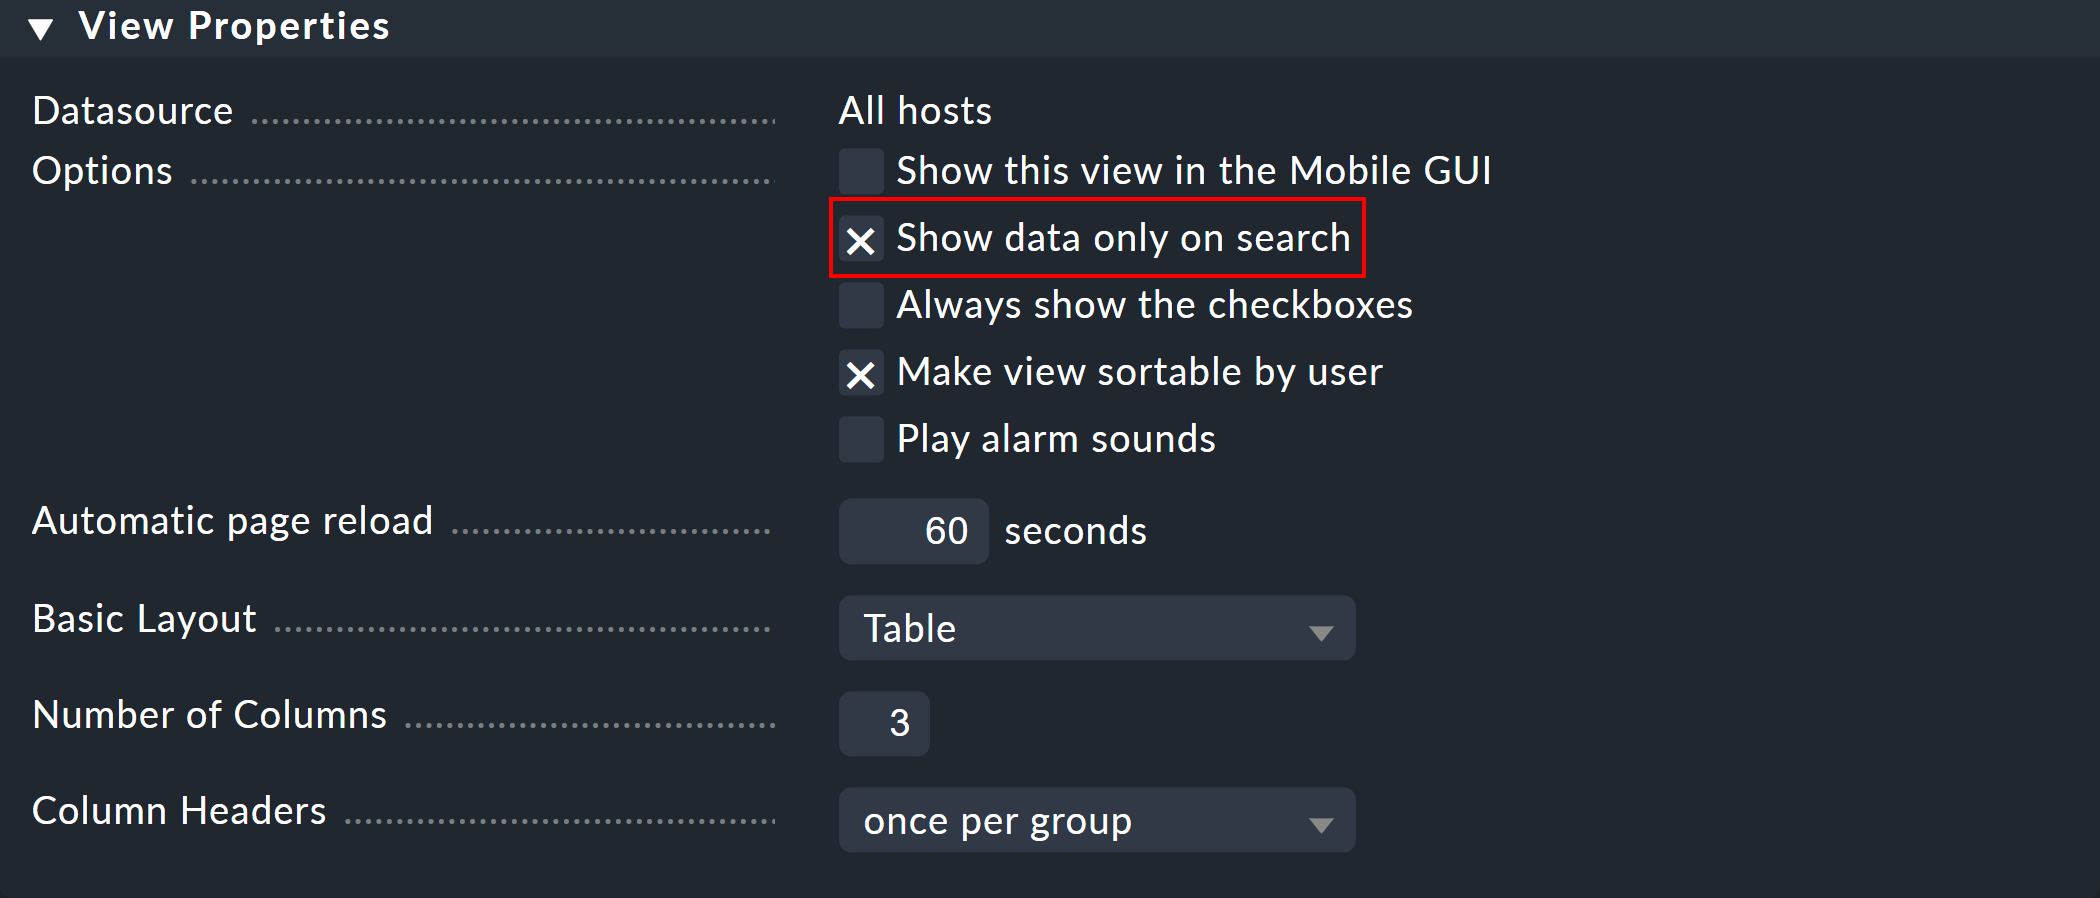
The Host search and Service search (and other) views supplied as standard behave in a special way in relation to the filters. When you you select one of these views, it opens with a filter formula, and then only shows hosts and services when this filter is activated.
Why is this so? Because it would simply be very impractical if you first had to go to All services, and then be forced to wait until several thousand services are displayed before you could filter the result with a search entry. This behaviour is regulated by the Show data only on search option:
4. Creating new views
Creating a new view with ![]() functions in principle
just like the editing of an existing view — with one small difference: you must
first select a data source and a specific object type.
functions in principle
just like the editing of an existing view — with one small difference: you must
first select a data source and a specific object type.
4.1. Data sources

The data source is what you might call a table or database view under databases. Checkmk does not use SQL-Data bases, but it is similarly-structured internally. In most cases you will be correct with All services or All hosts. There are however a few data sources that should be listed briefly here:
| Data source | Meaning |
|---|---|
Host and service groups, various |
see below |
Alert Statistics |
|
BI, various |
|
Event Console, host and service events |
|
Inventory, various |
|
The Logfile |
Host and service groups
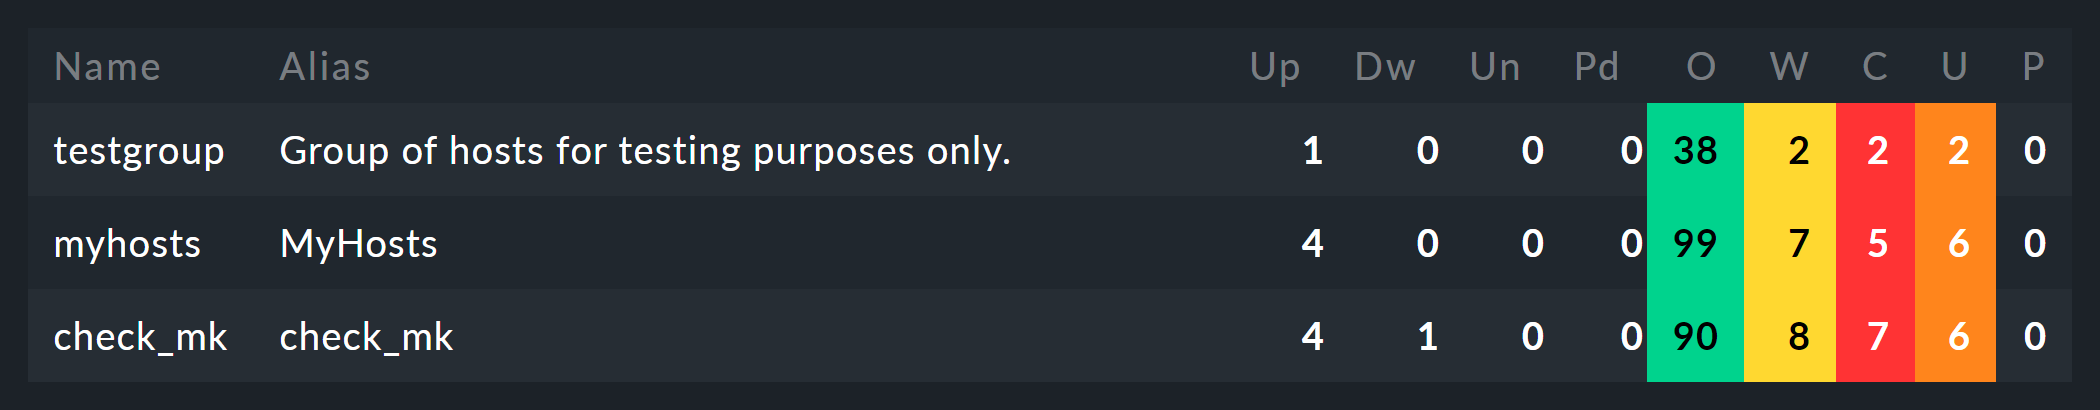
The Hostgroups and Servicegroups data sources — per line — provide the information on the group itself — accordingly there are no filters for individual hosts or services. An example of this data source is the standard Host groups (Summary) view. In distributed environments the Hostgroups, merged and Servicegroups, merged data sources work in exactly the same way.
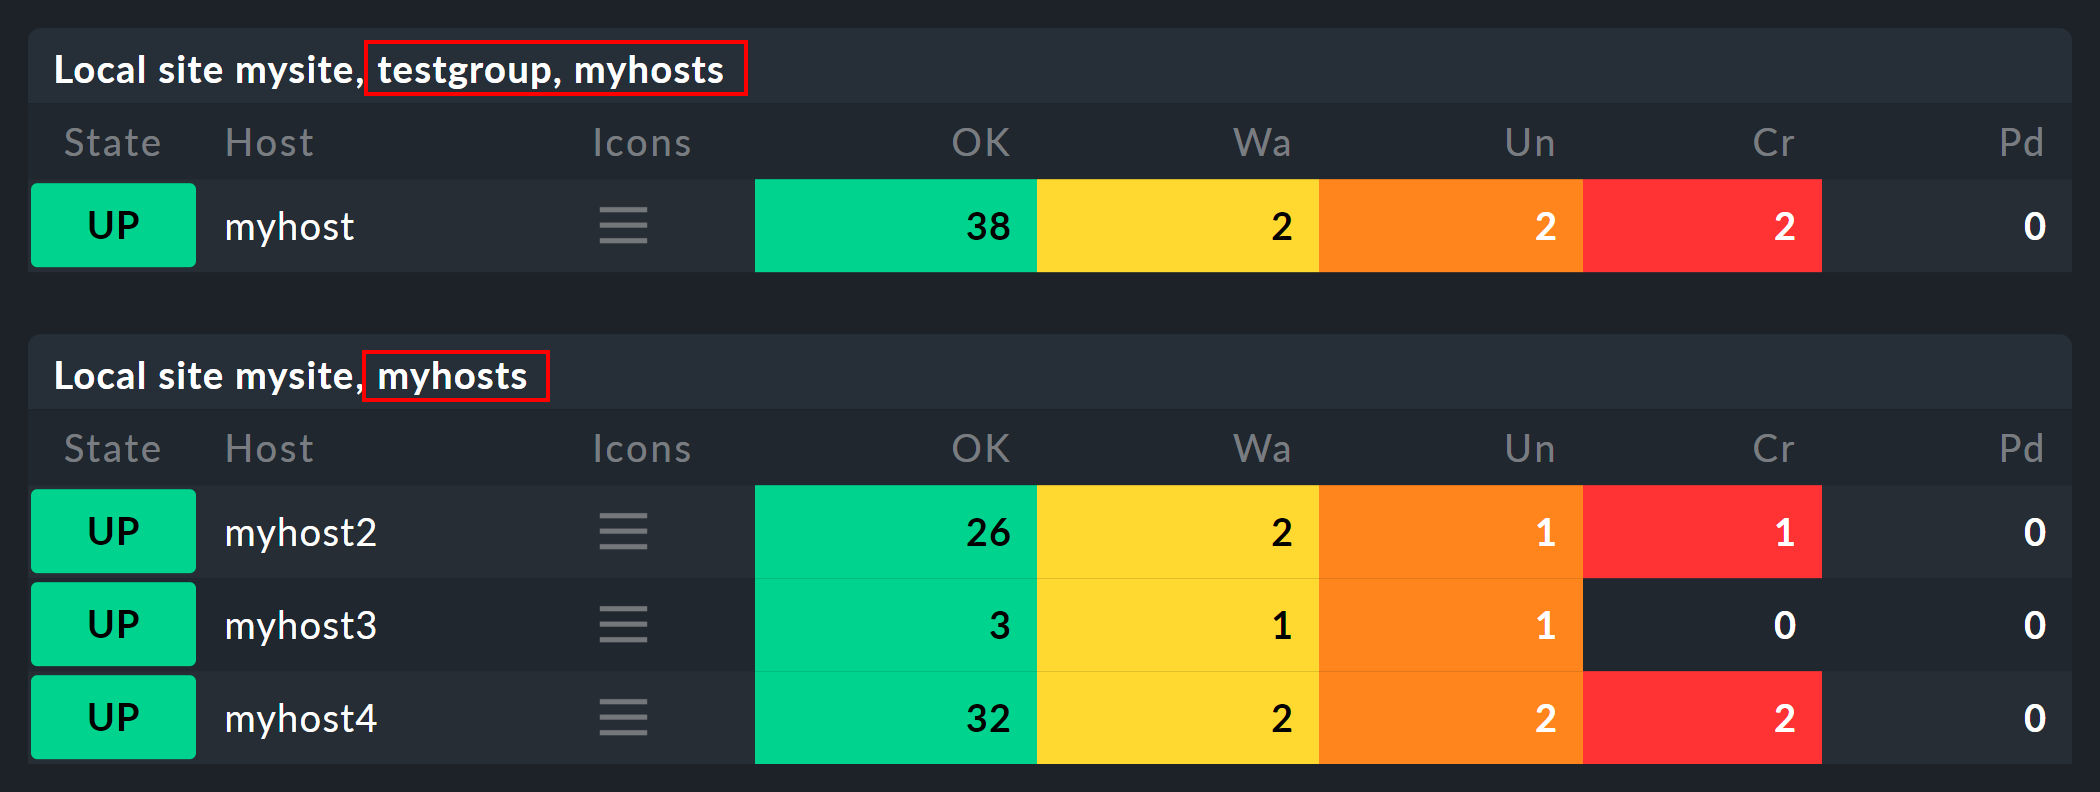
However, if you want information about individual hosts, but grouped according to host groups, you can use Hosts: Host groups the host is member of. Since hosts can be assigned to multiple groups, you will then find a single area in the view for each host group combination, which applies to at least one host.
You can proceed in the same way with services and service groups.
Depending on the selected data source, various columns are available for building the view.
4.2. Object type — global or with context
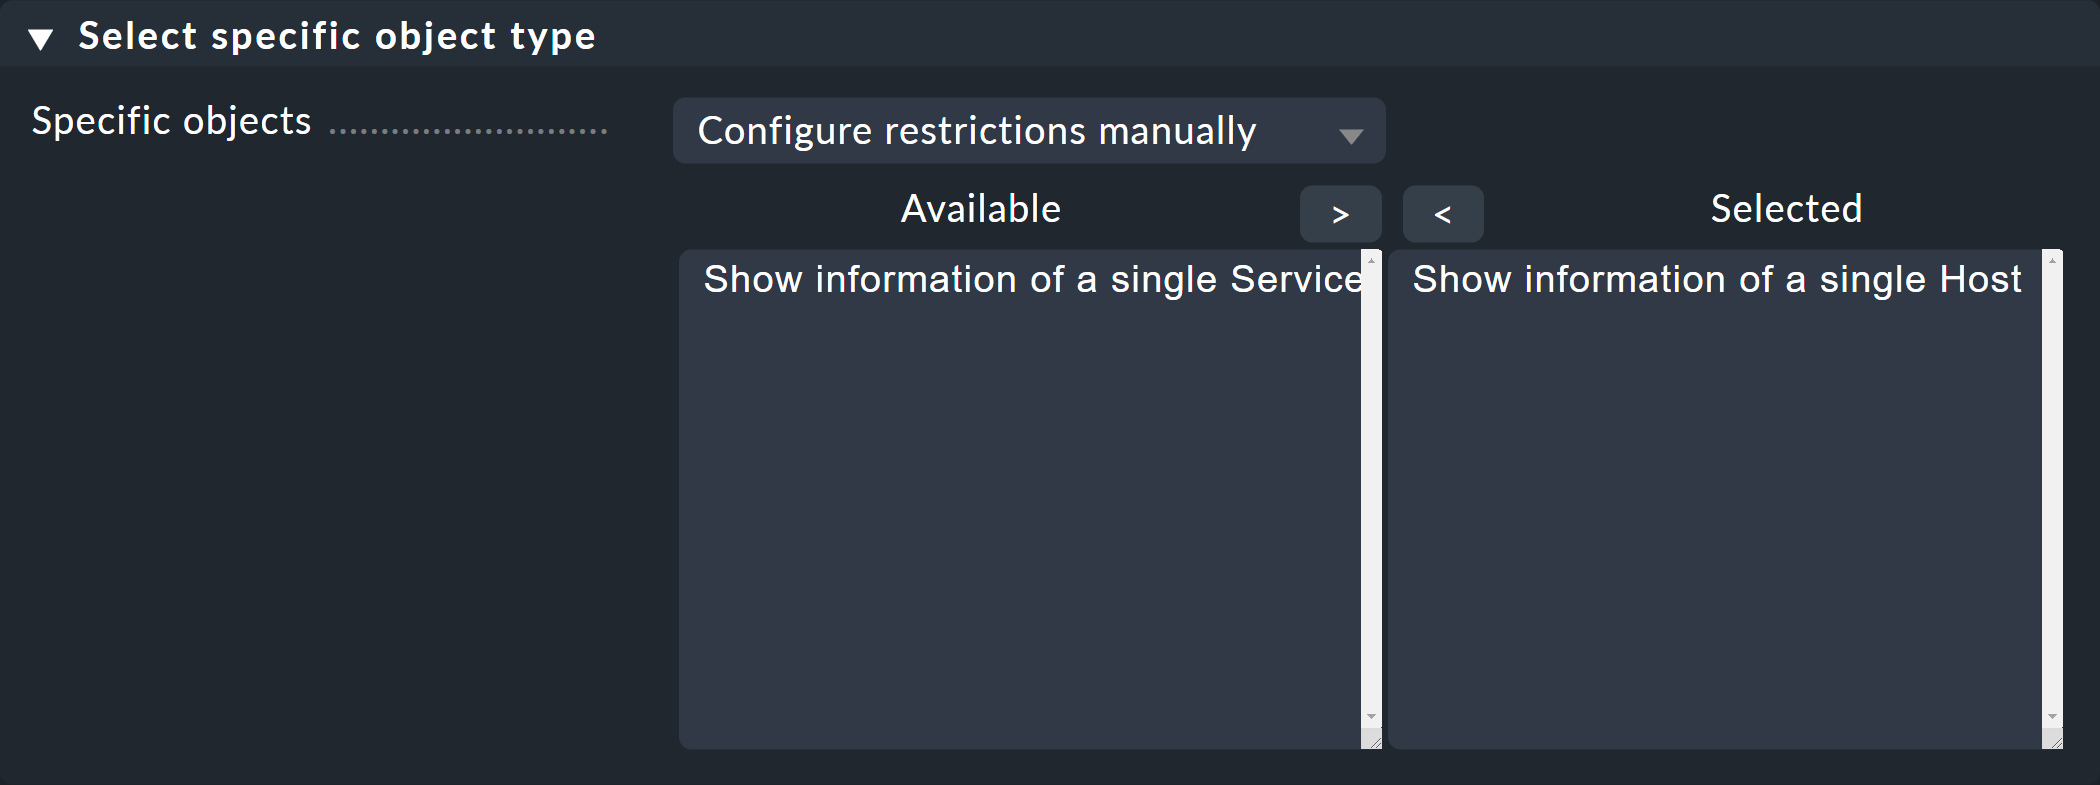
Here it can be decided whether your new view should have a context or if it will be a global view. The selections available to you depend on the data source. The most common context by far is ‘Host’. The image above appears after selecting the All services data source.
Checking the Show information of a single host box defines that the new view describes one specific host. You will thus have created the basis for a view that is not globally-visible, but instead visible via a link:
For a host view with a context
As a link in a column (see above, e.g., click on a host name in a view)
There are two options for the Service context type. If you select only Show information of a single service, you can build a view that displays all services with the same name on different hosts. If it should be a specific service for a single host, then check the Show information of a single host box.
5. The matrix
When you specify the Matrix layout in one of your views you will probably see strange things at first, and ask yourself what is going on. The matrix is certainly not intuitive on first viewing, but you can achieve good things with it.
In the supplied standard views there is one that utilises this layout — and that is Search performance data. You find this view via Customize > Visualization > Views.
The following image shows the search for the
expression CPU|^memory|Filesystem /opt/omd/sites/mysite:
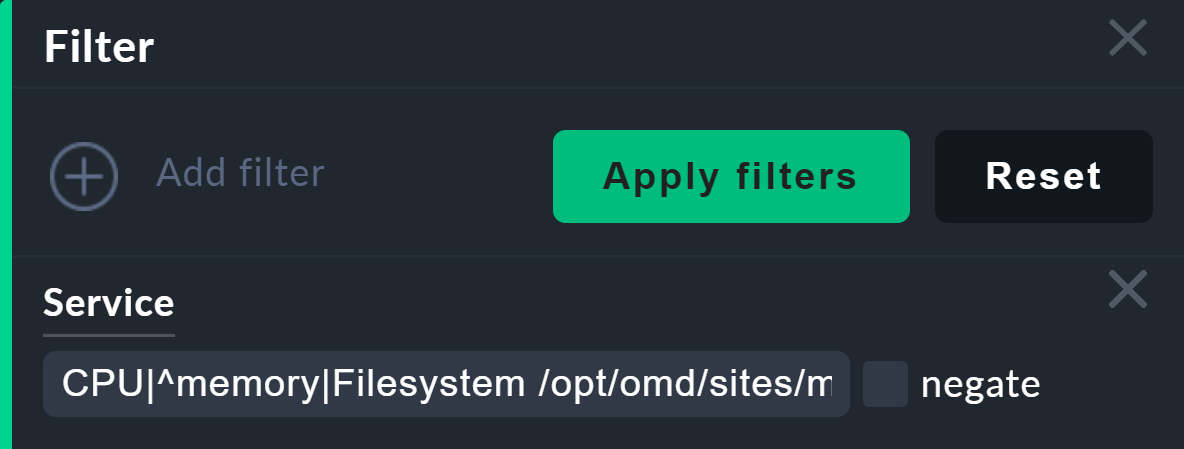
The result is a neat table of my hosts, in which all of the service’s metrics are listed adjacent to each other. Not all of the hosts have the same services, so some of the fields are simply empty:
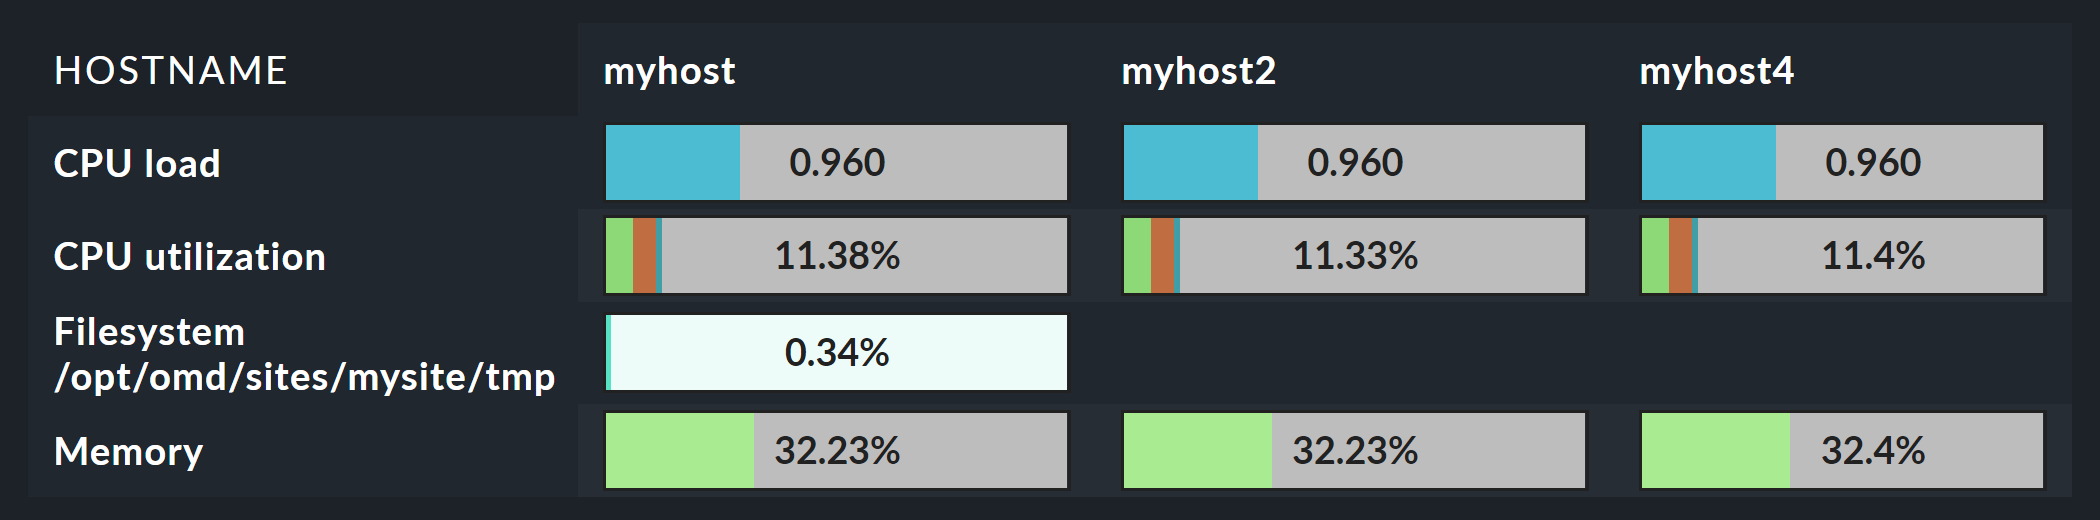
The result at first looks very similar to that described earlier — Information for services in a host view. There are a couple of significant differences however:
The list of services is dynamic and has no fixed configuration.
Here the hosts are the columns — not the lines.
With the matrix you can do much more.
When you look at the view’s definition you can see how it is constructed:
Matrix is specified in Basic layout.
The Hostname is specified as the only column in Grouping.
In Columns the Service description and the Service Perf-O-Meter are specified.
The rule for the matrix layout is:
The Grouping columns are used as headings for the vertical columns.
The first normal column on the left provides the titles for the lines.
All further normal columns are shown in the cells.
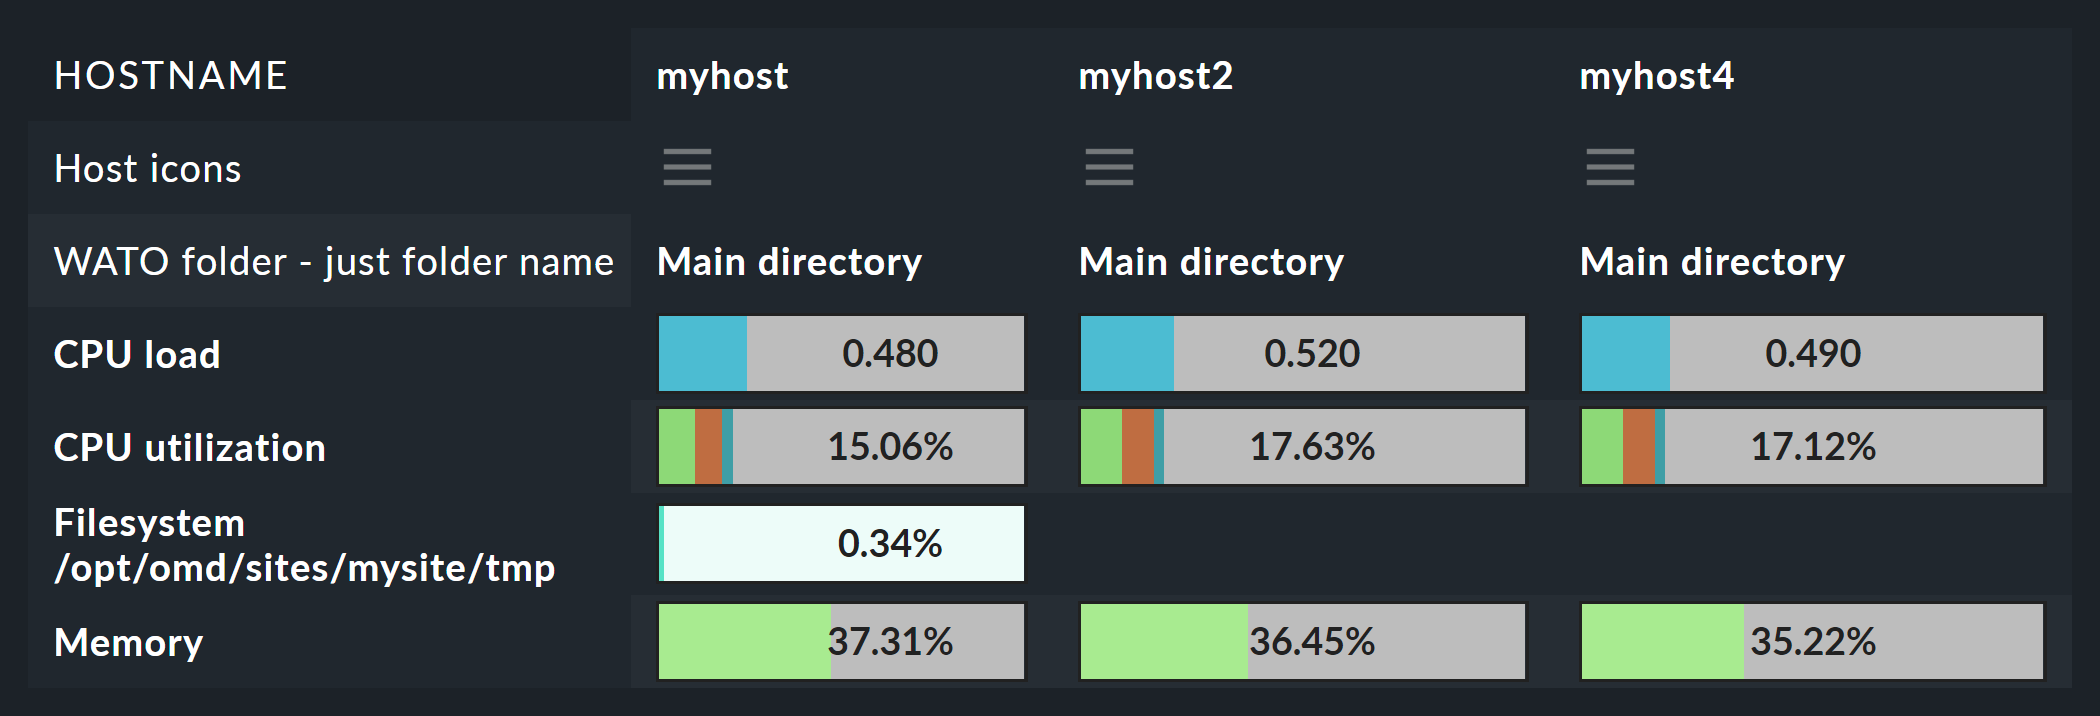
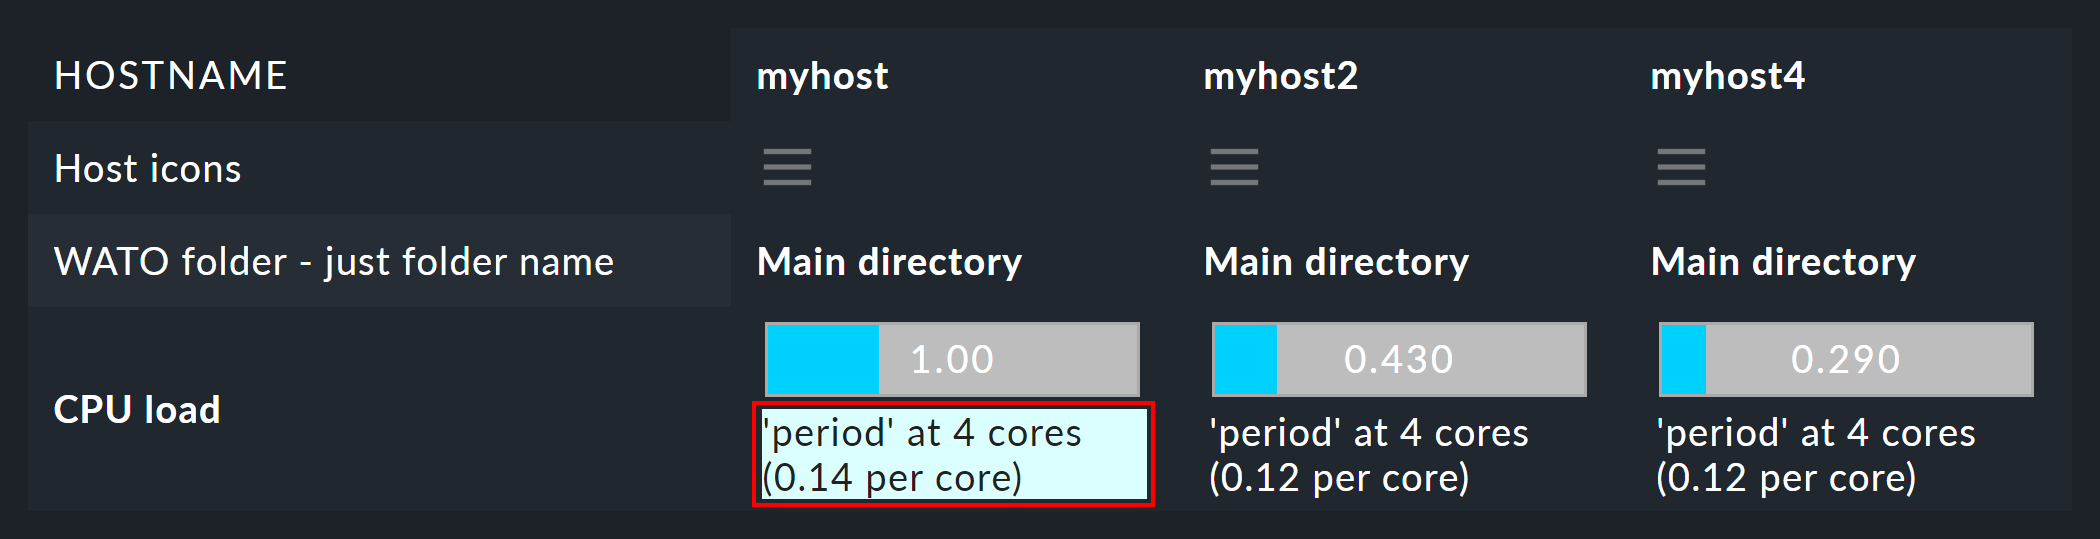
If, for example, you wish to display more information regarding the host, simply add more columns in the Grouping section. Thus the table from above will look like this when you insert the Host icons and WATO folder — just folder name columns:
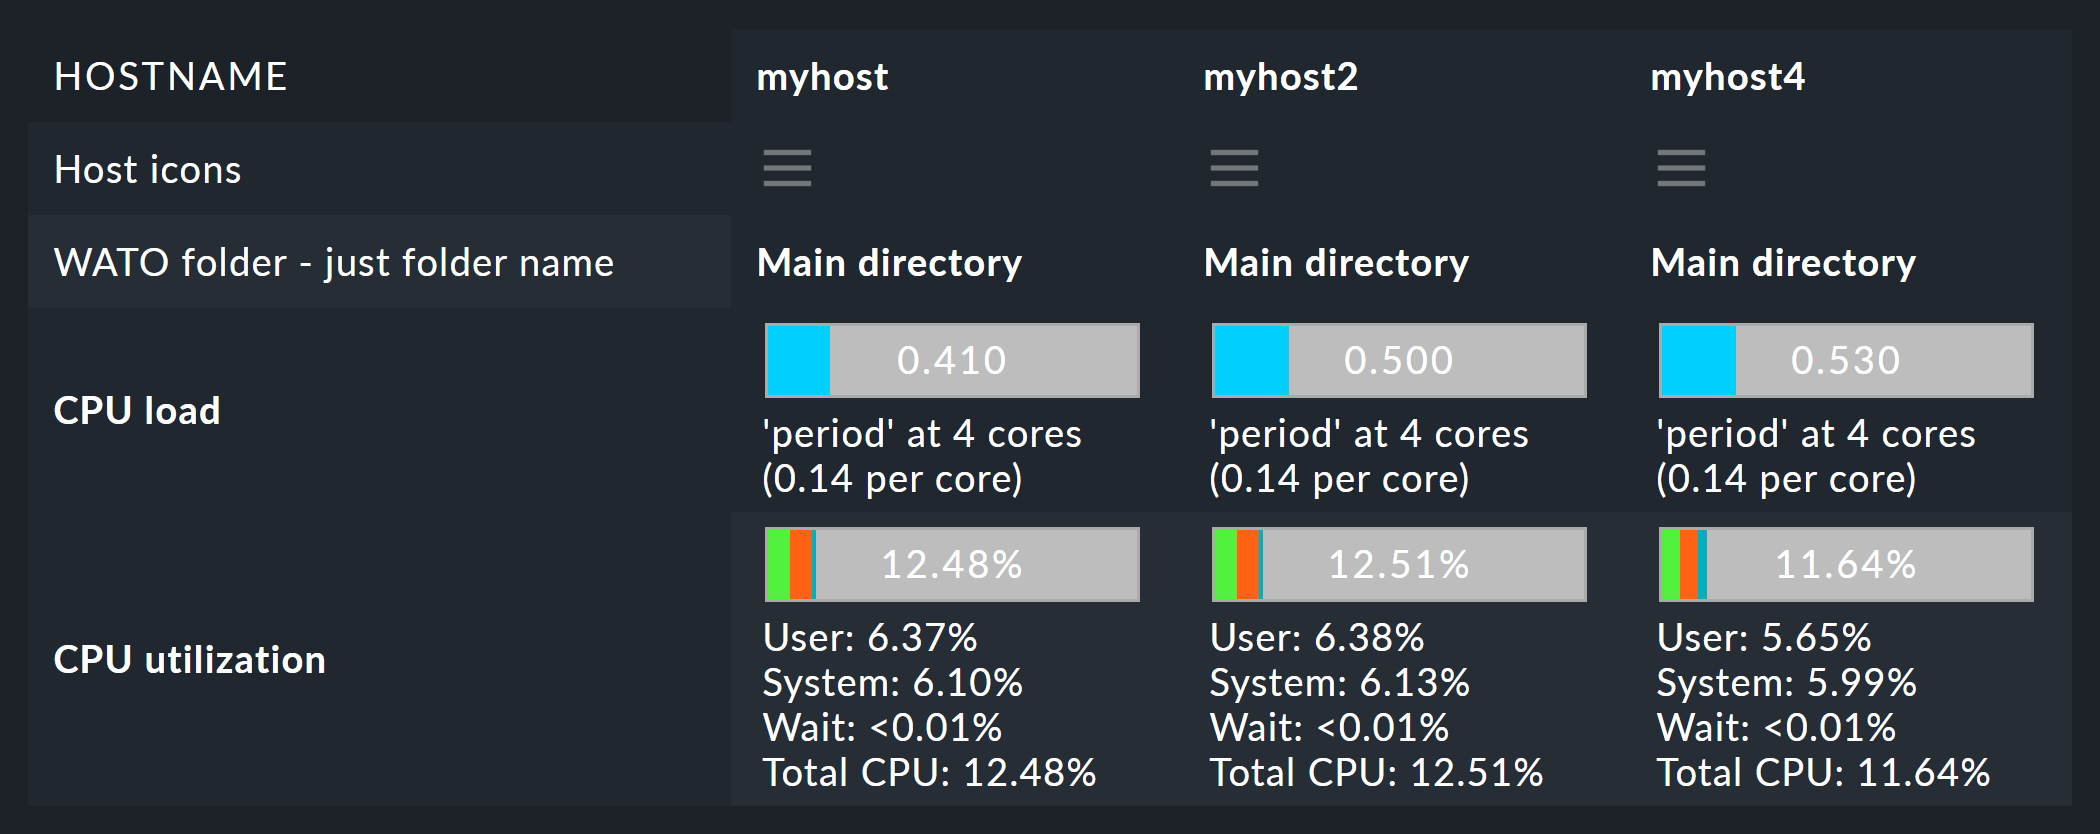
Further normal columns then land directly in the cells. The following example shows (abbreviated) the matrix with the additional Output of check plugin column:
5.1. Recognising outliers
Why do some cells have a coloured background? This points you to values lying outside the majority. This is actually not so meaningful for measurement data, but there are, for instance, users with a specially-constructed matrix who can tell at a glance if an incorrect contact group has been entered for certain hosts or services!
6. Alarm sounds
A view can sound an alarm tone over the browser if at least one problem appears in the table (a host that is not UP, or a service that is not OK). This primitive type of alarm is, for example, interesting for control centres where there is always a list of problems on a screen that the operator doesn’t want to have to constantly stare at.
The alarm sounds are by default deactivated. You can switch them on with the Global settings > User interface > Enable sounds in views global switch. As always the search field helps here:

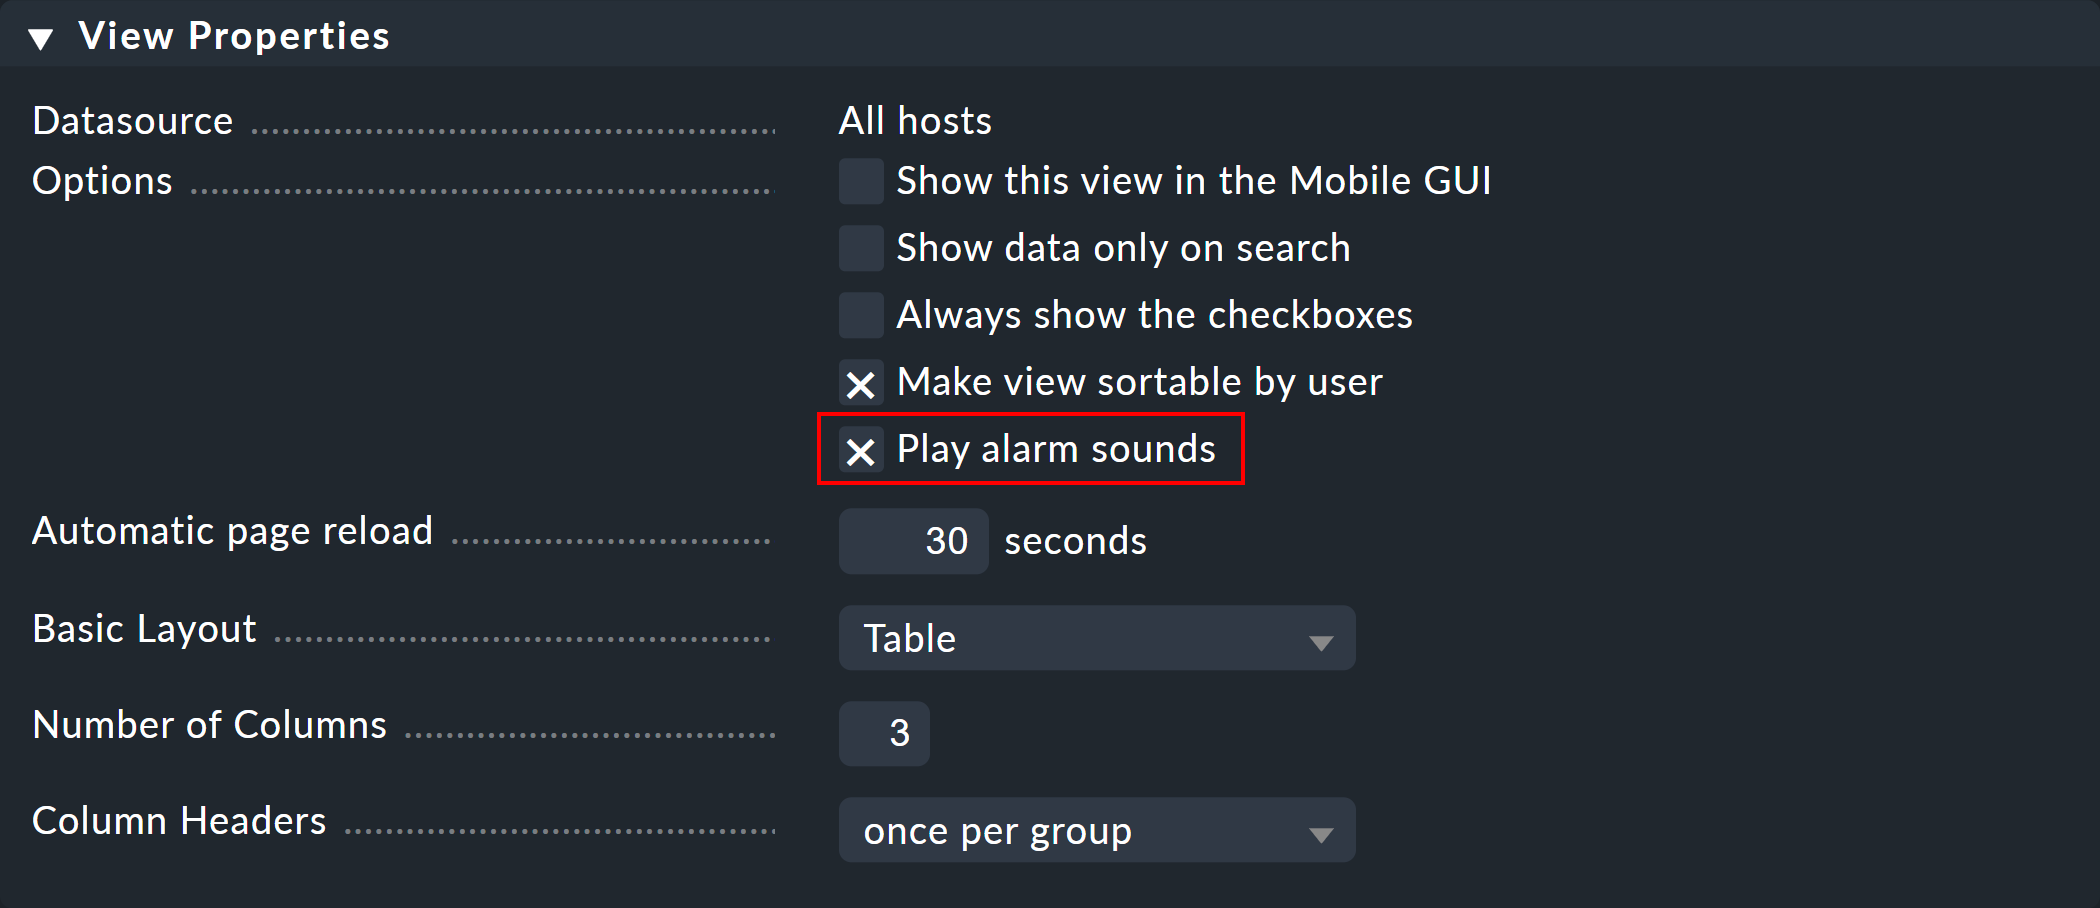
Sounds will not be heard in all views, rather only in those for which alarm sounds have been activated in View Properties:
7. Embedding views in external websites
Since every view is accessible via a URL you can also embed these in other
websites, for example, via an <iframe>. A number of elements in
a view could however make no sense or even be distracting in such a context. In a
situation like this you can attach a display_options=… variable to the
URL, via which you can precisely control which component of the view
should not be generated in HTML code.
Important: The Checkmk navigation is also usually rather undesirable when embedding, so before you manually set options in a view, let the page be displayed without navigation and sidebar via Display > This page without navigation.
Every component is coded with a letter and can accordingly be excluded using these.
The following letters have been defined:
| Option | Effect |
|---|---|
t |
Title bar (with heading, breadcrumbs, countdown symbol for page update), menu bar and actions bar are omitted. |
b |
Menu items and action buttons that link to other views are omitted. |
f |
Menu item Display > Filter and its corresponding |
c |
Menu item Commands and its corresponding buttons are omitted. |
o |
The options Number of columns and Refresh interval are omitted. |
d |
Menu item Display > Modify display options is omitted; otherwise is callable via Display > Modify display options. |
e |
Menu item Display > Customize View is omitted. |
r |
The Javascript code for the automatic refresh and the corresponding icon are omitted. |
s |
The playing of alarm sounds for the WARN and CRIT service states is suppressed. |
i |
Links to other views are omitted, e.g. the links in the Service column in service views. |
m |
With this option links are assigned the |
l |
Links in column headings are omitted. |
w |
Limit and live status error messages. |
For example — if you want to switch off all control elements and buttons and
only display the actual table, a link on the allhosts view will look
like this:
/myserver/mysite/check_mk/view.py?view_name=allhosts&display_options=til
8. Adding your own icons and actions
In views of hosts and services you will also see a column for icons, and in this
the ![]() Action menu icon with which you can select host or
service actions. You can also add your own icons to views. These can be used
simply for visualization, or your own actions can be assigned to them.
Action menu icon with which you can select host or
service actions. You can also add your own icons to views. These can be used
simply for visualization, or your own actions can be assigned to them.
For example, hosts with a graphic web interface can be quickly identified using such an individual icon and can also be controlled directly via a link.
The procedure for adding your own icons and actions is divided into three steps:
Upload the icons
Define the icons/actions
Assign the icons to hosts/services
Start with Setup > General > Custom Icons and upload a local file with a maximum size of 80x80 pixels. The icon will now be in the system, but will not yet be in use.
Next you will need to define the icon as an object that can be addressed via rules, and optionally, an associated action. You can find the settings for this under Setup > General > Global settings > User Interface > Custom icons and actions. Create a new entry here using Add new element, and define ID, Icon and a title. The title will later be displayed as a tool tip directly on the icon via a mouse-over-effect, and is therefore indispensable for users.
Now it gets interesting with the Action option. Action is equivalent to a
URL, and for this you can make use of some variables such as $HOSTNAME$ or
$SERVICEDESC$ (service-description) — you can get further information
from the online help. A valid action would be, for example:
view.py?host=$HOSTNAME$&site=mysite&view_name=host
This action simply calls the standard host view for the corresponding host on the site mysite.
With a check mark at Show in column you can then display the icon as an
independent icon next to ![]() , otherwise your action will end up
in this action menu.
, otherwise your action will end up
in this action menu.
In the final step, you now determine which hosts or services the new icon is to be displayed for — specifying these using rules of course. You can find the two rules, Custom icons or actions for hosts in status GUI and Custom icons or actions for services in status GUI in the Setup menu under Host monitoring rules and Service monitoring rules.
Create a new rule in the desired folder and set at least two options in it. First select the icon just created under Custom icons or actions for hosts in status GUI:
Then set the filter in the Conditions area for the desired hosts/services.
Finally, save and confirm the changes.
In host and service views you will now be able to see your new icon next to or in the action menu for the filtered hosts and services.