1. Introduction
Metrics are the measurable and computable values relating to hosts and services and these are stored internally by Checkmk in the so-called Round-Robin Databases (RRDs).
These metrics are processed by the built-in graphing system and visualized in the Checkmk web interface in many places, for example as Perf-o-meters in the list of services or as graphs that you can display from the service list using the ![]() graph icon.
The interface for visualizing the metrics is based on HTML5 and is identical in the Enterprise Editions and the Raw Edition.
See the Graphing article for full details on this subject.
graph icon.
The interface for visualizing the metrics is based on HTML5 and is identical in the Enterprise Editions and the Raw Edition.
See the Graphing article for full details on this subject.
![]() In parallel to the graphing built into Checkmk, you can additionally connect to external metrics databases and send the metrics to InfluxDB or Graphite.
Since the forwarding is done by the Checkmk Micro Core (CMC), this feature is only available in the
In parallel to the graphing built into Checkmk, you can additionally connect to external metrics databases and send the metrics to InfluxDB or Graphite.
Since the forwarding is done by the Checkmk Micro Core (CMC), this feature is only available in the ![]() Checkmk Enterprise Editions.
Checkmk Enterprise Editions.
In this article you will learn how to set up the forwarding of metrics to InfluxDB and Graphite in Checkmk.
2. Sending metrics to InfluxDB
InfluxDB is an open-source database management system (DBMS) for time series — and is currently the most popular solution in this segment. Starting with its V2.0, InfluxDB provides a new unified API — the InfluxDB v2 API — that can be used to write metrics data to the database, among other functions. Checkmk uses the InfluxDB v2 API and provides you with the ability to not only send the metrics from Checkmk to InfluxDB, but also store them appropriately in InfluxDB’s existing structure. By using the API, on the one hand the configuration for sending the metrics data is simplified and on the other hand Checkmk is prepared for future extensions.
Important: The configuration described in this chapter only applies to the connection of an InfluxDB V2.0 (or later), as the InfluxDB v2 API is only available from this version onwards. If you are using an InfluxDB <= V1.8, then set it up as described in the chapter on Graphite connection instead, since InfluxDB supports the carbon protocol in Graphite up to V1.8.
2.1. Gathering information
Before you get started with the setup in Checkmk, you should get the following information for the InfluxDB target system you want to connect to Checkmk:
| Parameter | Description |
|---|---|
Host name |
Name (or IP address) of the InfluxDB server. Entering the DNS name is especially important if the connection is encrypted over HTTPS, since certificates are almost never issued for IP addresses. |
Port number |
Number of the TCP port through which the InfluxDB server can be reached. The default port is |
Protocol |
|
Organization |
In InfluxDB the Organization is the workspace for multiple users. The initial organization is requested during InfluxDB setup. Additional organizations can be created manually via the InfluxDB GUI. |
Buckets |
InfluxDB stores time series data in containers, called buckets. In particular, a retention period is defined for each bucket. InfluxDB automatically deletes all data points older than this period. |
Token |
Communication between Checkmk and InfluxDB is done via the InfluxDB v2 API. InfluxDB uses API tokens to authorize requests via API. An API token belongs to a specific user and identifies InfluxDB permissions within the user’s organization. Tokens are created through the InfluxDB GUI, either with full read and write access to all resources within an organization (All Access Token) or with selected access rights to specific containers within an organization (Read/Write Token). A token can be copied to the clipboard, making it easier to paste later during Checkmk configuration. The token used to connect to the Checkmk server should of course have read and write permissions for the container being configured in Checkmk. |
For more details, see the InfluxDB documentation.
With this information at hand, the configuration in Checkmk is accomplished with only two straightforward operations.
2.2. Connecting Checkmk to InfluxDB
Open the Setup menu and activate the Show more mode — because only then will the Setup > Exporter > InfluxDB Connections menu item be displayed. Select this to display the list of existing InfluxDB connections. Since you probably haven’t configured anything here yet, this list will be empty.
A connection is a prerequisite for sending the data. However, without the rule to select metrics information, no data will be sent.
So first create a new connection with ![]() Add connection:
Add connection:
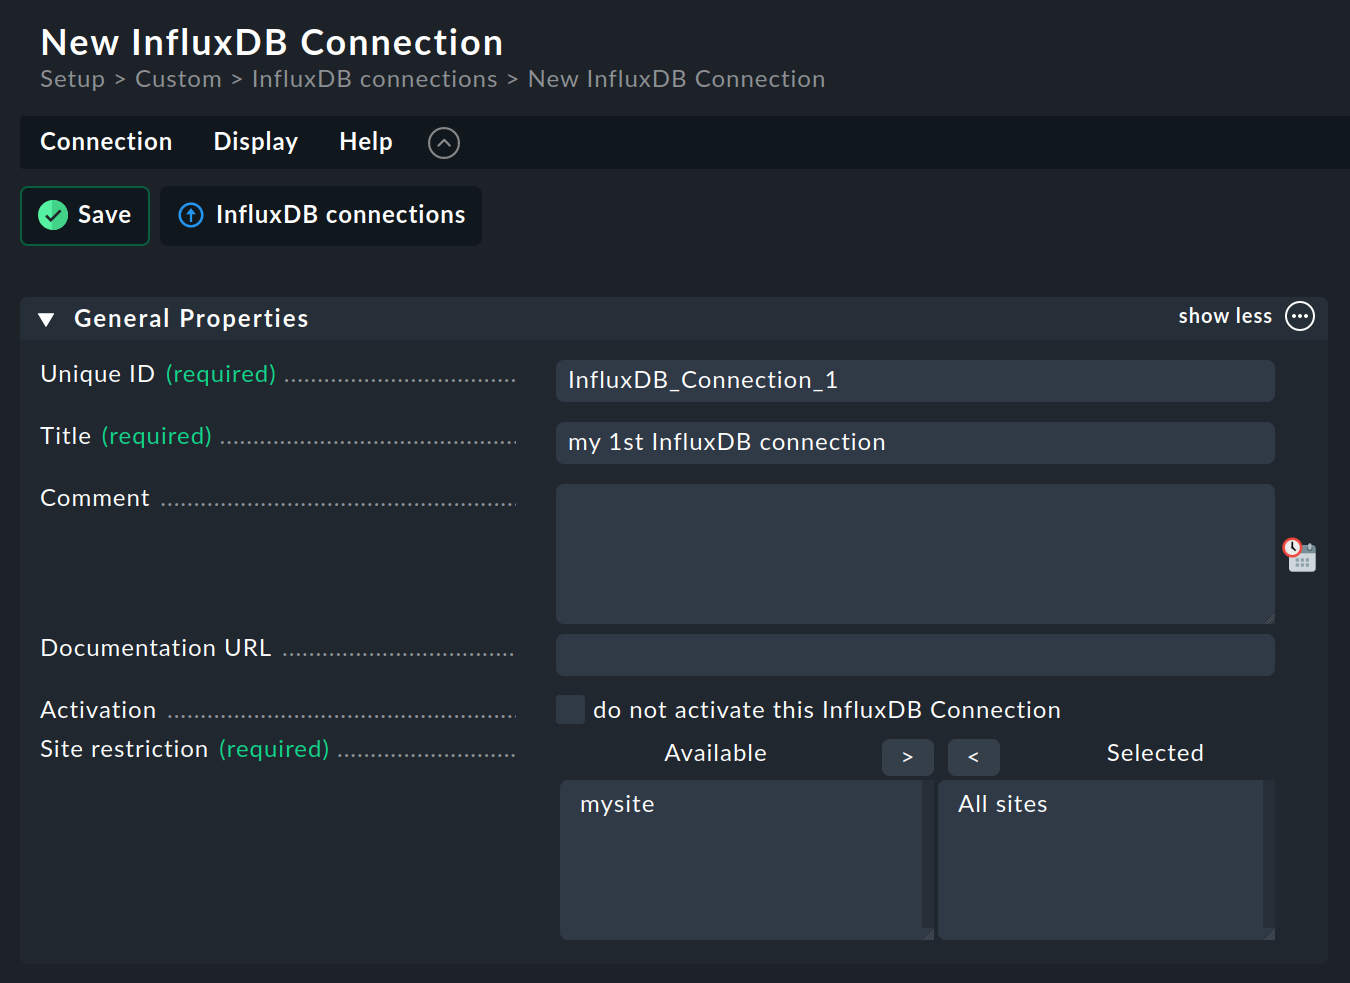
In the General Properties, you specify the internal ID and title for the connection, as usual.
If there are other sites connected to the current site, as is the case with a distributed monitoring, you can restrict the connection to specific sites under Site restriction. To do this, first move the All sites entry to the left column and then move the sites that should receive metrics from the left to the right Selected column. The sites that will not receive metrics then remain in the left column.
We then continue in the next box with the InfluxDB Connection Properties:
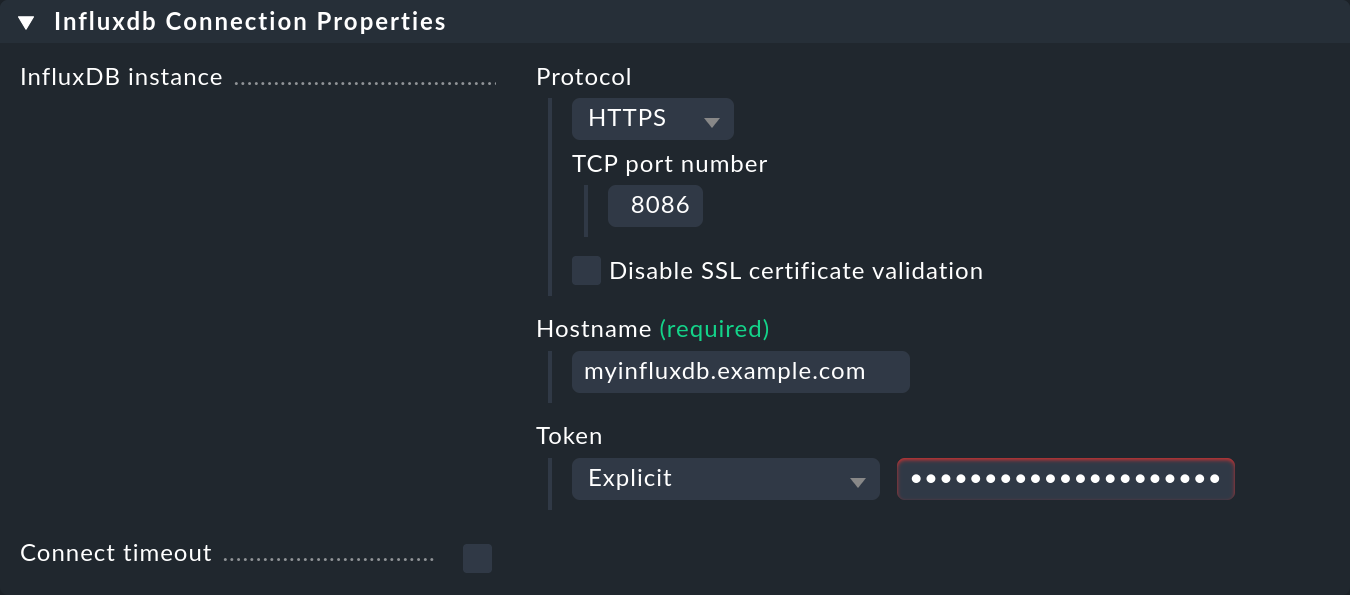
Here enter the first set of parameter values you compiled in the previous section.
Save the connection with Save and you will return to the list of connections:
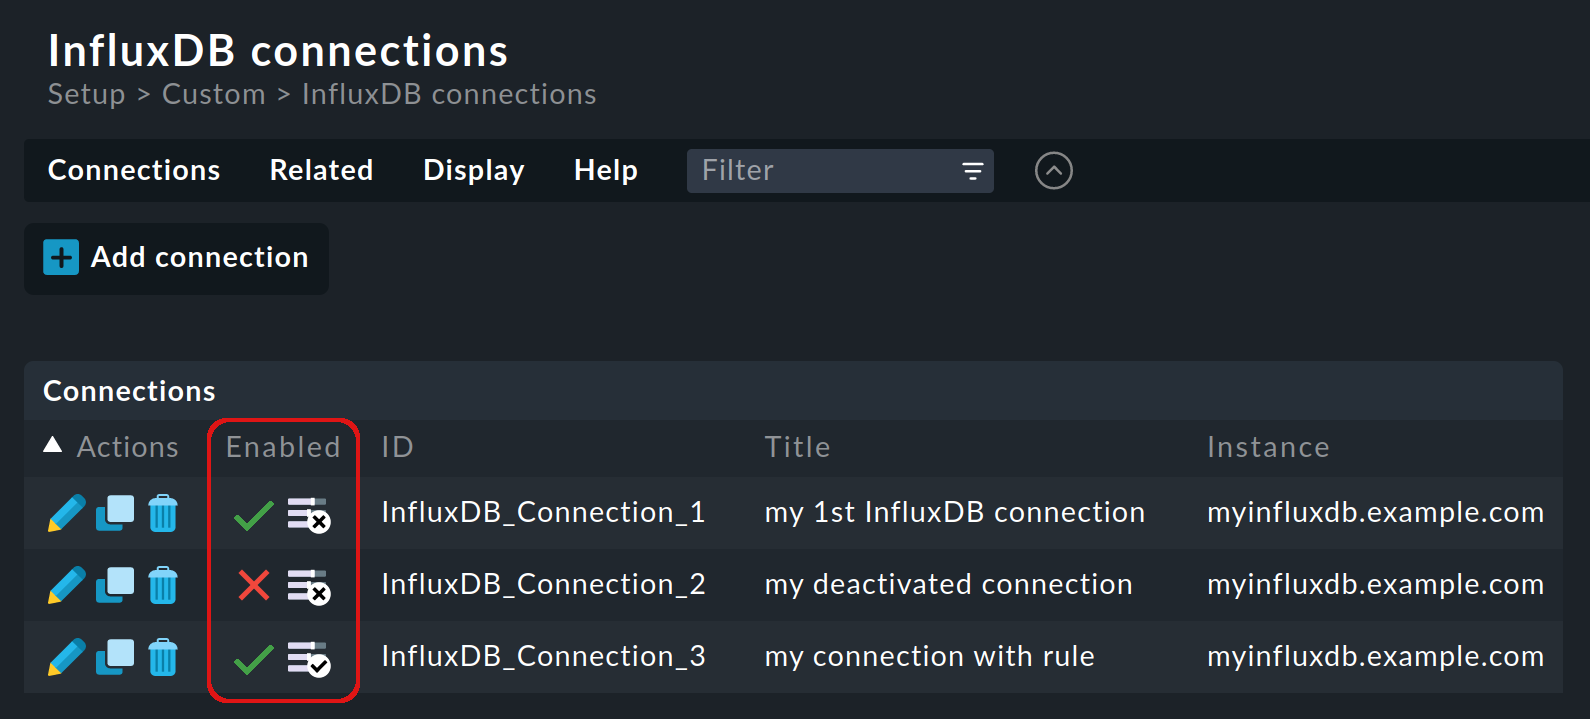
In the connection list, the Enabled column shows important information about the state of the connection.
Don’t be surprised to see three entries in the list in the above screenshot:
To be able to see all of the symbols in action, we have added two more connections to the list.
From the first column in Enabled you can see whether the connection is ![]() enabled, or is
enabled, or is ![]() disabled.
In the second column you can see whether there is already a rule for
disabled.
In the second column you can see whether there is already a rule for ![]() the connection, or
the connection, or ![]() not.
not.
No data will be sent over a connection until it has been associated with a rule that selects the metrics information.
This rule is called Send metrics to InfluxDB.
The rule icons are buttons and provide a shortcut to rule creation.
For a connection with a rule, click ![]() to open the rule set overview page, which highlights which rule takes or would take effect for the connection.
For a connection without rules, clicking
to open the rule set overview page, which highlights which rule takes or would take effect for the connection.
For a connection without rules, clicking ![]() takes you directly to the rule creation page.
takes you directly to the rule creation page.
In the following chapter we will describe in detail what can be specified in this rule.
2.3. Selecting metrics information
With a rule you determine in Checkmk which data is sent to the InfluxDB server and where it is stored.
The Send metrics to InfluxDB rule set can be found in Setup > Services > Service monitoring rules, can be accessed more quickly with the search in Setup menu, and quickest by clicking in the connection list:
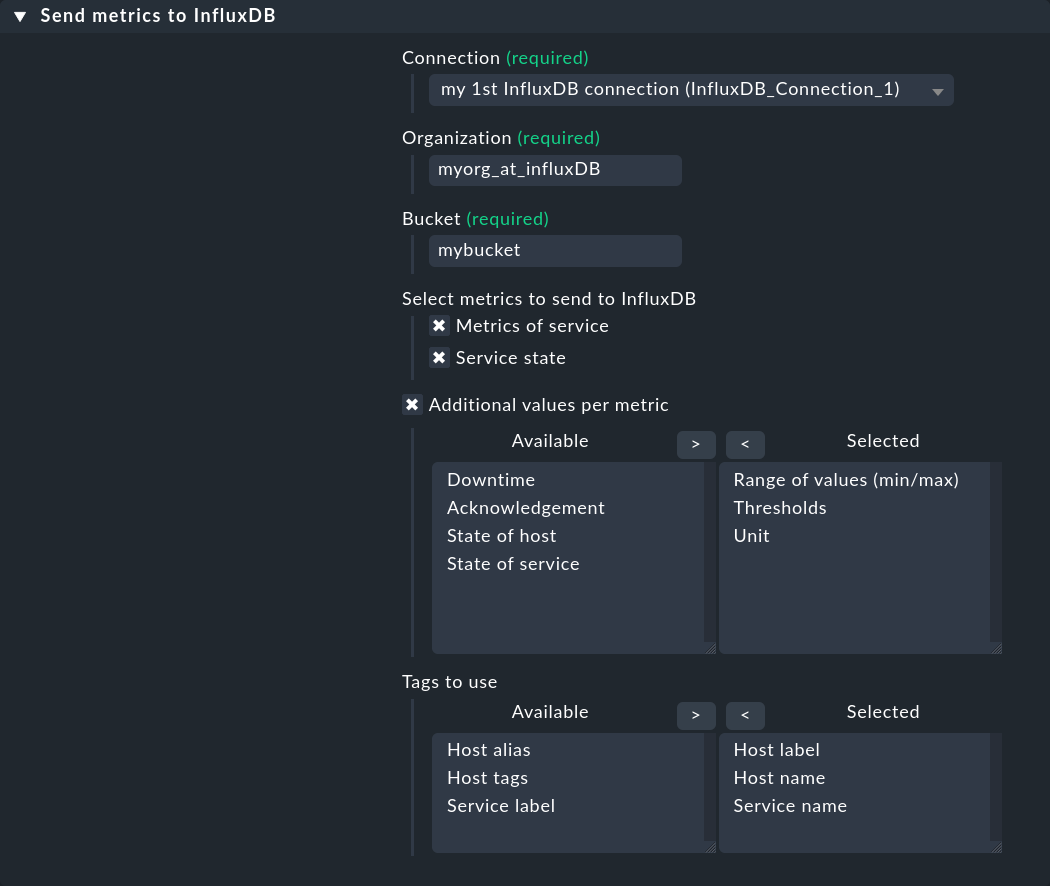
In the Send metrics to InfluxDB box, first select the connection created in the previous section and then specify where the data will be stored on the InfluxDB server. Here, enter the second set of collected information for the InfluxDB server. Use Organization to decide which users receive the data, and Bucket to decide how long the metrics are kept. Multiple selection is not possible, i.e. you cannot send the metrics to multiple buckets for use by different organizations, for example.
Below you select the metrics data that will be sent from Checkmk to the InfluxDB server. Metrics of service is already selected by default and enables the sending of metrics. Checking the Service state checkbox will send the service state as its own metric.
After enabling Additional values per metric you can add a number of meta-data to the metrics for display purposes, e.g. the State of service and the Thresholds. Note here that Unit currently only works for metrics from active checks if these support it. The reason is that only active checks have an option to supply the unit and the CMC has no access to others.
In the last selection menu, Tags to use, meta data such as host tags or labels are added to the metrics, which are mainly used for filtering and have been optimized for this purpose. The Host name and Service name selected by default are mandatory entries that cannot be deselected.
In InfluxDB, the Additional values per metric are stored as fields and the Tags to use are stored as tags.
Finally, activate the changes to create the connection and create the rule(s). In the event of problems with the transmission of metrics, see the information on diagnosing errors below.
2.4. Displaying metrics in InfluxDB
Once the metrics from Checkmk have arrived at the InfluxDB server, they can be displayed in the InfluxDB GUI.
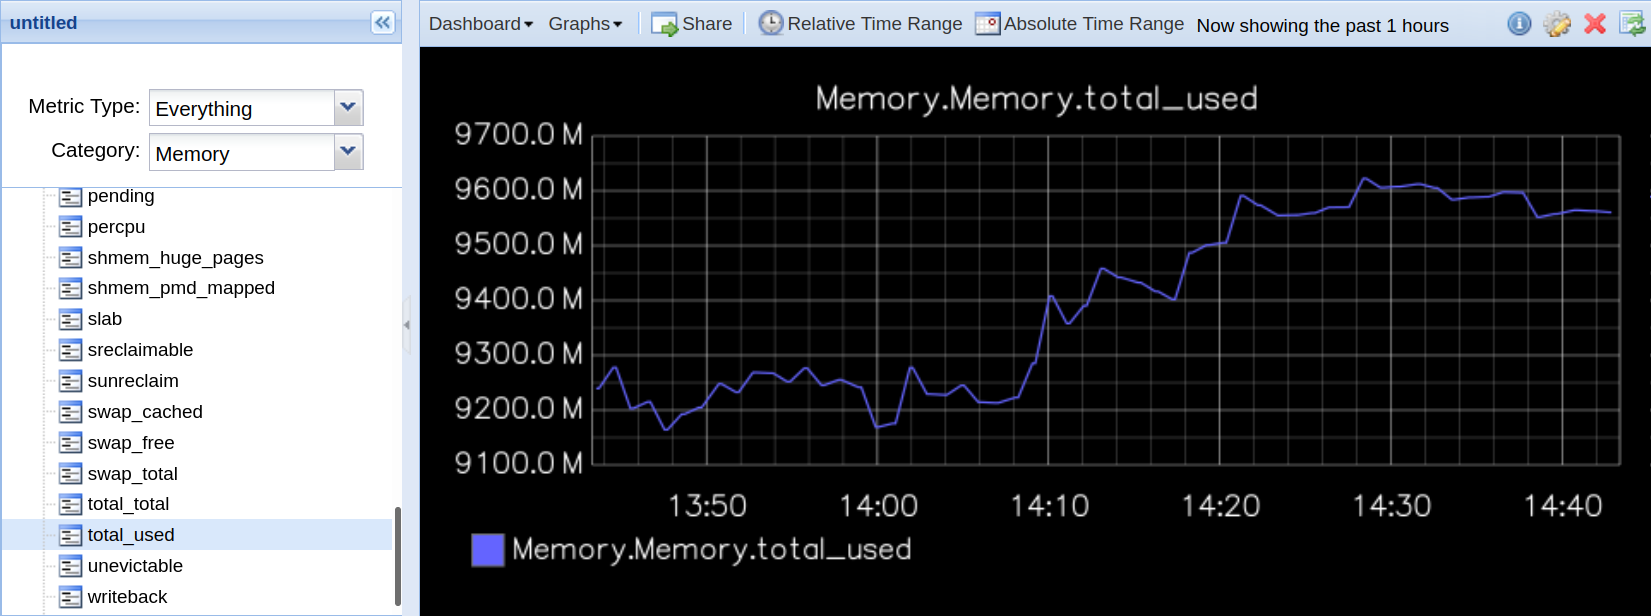
As an example, the following image shows the graph for the total_used metric, which shows the amount of memory used:
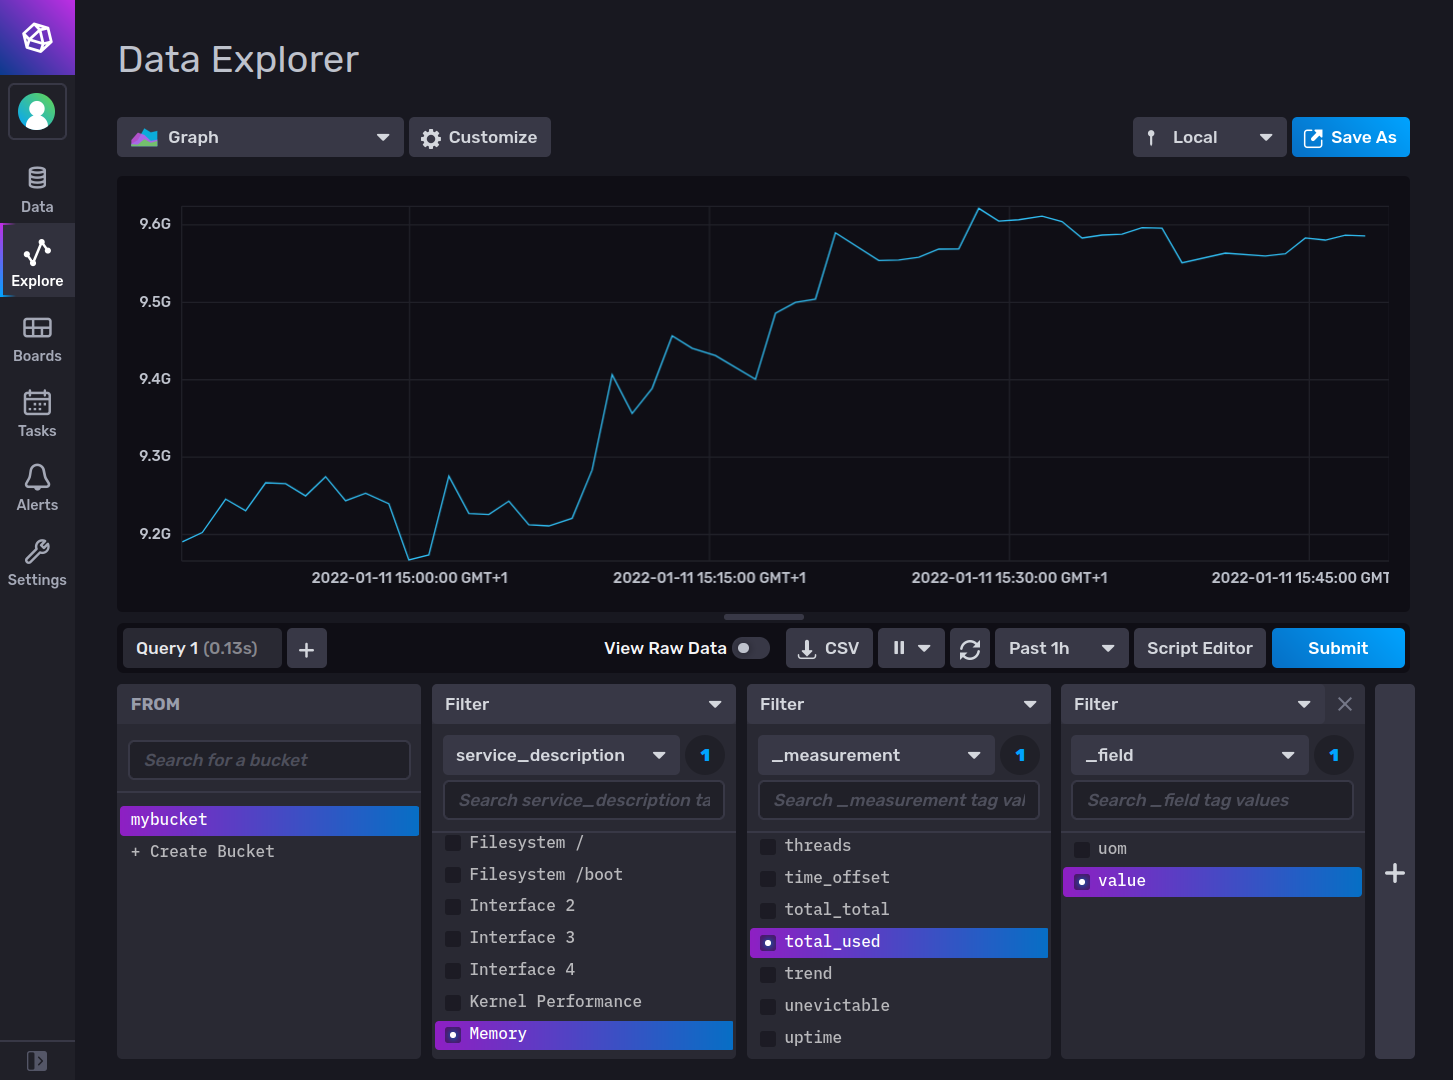
Note: This metric can be found in Checkmk at the Memory service under the metric named Total used memory.
3. Sending metrics to Graphite
Graphite is also a well-known open-source time series DBMS for storing, retrieving, sharing and visualizing metrics.
Graphite consists of the Carbon daemon, which waits for the data and stores it in a database, from where it is processed and displayed as graphs using the Graphite web application.
You can use Checkmk to forward the metrics in the plaintext protocol to Graphite’s Carbon daemon, which waits for data from this protocol on port 2003.
In the plaintext protocol, a record is very simply structured in the format <metricpath> <value> <timestamp>, where <metricpath> is a unique identifier separated by periods.
Unlike the InfluxDB connection, by default all metric data is sent as soon as a graphite connection has been enabled. If you don’t want this, you should select the metrics by rule before enabling the connection, and then enable both the rules and the connection together.
3.1. Selecting metrics information
In Checkmk under Setup > Services > Service monitoring rules you will find the two rule sets Send host metrics to Graphite and Send service metrics to Graphite. The configuration is carried out in the same way for host and service metrics. We show the configuration for service metrics here. You then set up the host metrics in the same way.
You can use the Send service metrics to Graphite rule to select the values to be sent with the metrics:
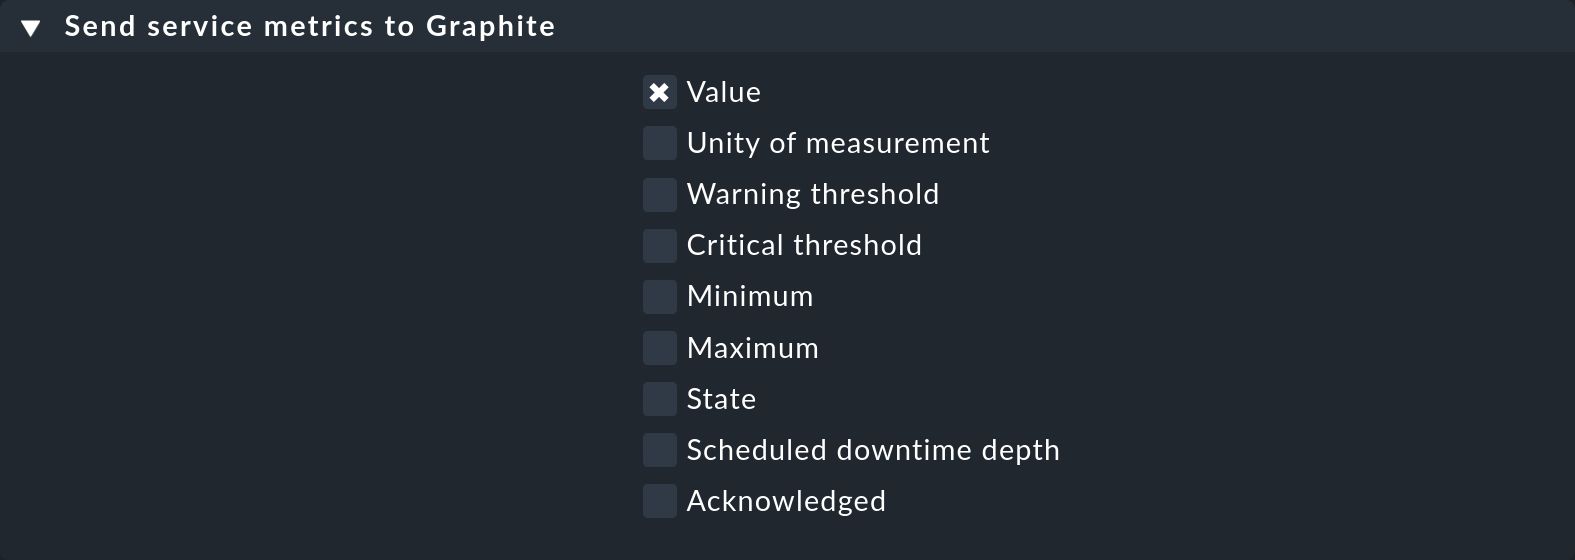
Secondly, you can restrict sending to certain hosts and services in the Conditions box. Since without a restrictive rule all data will be sent, it is recommended to first create a rule that disables sending globally by unchecking all of the check boxes shown in the above screenshot. Next, create a specific rule with the desired metric information for the hosts and services whose metrics should be sent to the Graphite server. Sequence the specific rule before the global rule:
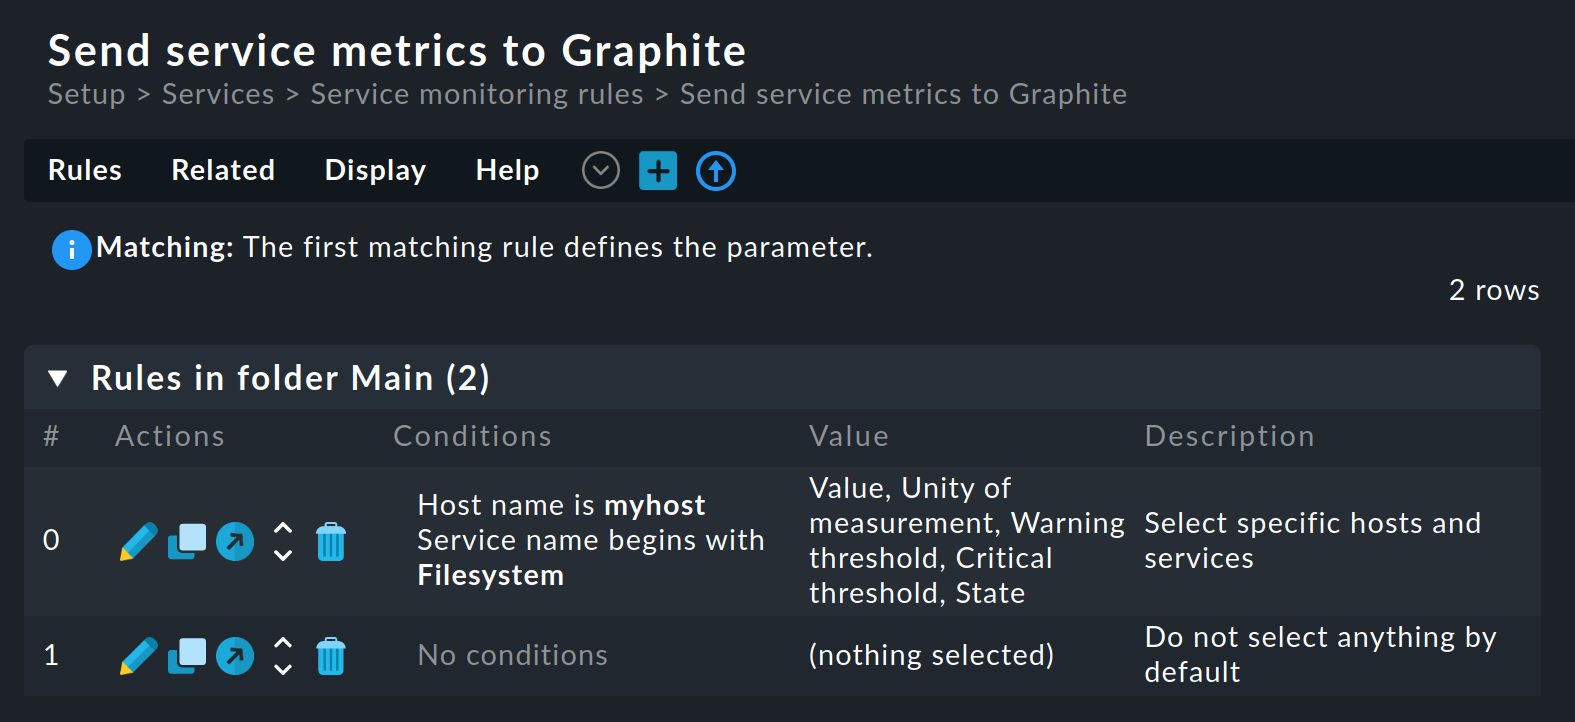
myhost will be sent3.2. Connecting Checkmk with Graphite
You set up the connection to the Graphite server under Setup > General > Global Settings > Monitoring Core > Send metrics to Graphite. Click there on Add new Graphite connection:
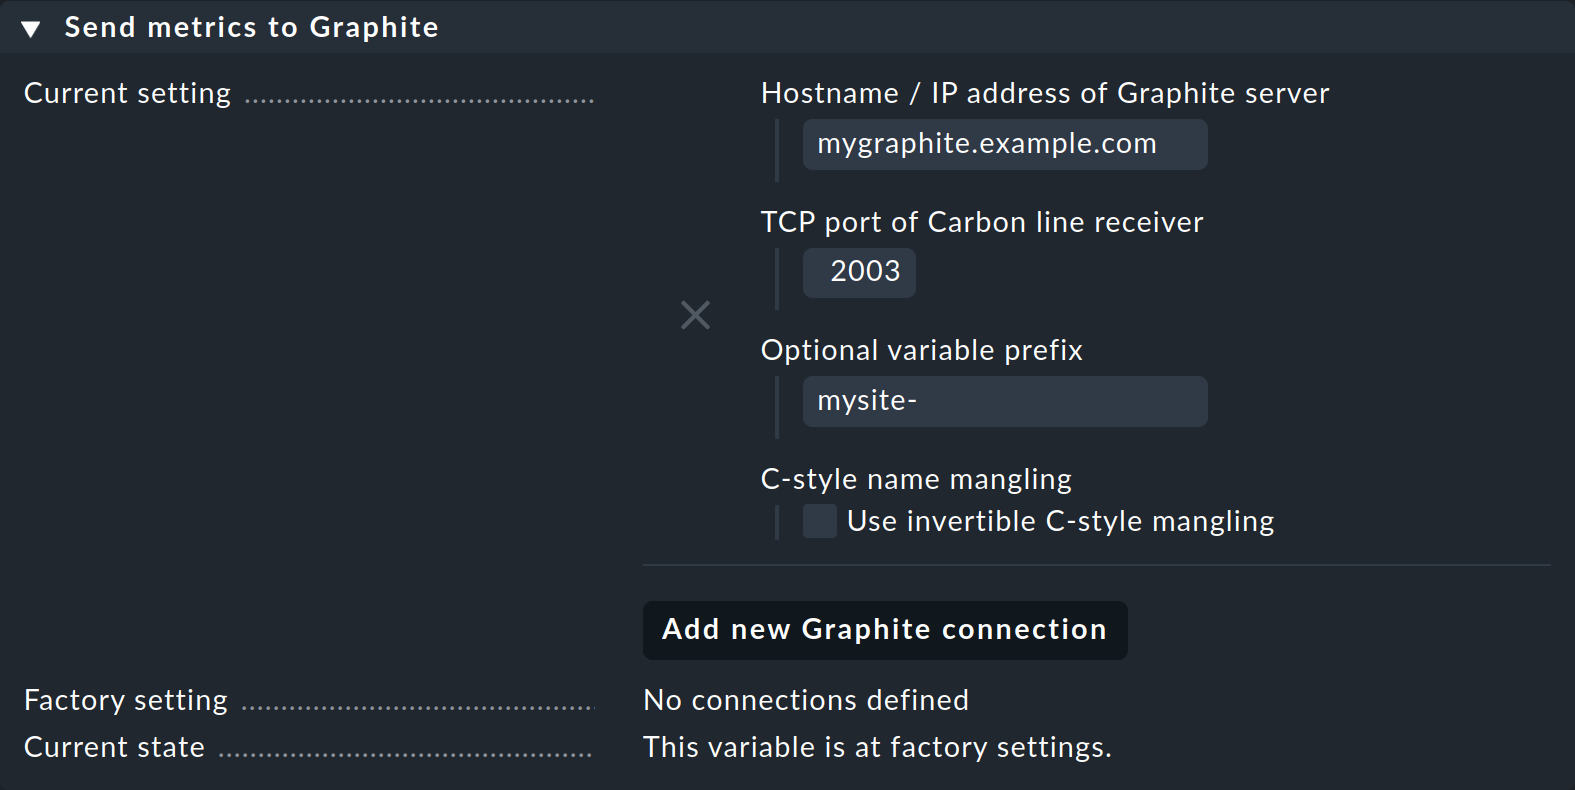
In addition to the obvious Graphite server details (the port name and number for the Carbon plaintext protocol), you can also use Optional variable prefix to configure a prefix to be added to each host name, e.g. to enforce unique names.
Checkmk sets the metric path for the plaintext protocol to <host>.<service>.<metric>.
An activate changes for the rules and connection completes the configuration for Graphite.
3.3. Displaying metrics in Graphite
In the Graphite GUI you can also view the metrics received from Checkmk.
The following image shows the graph for the total_used metric that we have already shown above as an example in the InfluxDB GUI:
4. Error diagnosis
If the metrics do not arrive where you expect them to, you can find the diagnostic information from your site in the ~/var/log/cmc.log file — the Checkmk Micro Core’s log file.
The following example shows the messages if the bucket configured in Checkmk does not exist on the InfluxDB server:
2022-01-10 11:41:35 [5] [influxdb https://myinfluxdb.example.com:8086] Successfully initiated connection
2022-01-10 11:41:36 [5] [influxdb https://myinfluxdb.example.com:8086] Successfully connected
2022-01-10 11:41:36 [3] [influxdb https://myinfluxdb.example.com:8086] POST [404] {"code": "not found", "message": "bucket \"my_bucket\" not found"}
2022-01-10 11:41:36 [5] [influxdb https://myinfluxdb.example.com:8086] Closing connection
The following example shows the messages received when a connection to the Graphite server fails:
2021-12-15 17:33:33 [5] [carbon 10.0.0.5:2003] Successfully initiated connection
2021-12-15 17:33:33 [4] [carbon 10.0.0.5:2003] Connection failed: Connection refused
2021-12-15 17:33:33 [5] [carbon 10.0.0.5:2003] Closing connection
The Checkmk Micro Core keeps trying to connect on its own in such situations.
Important: For performance reasons metrics that are generated during a time when there is no connection to the target system are not cached, but are lost (or are then only available in the Checkmk RRDs).
Note: If the log messages are not meaningful enough for you, you can change the default values for the log level under Setup > General > Global Settings > Monitoring Core > Logging of the core. Here you can find entries for the logging of InfluxDB (InfluxDB processing) and for Graphite (Carbon connections).