1. Introduction
Probably not everybody has the same understanding of the term ‘distributed monitoring’. In fact monitoring is always distributed over multiple computers, unless the monitoring system is only monitoring itself – which wouldn’t be very useful.
In this User guide we therefore always refer to a distributed monitoring when the monitoring system as a whole consists of more than a single Checkmk site. There are a number of good reasons for splitting monitoring over multiple sites:
Performance: The processor load should, or must be shared over multiple machines.
Organization: Various different groups should be able to administer their own sites independently.
Availability: The monitoring at one location should function independently of other locations.
Security: Data streams between two security domains should be separately and precisely controlled (DMZ, etc.)
Network: Locations that have only narrow band or unreliable connections cannot be remotely-monitored reliably.
Checkmk supports various procedures for implementing a distributed monitoring.
Checkmk controls some of these as it is largely compatible with, or based on
Nagios (if Nagios has been installed as the core). Also covered are the
old NSCA process and the somewhat more modern mod_gearman.
Compared to Checkmk’s own system they offer no advantages and are also more
cumbersome to implement. For these reasons we don’t recommend them.
The procedure preferred by Checkmk is based on Livestatus and a distributed configuration environment. For situations with very separated networks, or even a strict one-way data transfer from the periphery to the center there is a method using Livedump, or respectively, CMCDump. Both methods can be combined.
2. Distributed monitoring with Livestatus
2.1. Basic principles
Central status
Livestatus is an interface integrated into the monitoring core which enables other external programs to query status data and execute commands. Livestatus can be made available over the network so that it can be accessed by a remote Checkmk site. Checkmk’s user interface uses Livestatus to combine all tethered sites into a general overview. This then feels like a ‘large’ monitoring system.
The following diagram schematically shows the structure of a monitoring with Livestatus distributed over three locations. The Checkmk Central Site is found in the central processing site. From here central systems will be directly controlled. Additionally, there are the Remote Site 1 and Remote Site 2 which are located in other networks and controlled by their local systems:
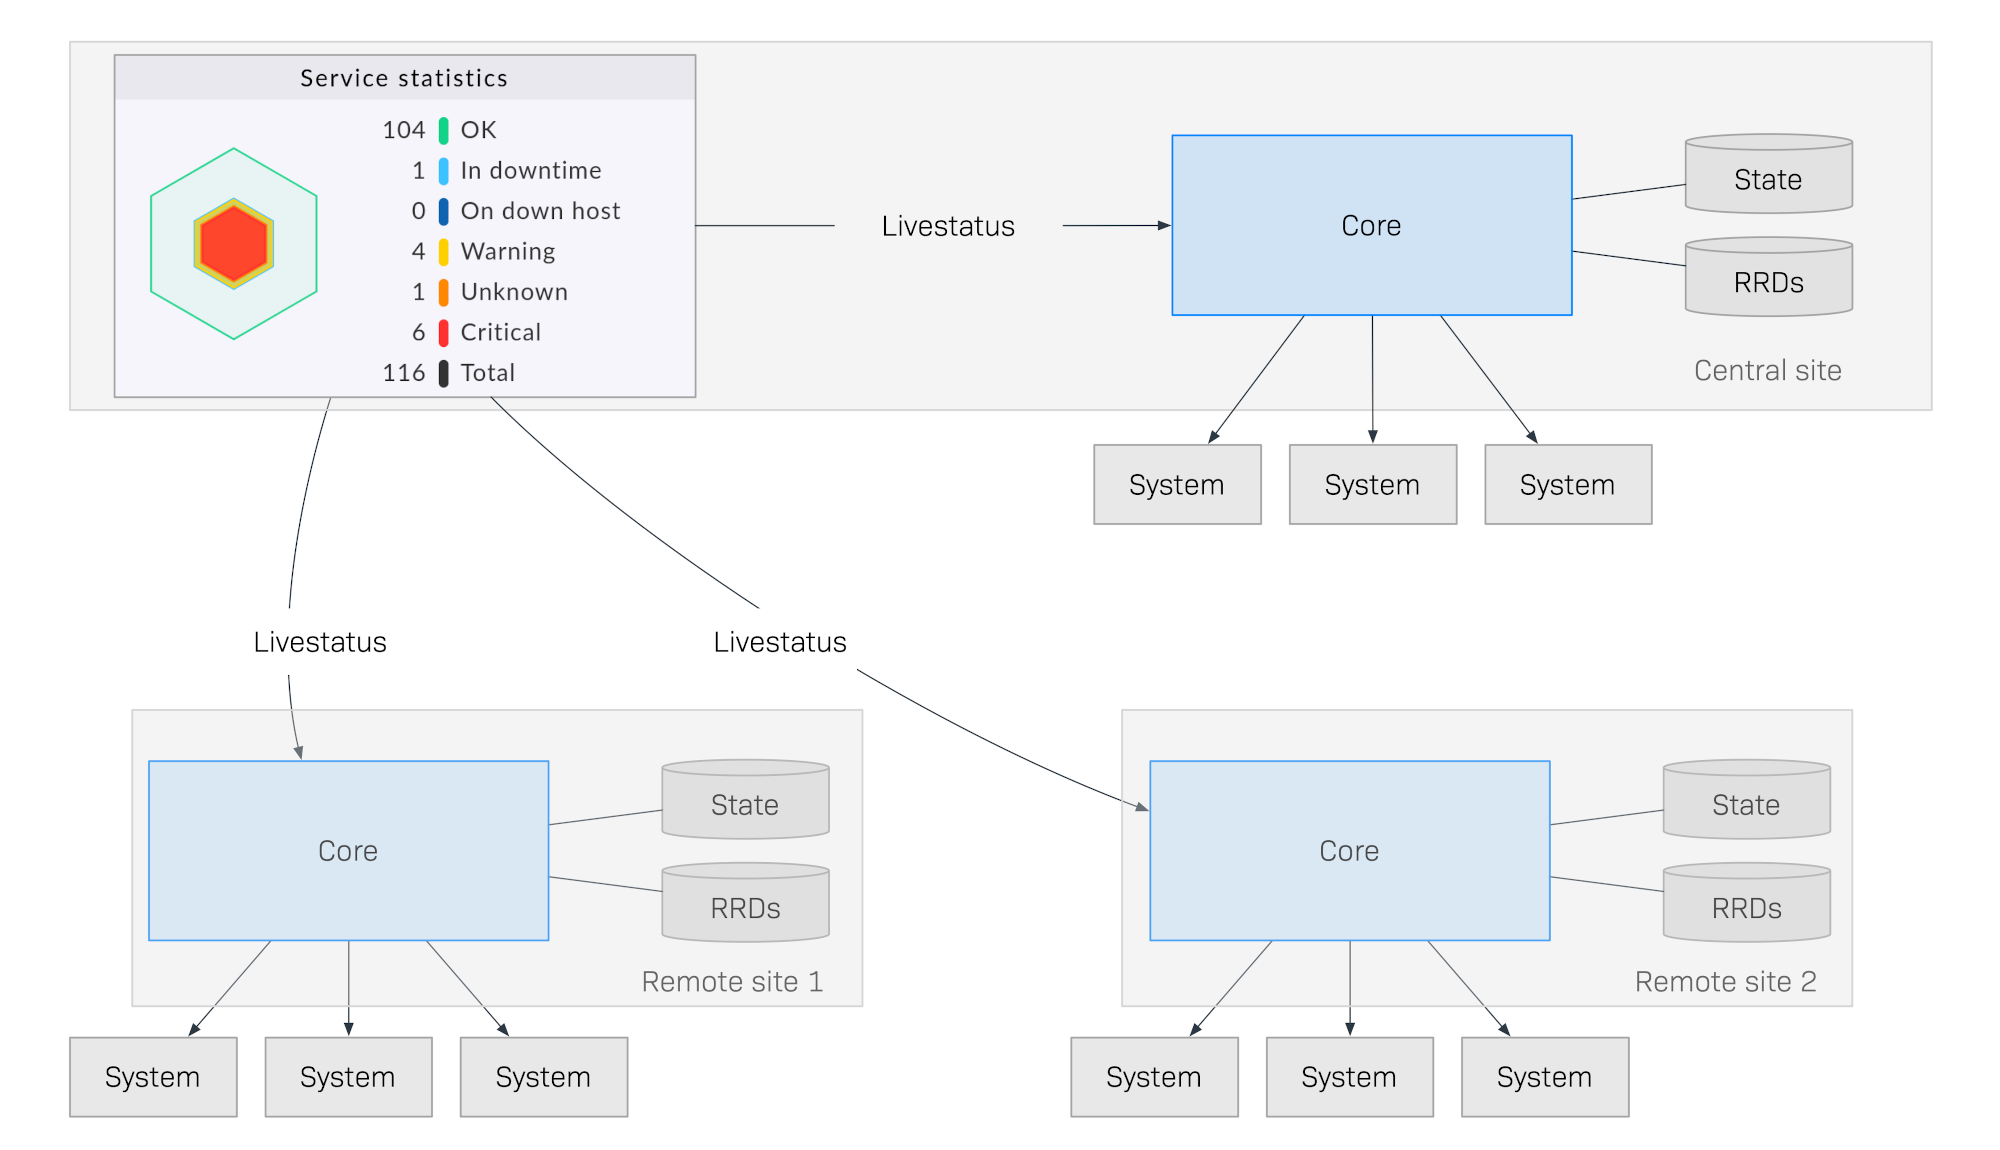
What makes this method special is that the monitoring status of the remote sites is not sent continuously to the central site. The GUI always only retrieves data live from the remote sites when it is required by a user in the control center. The data is then compiled into a centralized view. There is thus no central data holding, which means it offers huge advantages for scaling-up!
Here are some of the advantages of this method:
Scalability: The monitoring itself generates no network traffic at all between central and remote site. In this way hundreds of locations, or more, can be connected.
Reliability: If a network connection to a remote site fails the local monitoring nonetheless continues operating normally. There is no ‘hole’ in the data recording and also no data ‘jam’. A local notification will still function.
Simplicity: Sites can be very easily incorporated or removed.
Flexibility: The remote sites are still self-contained and can be used for the operating in their respective location. This is then particularly interesting if the ‘location’ should never be permitted to access the rest of the monitoring.
Centralized configuration
In a system distributed using Livestatus as described above, it is quite possible that the individual sites can be independently maintained by different teams, and the central site only has the task of providing a centralized dashboard.
In the case of multiple, or all sites needing to be administered by the same team, a central configuration is much easier to handle. Checkmk supports this and refers to such a configuration as a distributed configuration environment. With this all hosts and services, users and permissions, time periods, and notifications, etc., will be maintained and configured on the central site, and then depending on their tasks, be automatically distributed to the remote sites.
Such a system not only has a common status overview but also a common configuration, and effectively ‘feels like a large system’.
You can even extend such a system with dedicated viewer sites, for example, that serve only as status interfaces for sub-areas or specific user groups.
2.2. Installing a distributed monitoring
Installing a distributed monitoring using Livestatus/distributed configuration environment is achieved in the following steps:
First install the central site as is usually done for a single site
Install remote sites, and enable Livestatus via the network
Integrate the remote sites into the central site using Setup > General > Distributed monitoring
For the hosts and services, specify from which site they are to be monitored
Execute a service discovery for the migrated hosts, and then activate the fresh changes
Installing a central site
No special requirements are placed on the central site. This means that a long-established site can be expanded into a distributed monitoring without requiring additional modifications.
Installing remote sites and enabling Livestatus via the network
The remote sites are then generated as new sites in the usual way with omd create.
This will naturally take place on the (remote) server intended for the respective remote site.
Special notes:
For the remote sites, use IDs unique to your distributed monitoring.
The Checkmk-version (e.g. 2.0.0) of the remote and the central site is the same — mixed versions are not supported. The patch level (e.g. p11) may be different in the most cases. But in rare cases there will be an incompatibility even here. You are then obligated to stick to the exact version (e.g. 2.0.0p11) on all sites to allow both sites to work with each other without any problems. Please notice because of that always the incompatible changes at each patch version in the Werk list.
In the same way as Checkmk supports multiple sites on a server, remote sites can also run on the same server. Here is an example for creating a remote site with the name
remote1:
root@linux# omd create remote1
Adding /opt/omd/sites/remote1/tmp to /etc/fstab.
Creating temporary filesystem /omd/sites/remote1/tmp...OK
Updating core configuration...
Generating configuration for core (type cmc)...
Starting full compilation for all hosts Creating global helper config...OK
 Creating cmc protobuf configuration...OK
Executing post-create script "01_create-sample-config.py"...OK
Restarting Apache...OK
Created new site remote1 with version 2.1.0p17.cee.

  The site can be started with omd start remote1.
  The default web UI is available at http://myserver/remote1/

  The admin user for the web applications is cmkadmin with password: lEnM8dUV
  For command line administration of the site, log in with 'omd su remote1'
  After logging in, you can change the password for cmkadmin with 'cmk-passwd cmkadmin'.
The most important step is now to enable Livestatus via TCP on the network.
Please note that Livestatus is not per se a secure protocol and should only be
used within a secure network (secured LAN, VPN, etc.). The enabling appears
per omd config as an
site user on a stopped site:
root@linux# su - remote1
OMD[remote1]:~$ omd config
Now select Distributed Monitoring:
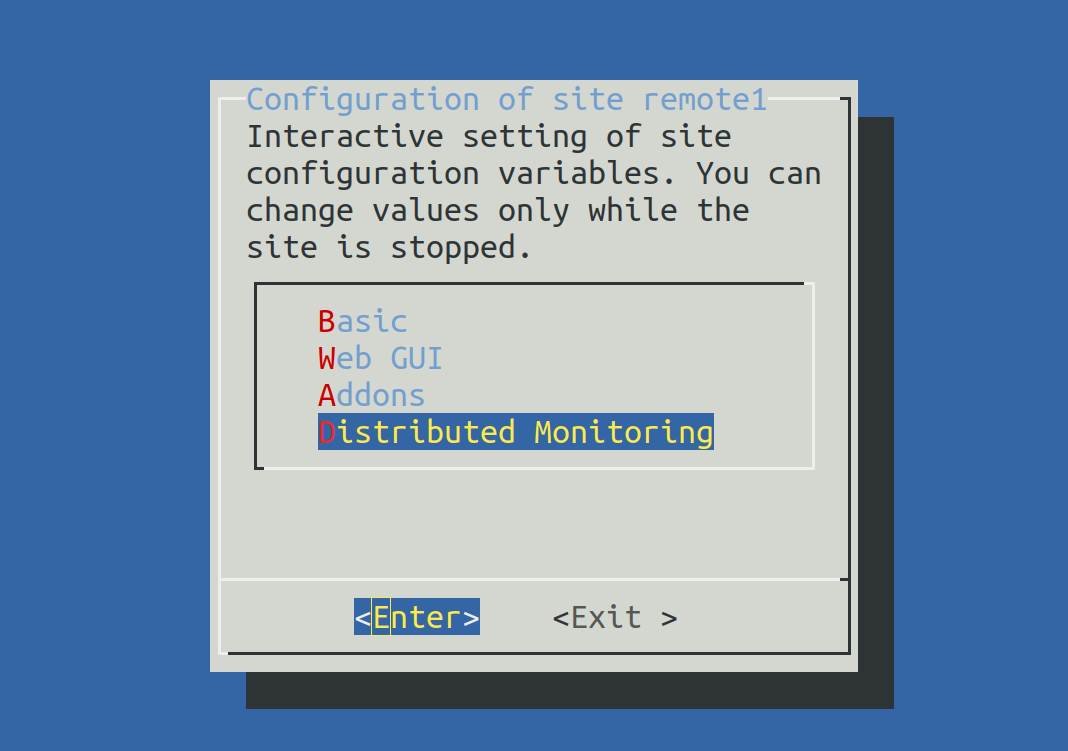
Set LIVESTATUS_TCP to ‘on’ and enter an available port number for LIVESTATUS_TCP_PORT that is explicit on this server. The default is 6557:
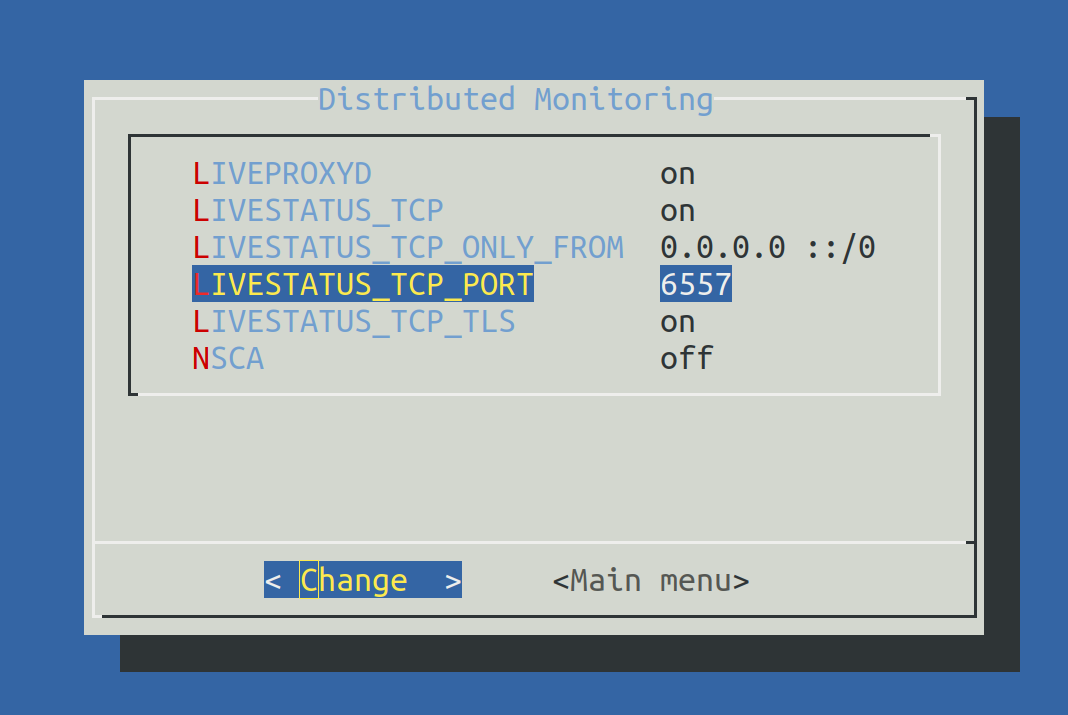
After saving, start the site as normal with omd start:
OMD[remote1]:~$ omd start
Temporary filesystem already mounted
Starting mkeventd...OK
Starting liveproxyd...OK
Starting mknotifyd...OK
Starting rrdcached...OK
Starting cmc...OK
Starting apache...OK
Starting dcd...OK
Starting redis...OK
Starting xinetd...OK
Initializing Crontab...OK
Retain the password for cmkadmin.
Once the remote has been subordinated to the central site,
all users will likewise be replaced by those from the central site.
The remote is now ready. Verify with netstat which should show that
Port 6557 is open. The connection to this port is performed by a site
of the auxiliary daemon xinetd, which runs directly in the site:
root@linux# netstat -lnp | grep 6557
tcp6       0      0 :::6557               :::*          LISTEN      10719/xinetd
Assigning remote sites to the central site
The configuration of the distributed monitoring takes place exclusively on the central site in the menu Setup > General > Distributed monitoring, and this serves to manage the connections to the individual sites. For this function the central site itself counts as a site and is already present in the list:

Using ![]() Add connection, now define the connection to the first remote site:
Add connection, now define the connection to the first remote site:

In the Basic settings it is important to use the remote site’s EXACT name — as defined with omd create — as the Site ID.
As always the alias can be defined as desired and also be later changed.
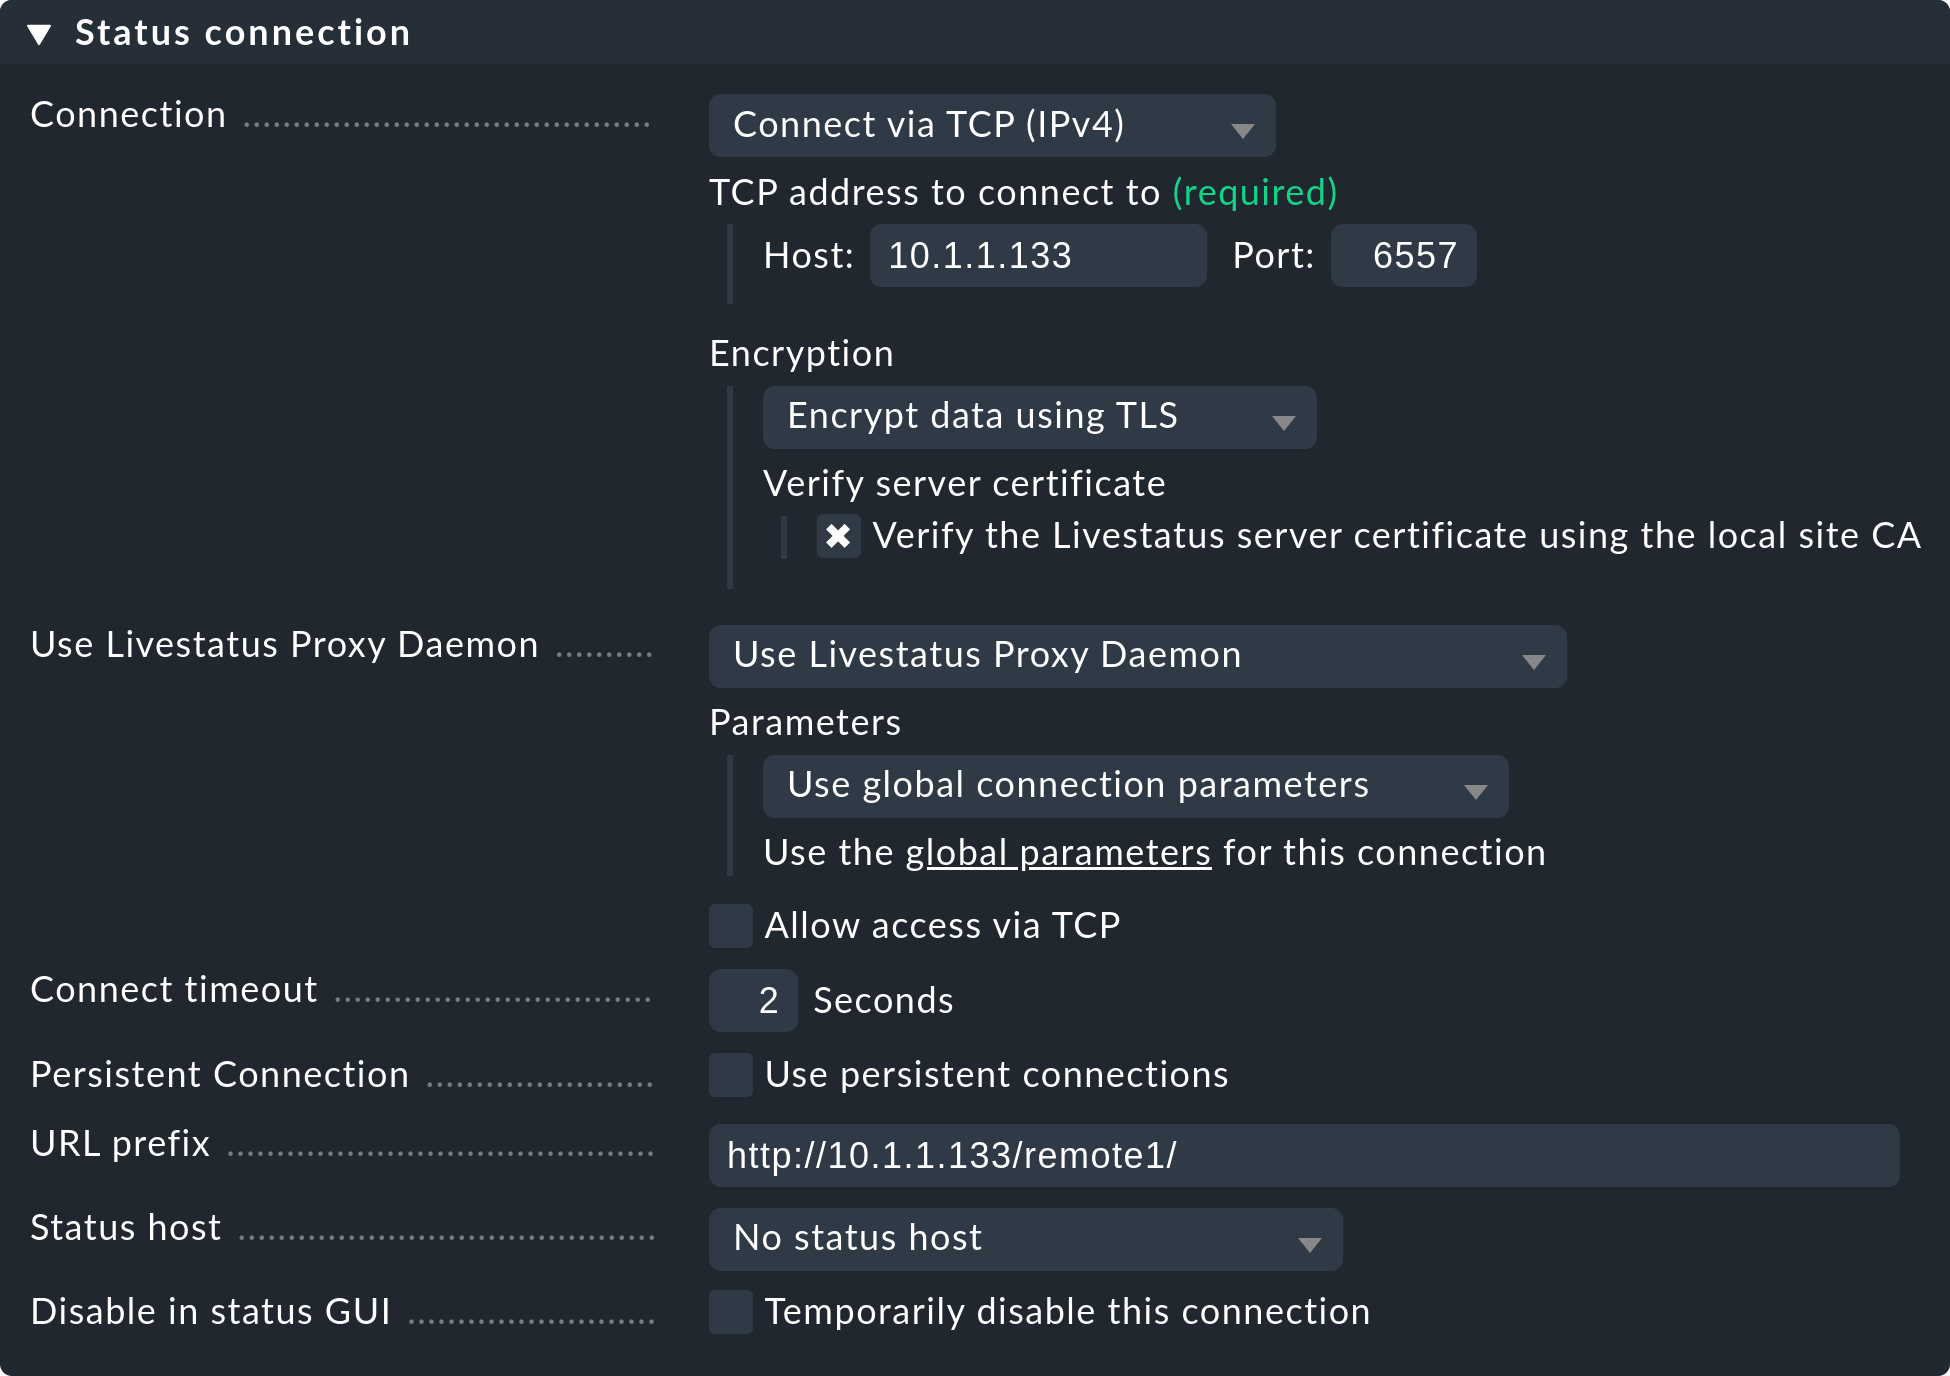
The settings of the Status connection determine how the central queries the status of the remote sites via Livestatus. The example in the screenshot shows a connection with the Connect via TCP(IPv4) method. This is the optimal for stable connections with short latency periods (such as, e.g. in a LAN). We will discuss the optimal settings for WAN connections later.
Enter the HTTP-URL to the remote’s web interface here (only the part preceding the check_mk/ component).
If you basically access Checkmk per HTTPS, then substitute the http here with https.
Further information can be found in the online help ![]() or the article on securing the web interface with HTTPS.
or the article on securing the web interface with HTTPS.
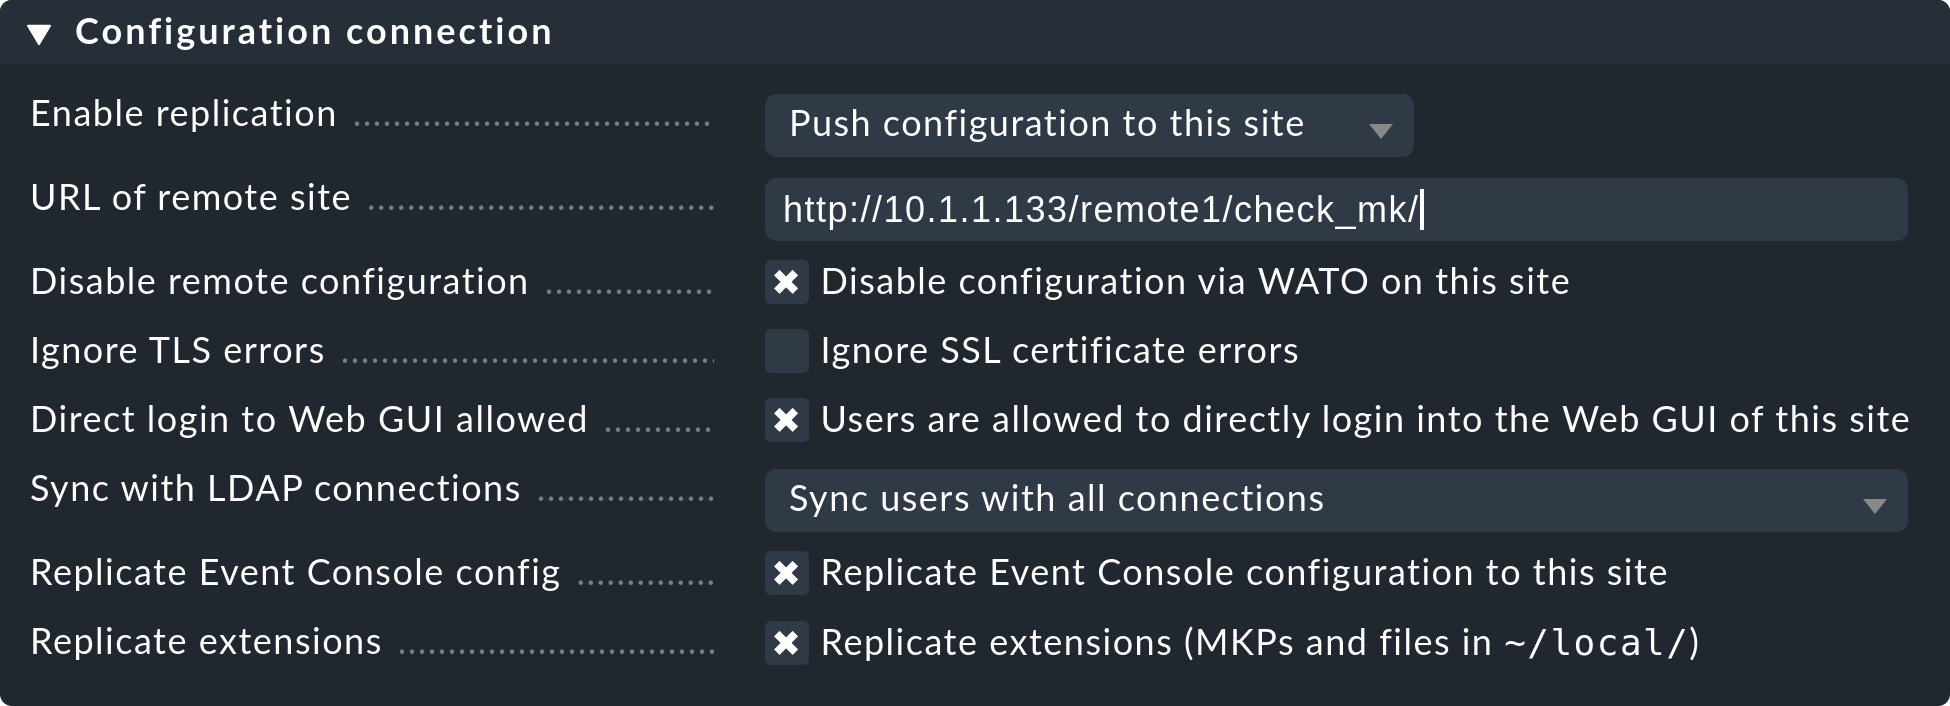
Replicating the configuration and thus using the distributed configuration environment is, as we discussed in the introduction, optional. Activate this if you wish to configure the remote with and from the central site. In such a case select the exact settings as shown in the image above.
A correct setting for the URL of remote site is very important.
The URL must always end with /check_mk/. A connection with HTTPS is recommended, provided that the remote site’s Apache supports HTTPS.
This must be installed manually on the remote at the Linux level.
For the Checkmk Appliance, HTTPS can be set up using the web-based configuration interface.
If you utilize a self-signed certificate, you will require the Ignore SSL certificate errors check box.
Once the mask has been saved a second site will appear in the overview:

The (so far) empty remote site’s monitoring status is now correctly integrated.
In oder to use the distributed configuration environment you still need a login for the remote Checkmk site.
To this end, the central site exchanges a randomly-generated login secret with the remote site, through which all future communication will take place.
The cmkadmin access on the remote site will subsequently no longer be used.
To login use the access data cmkadmin and the according password of the remote site. Do not forget to the box Confirm overwrite, before you click the Login button:

A successful login will be so acknowledged:

Should an error occur with the login, this could be due to a number of reasons – for example:
The remote site is currently stopped.
The Multisite-URL of the remote site has not been correctly set up.
The remote is not reachable under the host name ‘from central site’ specified in the URL.
The Checkmk versions of the central and the remote site are (too) incompatible.
An invalid user ID and/or password have been entered.
Points 1. and 2. can be easily tested by manually calling the remote’s URL in your browser.
When everything has been successful run Activate Changes. This will, as always, bring you to an overview of the not yet activated changes. Simultaneously the overview will also show the states of the Livestatus connections, likewise the synchronization states of the distributed configuration environment of the individual sites:
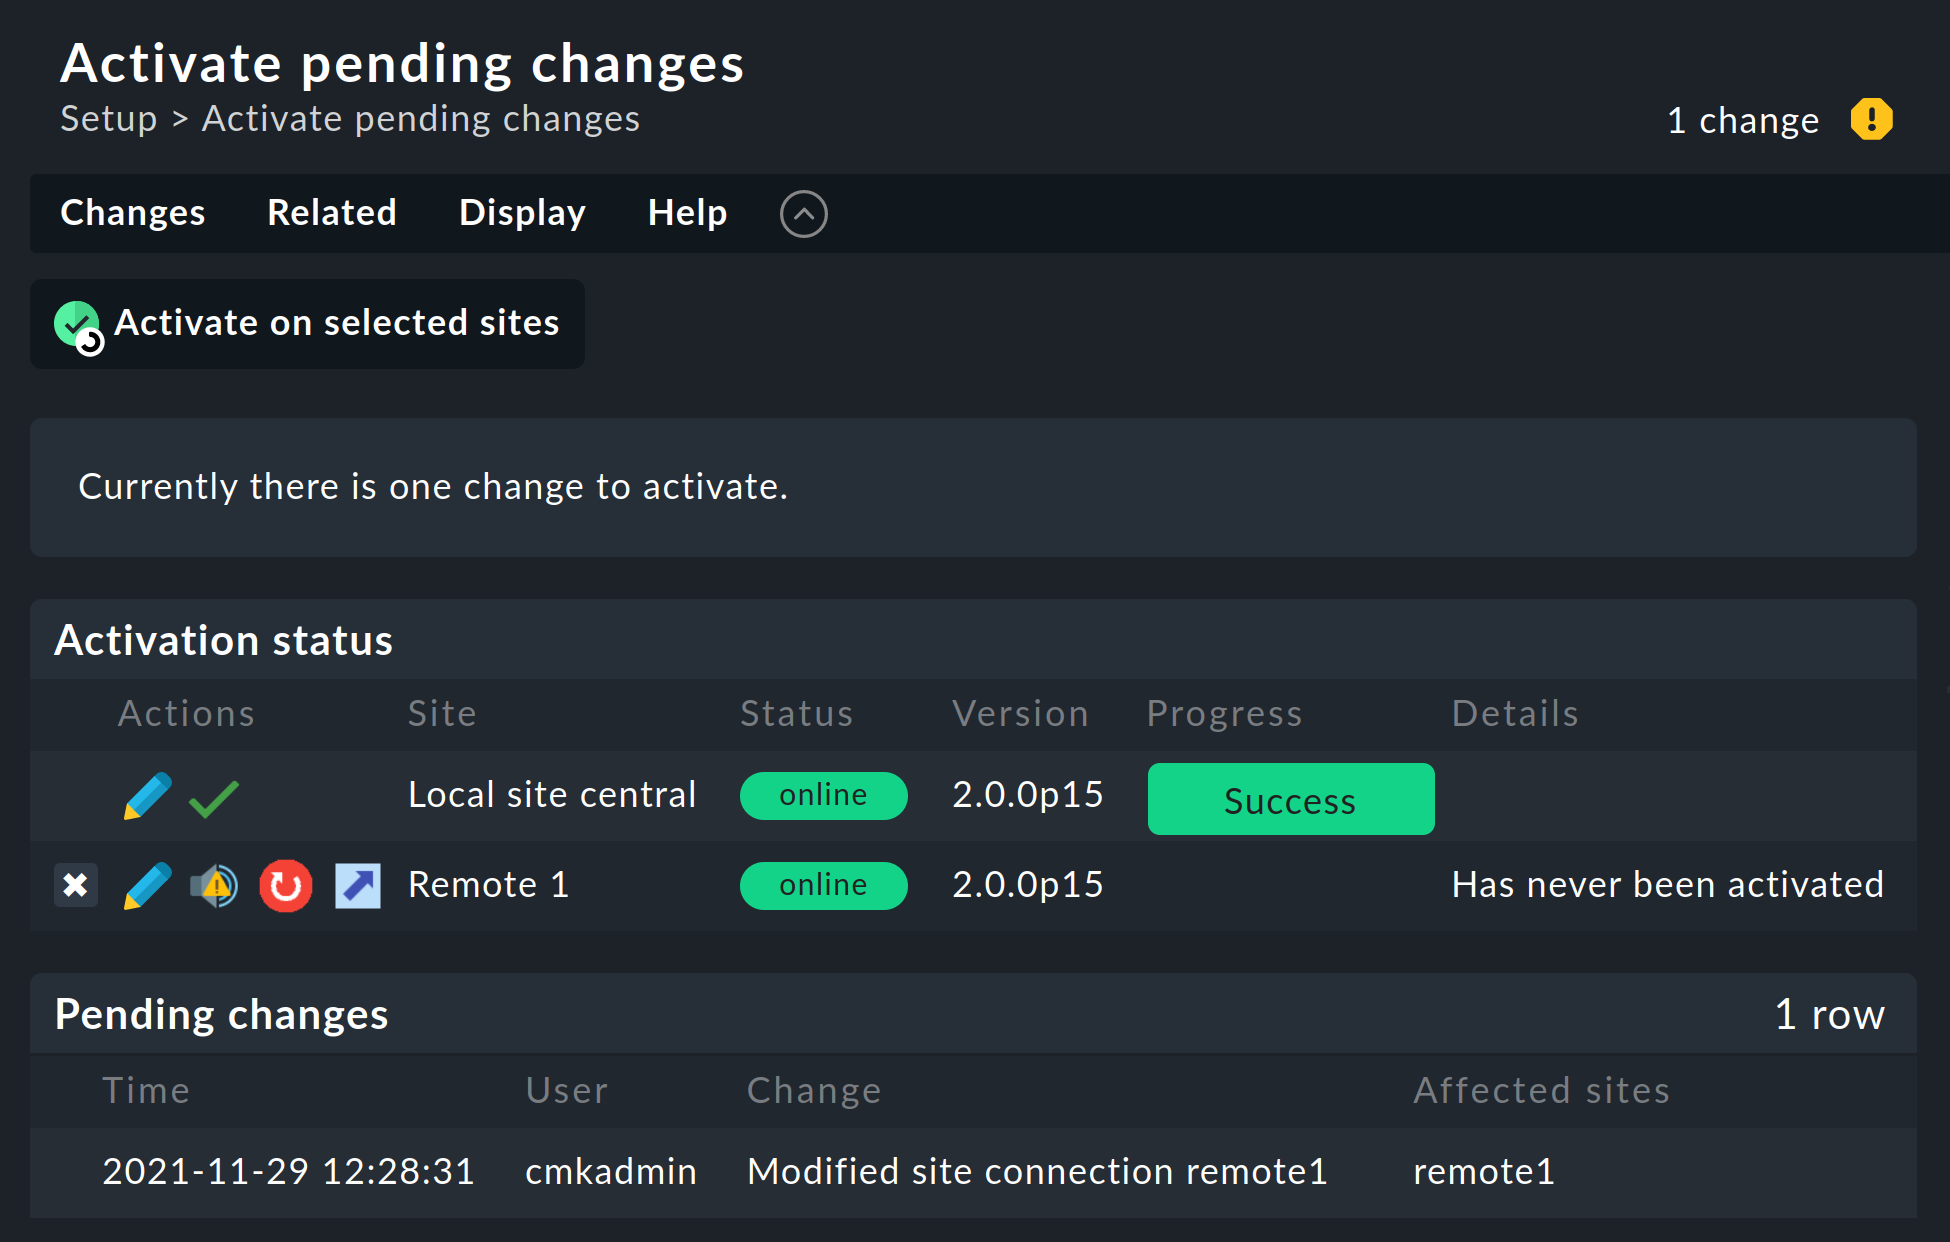
The Version column shows the Livestatus-version of the respective site.
When using the CMC as the Checkmk’s core (Enterprise Editions), the core’s version number
(shown in the ‘Core’ column) is identical to that of the livestatus.
If you are using Nagios as the core ( Checkmk Raw Edition), the Nagios version number will be seen here.
The following symbols show replication status of the configuration environment:
|
This site has outstanding changes. The configuration matches the central site, but not all changes have been activated. With the |
|
The configuration for this site is not synchronous and must be carried over. A restart will then of course be necessary to activate it. Both functions can be performed with a click of the |
In the Status column the state of the Livestatus connection for the respective site can be seen. This is shown purely for information since the configuration is not transmitted via Livestatus, but rather over HTTP. The following values are possible:
|
The site is reachable via Livestatus. |
|
The site is currently not reachable. Livestatus queries are running in a Timeout. This delays the page loading. Status data for this site is not visible in the GUI. |
|
The site is currently not reachable, but this is due to the setting up of a status host or is known through the Livestatus proxy (see below). The inaccessibility does not lead to Timeouts. Status data for this site is not visible in the GUI. |
|
The Livestatus connection to this site has been temporarily deactivated by the (central site’s) administrator. The setting matches the ‘Temporarily disable this connection’ check box in the settings for this connection. |
Clicking the ![]() Activate on selected sites button will now synchronize all sites and activate the changes.
This is performed in parallel, so that the overall time equates to the time required by the slowest site.
Included in the time is the creation of a configuration snapshot for the respective site, the transmission over HTTP, the unpacking of the snapshot on the remote site, and the activation of the changes.
Activate on selected sites button will now synchronize all sites and activate the changes.
This is performed in parallel, so that the overall time equates to the time required by the slowest site.
Included in the time is the creation of a configuration snapshot for the respective site, the transmission over HTTP, the unpacking of the snapshot on the remote site, and the activation of the changes.
Important: Do not leave the page before the synchronization has been completed on all sites – leaving the page will interrupt the synchronization.
Specifying to the hosts and folders which site should monitor them
Once your distributed environment has been installed you can begin to use it. You actually only need to tell each host by which site it should be monitored. The central site is specified by default.
The required attribute for this is ‘Monitored on site’. You can set this individually for each host. This can naturally also be performed at the folder level:

Executing a fresh service discovery and activating changes for migrated hosts
Adding hosts functions as usual – apart from the fact that the surveillance as well as the service discovery will be run from the respective remote site, there are no special considerations.
When migrating hosts from one site to another there are a couple of points to be aware of. Neither current nor historic status data from the host will be carried over. Only the host’s configuration is retained in the configuration environment. In effect it is as if the host has been removed from one site and freshly-installed on the other site:
Automatically discovered services will not be migrated. Run a Service discovery after the migration.
Once restarted, hosts and services will show PEND. Currently existing problems may as a result be newly notified.
Historic graphing will be lost. This can be avoided by manually moving the relevant RRD-files. The location of the files can be found in Files and directories.
Data for availability and from historic events will be lost. These are unfortunately not easy to migrate as the data consists of single lines in the monitoring log.
If the continuity of the history is important to you, when implementing the monitoring you should carefully plan which host is to be monitored, and from where.
2.3. Connecting Livestatus with encryption
From version 1.6.0 Livestatus connections between the central site and a remote can be encrypted.
For newly-created sites nothing further needs to done, as Checkmk takes care of the necessary steps automatically.
As soon as you then use omd config to activate Livestatus, encryption is also automatically activated by TLS:
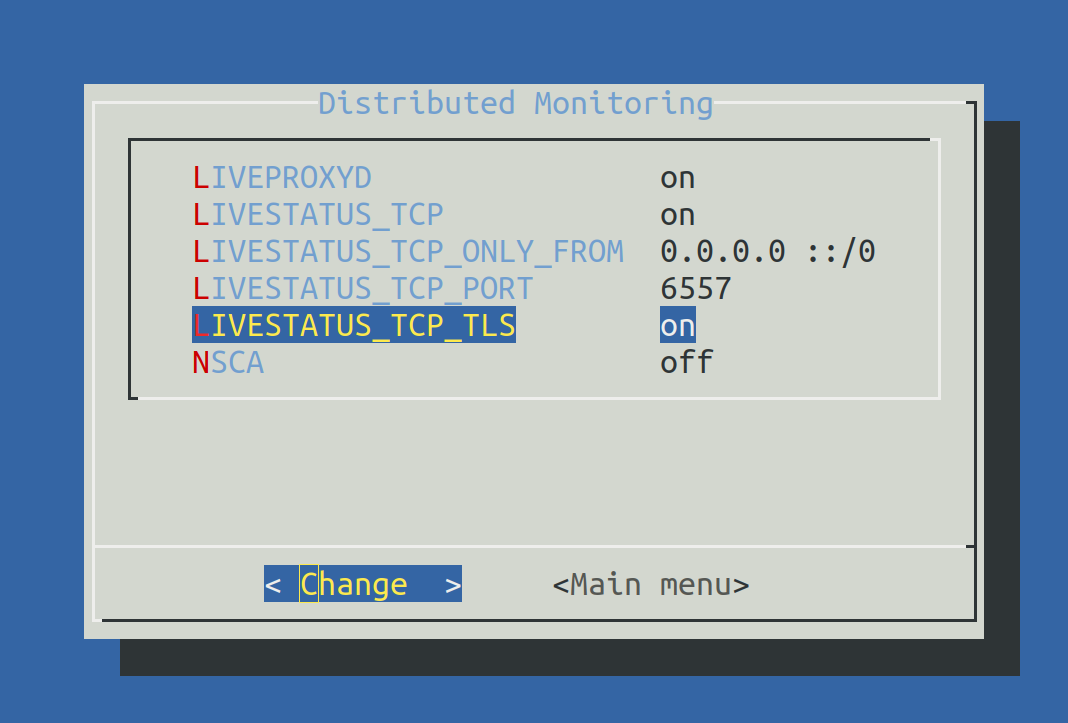
The configuration of distributed monitoring therefore remains as simple as it has been up to now. For new connections to other sites the option Encryption is then automatically enabled.
After you add the remote site, you will notice two things – firstly,
the connection is marked as encrypted by this new ![]() icon.
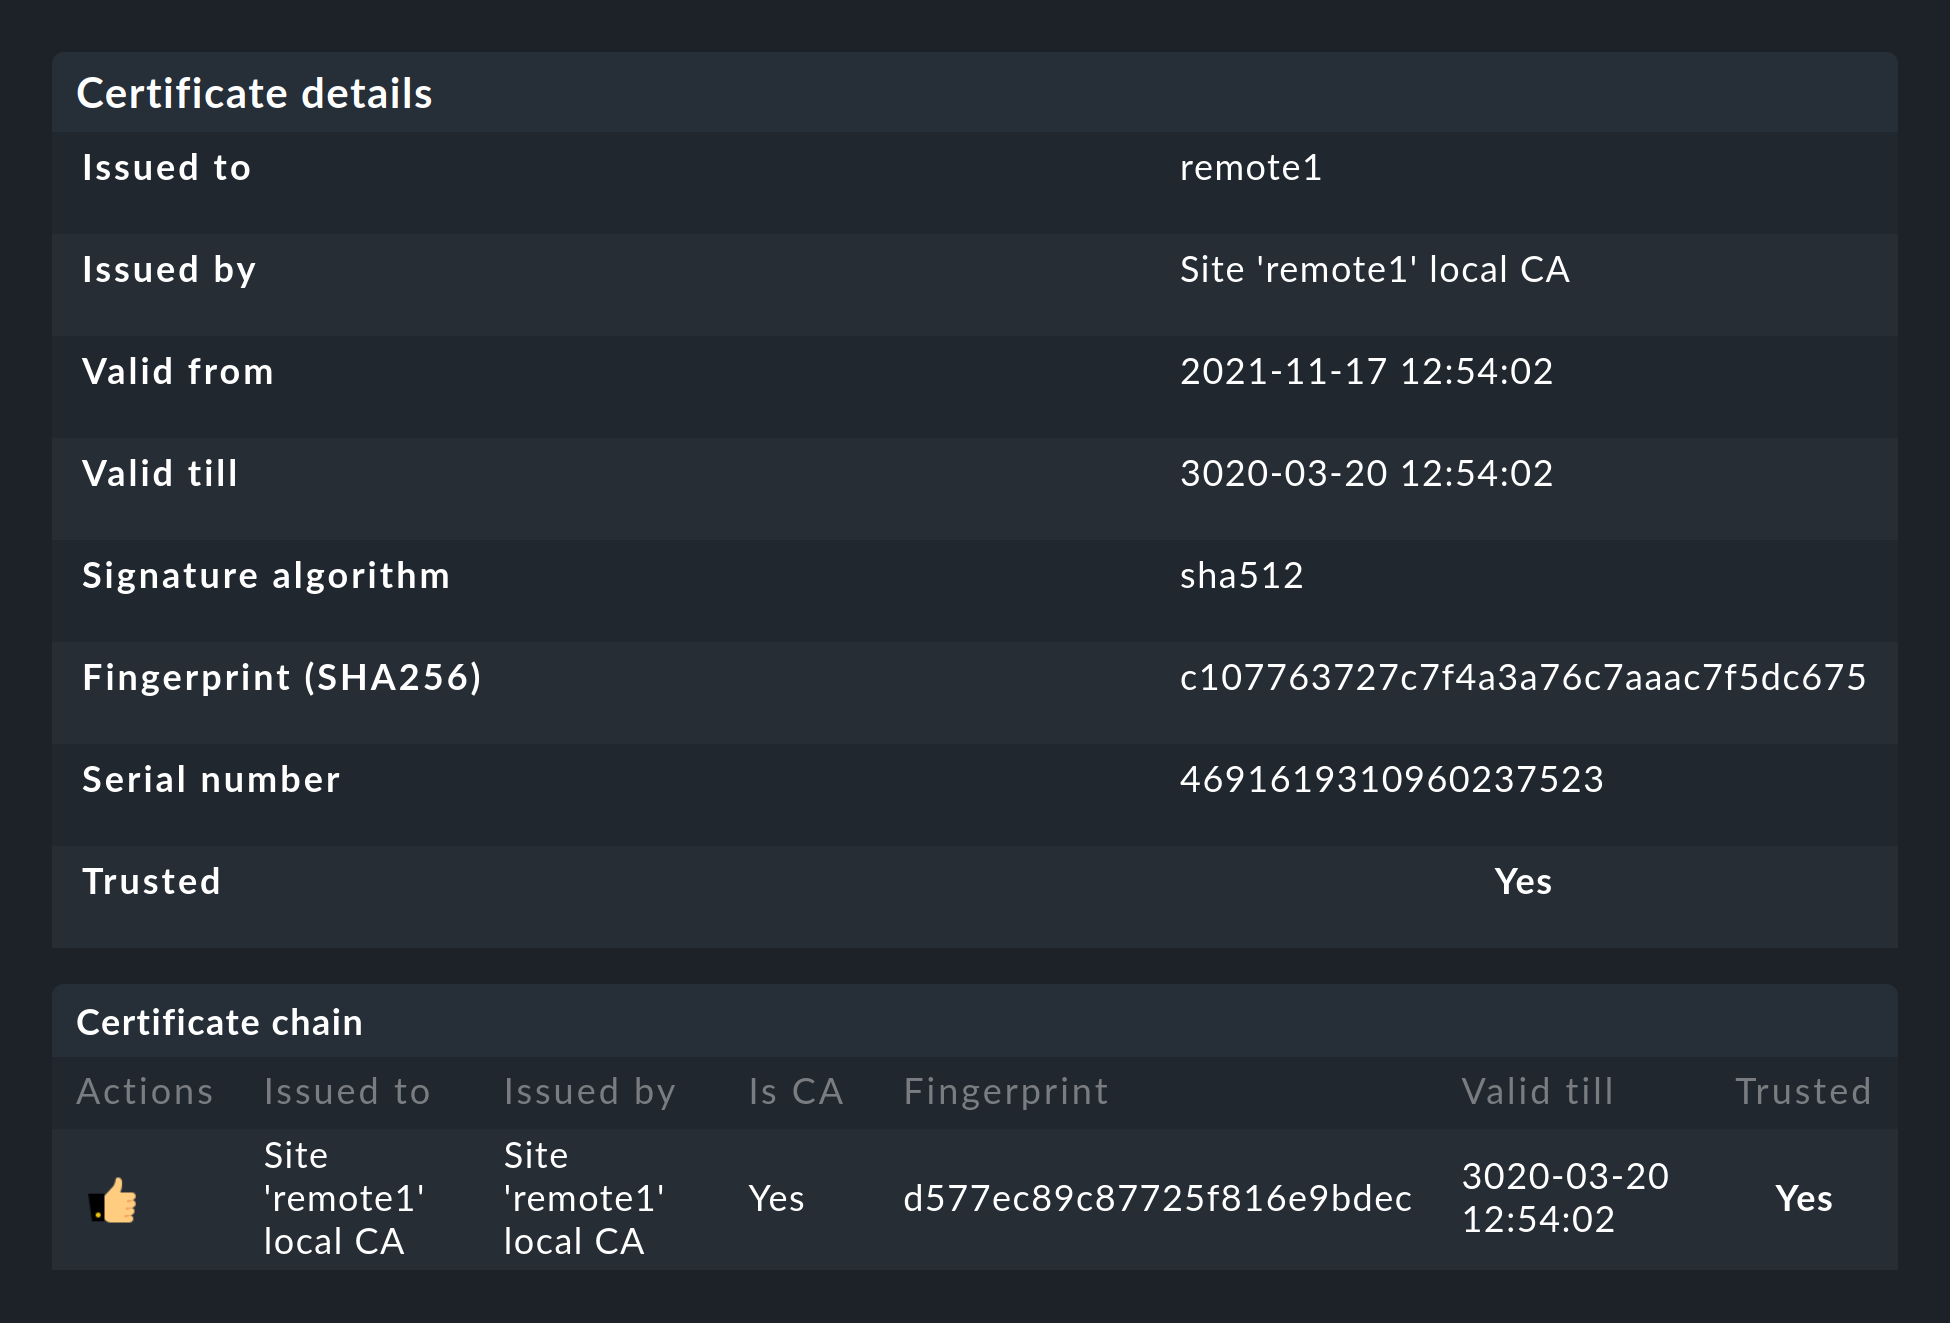
And secondly, Checkmk will tell you that the CA will no longer trust the remote site. Click on
icon.
And secondly, Checkmk will tell you that the CA will no longer trust the remote site. Click on ![]() to get to the
details of the certificates used. A click on
to get to the
details of the certificates used. A click on ![]() lets you
conveniently add the CA via the web interface. Then both certificates will
be listed as trusted:
lets you
conveniently add the CA via the web interface. Then both certificates will
be listed as trusted:
Details of the technologies used
To achieve the encryption Checkmk uses the stunnel program along with
its own certificate and its own Certificate Authority (CA) to sign
the certificate. These will be individually generated automatically with
a new site and they are therefore not predefined static CAs
or certificates. That is a very important safety factor to prevent fake
certificates from being used by attackers, because any attackers could then
gain access to a publicly-available CA.
The generated certificates also have the following properties:
Both certificates are in the PEM format. The signed certificates for the site also contain the complete certificate chain.
The keys use 2048-bit RSA, and the certificate is signed using SHA512
The site’s certificate is valid for 999 years.
The fact that the standard certificate is valid for so long very effectively prevents you from getting connection problems that you cannot classify. At the same time it is of course possible that once a certificate has been compromised it is accordingly long open to abuse. So if you fear that an attacker will gain access to the CA or to the site certificate signed with it, always replace both certificates (CA and site)!
Migrating from older versions
For compatibility reasons the LIVESTATUS_TCP_TLS option will not be automatically activated after an update from an older version to 1.6.0, since in the new version it is only possible to use the
connection with encryption.
After the update, to make use of the new feature in your monitoring sites, stop the site and activate the option mentioned:
OMD[mysite]:~$ omd config set LIVESTATUS_TCP_TLS onSince the certificates were generated automatically during the update, the site then immediately uses the new encryption feature. So that you can still access the site from the central site, please verify that the option Encryption is set to Encrypt data using TLS in the menu under Setup > General > Distributed Monitoring:

The last step is as described above — again here you first have to mark the CA of the remote site as trusted.
2.4. Special features of a distributed setup
A distributed monitoring operates via Livestatus much like a single system, but it does have a couple of special characteristics:
Access to the monitored hosts
All accesses of a monitored host are consistently carried out from the site to which the host is assigned. This applies not only to the actual monitoring, but also to the service discovery, the Diagnostics page, the Notifications, Alert handlers and everything else. This point is very important as it is not assumed that the central site actually has access to this host.
Specifying the site in views
Some of the standard views are grouped according the site from which the host will be monitored – this applies for, e.g. All hosts:
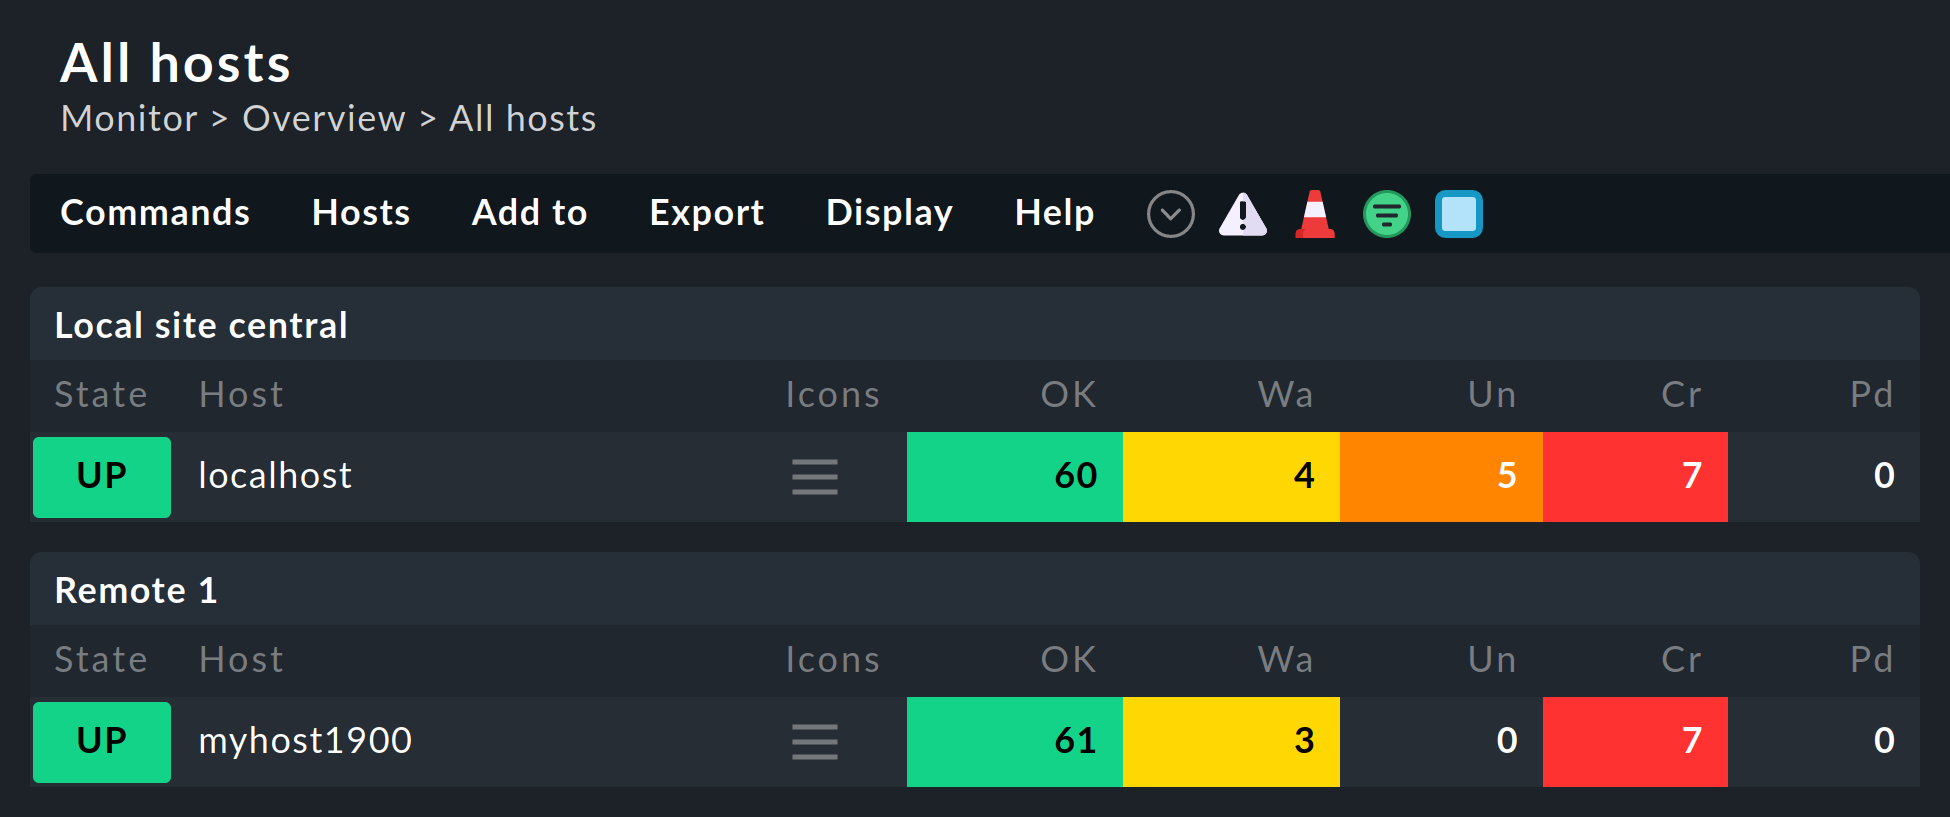
The site will likewise be shown in the host’s or service’s details:

This information is generally available for use in a column when creating your own views. There is also a filter with which a view of hosts on a specific site can be filtered:
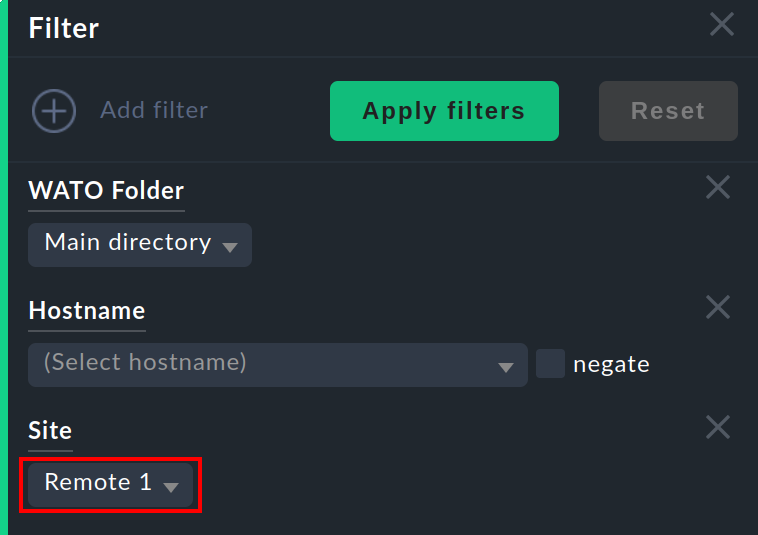
Site status snapin
There is a Site status snapin for the side bar which can be added using ![]() .
This displays the status of the individual sites.
It also provides the option to temporarily disable and re-enable a single site by clicking on the status — or all sites at once by clicking Disable all or Enable all.
.
This displays the status of the individual sites.
It also provides the option to temporarily disable and re-enable a single site by clicking on the status — or all sites at once by clicking Disable all or Enable all.
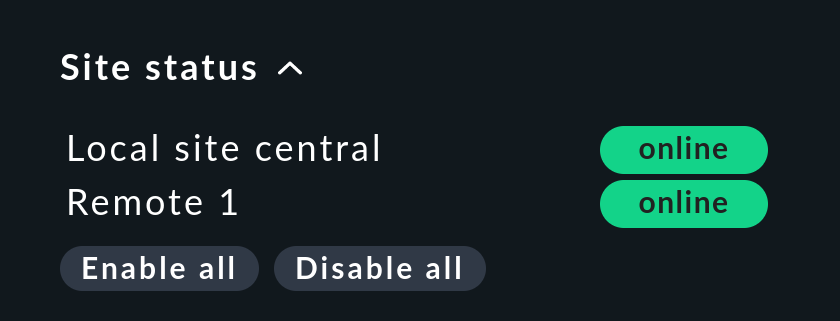
Disabled sites will be flagged with the ![]() status.
With this you can also disable a
status.
With this you can also disable a ![]() site that is generating timeouts, thus avoiding superfluous timeouts.
This disabling is not the same as disabling the Livestatus connection using the connection configuration in the Setup.
Here the ‘disabling’ only affects the currently logged-in user and has a purely visual function.
Clicking on a site’s name will display a view of all of its hosts.
site that is generating timeouts, thus avoiding superfluous timeouts.
This disabling is not the same as disabling the Livestatus connection using the connection configuration in the Setup.
Here the ‘disabling’ only affects the currently logged-in user and has a purely visual function.
Clicking on a site’s name will display a view of all of its hosts.
Master control snapin
In a distributed monitoring the Master control snapin has a different appearance. Each site has its own global switch:
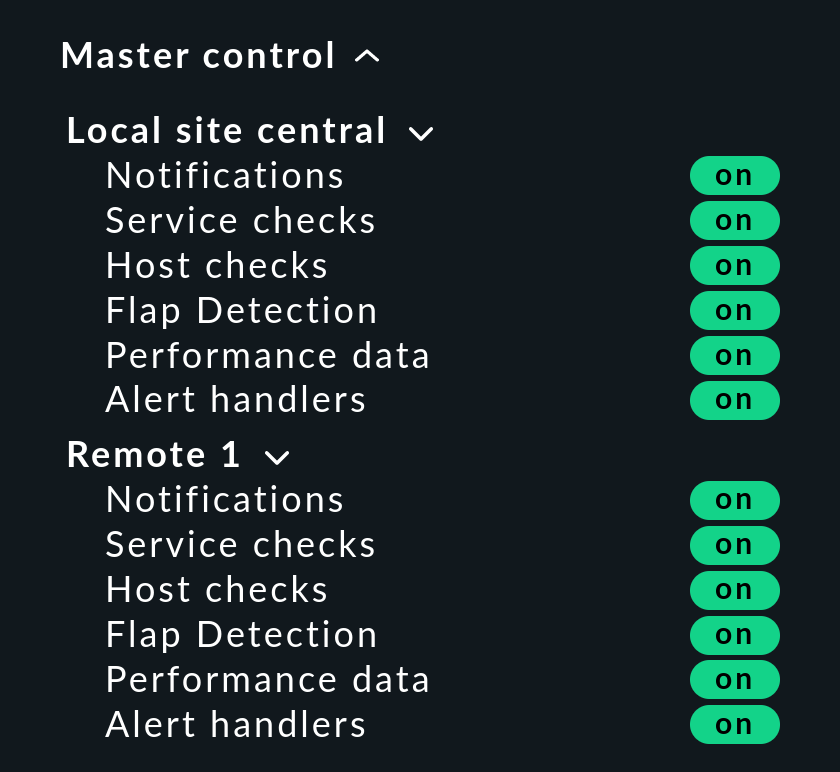
Checkmk cluster hosts
If you monitor with Checkmk HA-Cluster, the cluster’s individual nodes must be assigned to the same site as the cluster itself. This is because determining the clustered services’ status accesses cache files generated through monitoring the node. This data is located locally on the respective site.
Piggyback data (e.g., ESX)
Some check plug-ins use ‘Piggyback’ data, for example, for allocating monitoring data retrieved from an ESX-host to the individual virtual machines. For the same reason as with cluster monitoring, in distributed monitoring the ‘piggy’ (carrying) host as well as its dependent hosts must be monitored from the same site. In the case of ESX this means that the virtual machines must be assigned to the same site in Checkmk as the ESX-System from which the monitoring data is collected. This can mean that it is better to poll the ESX-host system directly rather than to poll a global vCenter. Details for this can be found in the documentation on ESX-monitoring.
Hardware/Software inventory
The Checkmk Hardware/Software inventory also functions in distributed
environments. In doing so the inventory data from the
var/check_mk/inventory directory must be regularly transmitted from the
remotes to the central site. For performance reasons the user interface always
accesses this directory locally.
In the Checkmk Enterprise Editions the synchronization is carried out automatically on all sites that
are connected using the Livestatus proxy.
If you run inventories using the Checkmk Raw Edition in distributed systems, the directory must
be regularly mirrored to the central site with your own tools (e.g., with
rsync).
Changing a password
Even when all sites are being centrally monitored, a login on an individual site’s interface is quite possible and often also appropriate. For this reason Checkmk ensures that a user’s password is always the same for all sites.
A password change made by the administrator will take effect automatically as soon as it is shared to all sites with Activate Changes.
A change made by a user themselves using the ![]() sidebar in their personal settings works somewhat differently.
This cannot execute an Activate changes since the user of course
has no general authority for this function.
In such a case Checkmk will automatically share the changed password across
all sites – directly after it has been saved in fact.
sidebar in their personal settings works somewhat differently.
This cannot execute an Activate changes since the user of course
has no general authority for this function.
In such a case Checkmk will automatically share the changed password across
all sites – directly after it has been saved in fact.
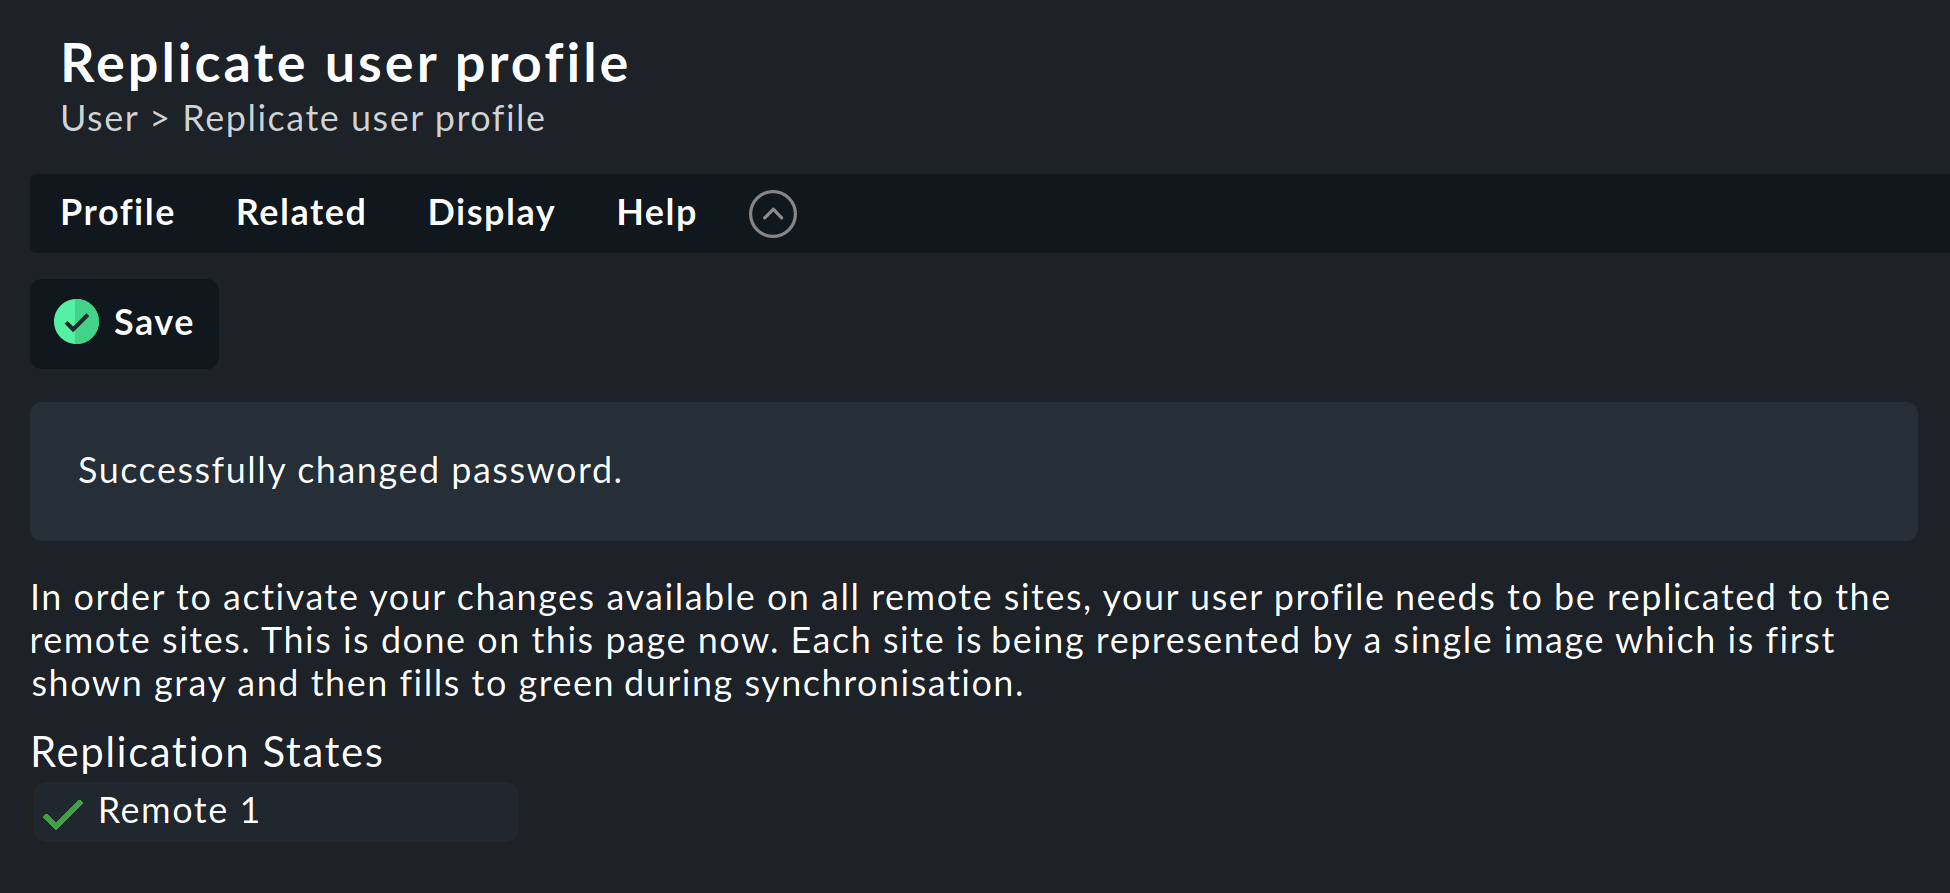
As we all know, networks are never 100 % available. If a site is unreachable at the time of a password change, it will not receive the new password. Until the administrator successfully runs an Activate changes, or respectively, the next successful password change, this site will retain the old password for the user. A status symbol will inform the user of the status of the password sharing to the individual sites.
2.5. Tethering existing sites
As mentioned above, existing sites can also be retrospectively tethered to a distributed monitoring. As long as the preconditions described above have been satisfied (compatible Checkmk versions), this will be completed exactly as for setting up a new remote site. Share Livestatus with TCP, then add the site to via Setup > General > Distributed monitoring – and you’re done!
The second stage – the changeover to a centralized configuration – is somewhat trickier. Before integrating the site into the distributed configuration environment as described above, you should be aware that in doing so the site’s entire local configuration will be overwritten!
Should you wish to take over existing hosts, and possibly rules as well, three steps will be required:
Match the host tags’ scheme
Copy the (host) directories
Edit the characteristics in the parent folder
1. Host tags
It is self-evident that the host tags used in the remote must also be known to the central site in order that they can be carried over. Check these before the migration and add any missing tags to the central site manually. Here it is essential that the Tag-IDs match – the tag’s title is irrelevant.
2. Folders
Next, move the hosts and rules into the configuration environment on the central site. This only works for hosts and rules in sub-folders (i.e., not in the Main folder). Hosts in the main folder should first simply be moved into a remote site’s sub-folder via Setup > Hosts > Hosts.
The actual migration can then be achieved quite simply by copying the appropriate directories.
Each folder in configuration environment corresponds to a directory within ~/etc/check_mk/conf.d/wato/.
These can be copied using a tool of your choice (e.g. scp) from the tethered site to the same location in the central site.
If a directory with the same name already exists there, simply rename it.
Please note that Linux users and groups are also used by the central site.
Following the copying the hosts will appear in the central site’s Setup – as well as the rules you have created in these folders.
The folders’ properties will also be included with the copying.
These can be found in the directory in the hidden .wato file.
3. One-time editing and saving
So that the attributes of the central site’s parent folder’s functions are correctly inherited, as a final step following the migration the parent folders’ characteristics must be opened and saved once – the host’s attributes will thereby be freshly defined.
2.6. Site-specific global settings
A centralized configuration means first and foremost, that all sites have a common and (apart from the hosts) the same configuration. What is the situation however, when individual sites require different global settings? An example could be the CMC setting Maximum concurrent Checkmk checks. It could be that a customized setting is required for a particularly small or a particularly large site.
For such cases there is a site-specific global setting.
This is reached via the ![]() symbol in the menu under Setup > General > Distributed monitoring:
symbol in the menu under Setup > General > Distributed monitoring:

Via this symbol you will find a selection of all global settings – although anything you define here will only be effective for the chosen site. A value that diverges from the standard will be visually-highlighted, and it will apply only to this site:

2.7. Distributed Event Console
The Event Console processes syslog-messages, SNMP traps and other types of events of an asynchronous nature.
Checkmk also provides the option of running a distributed Event Console.
Then every site will run its own event processing which captures the events from all of the hosts being
monitored from the site.
The events will thus not be sent to the central system, rather they will remain at the sites and be only centrally-retrieved.
This is effected in a similar way to that for the active states via Livestatus, and functions with both the Checkmk Raw Edition and the
Checkmk Enterprise Editions.
Converting to a distributed Event Console according to the new scheme requires the following steps:
In the connection settings, activate the option(Replicate Event Console configuration to this site).
Switch the Syslog location and SNMP-Trap-destinations for the affected hosts to the remote site. This is the most laborious task.
If you use the Check event state in Event Console rule set, switch this back to Connect to the local Event Console.
If you use the Logwatch Event Console Forwarding rule set, switch this likewise to the local Event Console.
In the Event Console Settings, switch the Access to event status via TCP back to no access via TCP.
2.8. NagVis

The NagVis open source program visualizes status data from monitoring on self-produced maps, diagrams and other charts. NagVis is integrated in Checkmk and can be used immediately. The access is easiest over the NagVis Maps sidebar element. The integration of NagVis in Checkmk is described in its own article.
NagVis supports distributed monitoring via Livestatus in pretty much the same way as Checkmk does. The links to the individual sites are referred to as Backends. The back-ends are automatically set up correctly by Checkmk so that one can immediately begin generating NagVis-charts – also in distributed monitoring.
Select the correct back-end for each object that you place on a chart – i.e., the Checkmk site from which the object is to be monitored. NagVis cannot find the host or service automatically, above all for performance reasons. Therefore if you move hosts to a different remote site you will need to update the NagVis-charts accordingly.
Details on back-ends can be found in the documentation here: NagVis.
3. Unstable or slow connections
The general status overview in the user interface enables an always available, and reliable access to all of the connected sites. The one snag with this is that a view can only be displayed when all sites have responded. The process is always that first a Livestatus query is sent (for example, "List all services whose state is not OK."). The view can then only be displayed once the last site has responded.
It is annoying when a site doesn’t answer at all. To tolerate brief outages (e.g., due to restarting a site or a lost TCP-Packet), the GUI waits for a given time before a site is declared to be ![]() , and then continues processing the responses from the remaining sites.
This results in a ‘hanging’ GUI. The timeout is set to 10 seconds by default.
, and then continues processing the responses from the remaining sites.
This results in a ‘hanging’ GUI. The timeout is set to 10 seconds by default.
If this occasionally happens in your network you should set up either Status hosts or (even better) the Livestatus proxy.
3.1. Status hosts
The configuration of Status hosts is the recommended procedure with the
Checkmk Raw Edition in order to recognize defective connections reliably.
The idea is simple: The central site actively monitors the connection to each individual remote site. At least we will then have a monitoring system available!
The GUI will then be aware of unreachable sites and can immediately exclude and flag them as
![]() .
Timeouts are thus minimized.
.
Timeouts are thus minimized.
Here is how to set up a status host for a connection:
Add the host on which the remote site is running to the central site in monitoring.
Enter this as the status host in the connection to the remote:
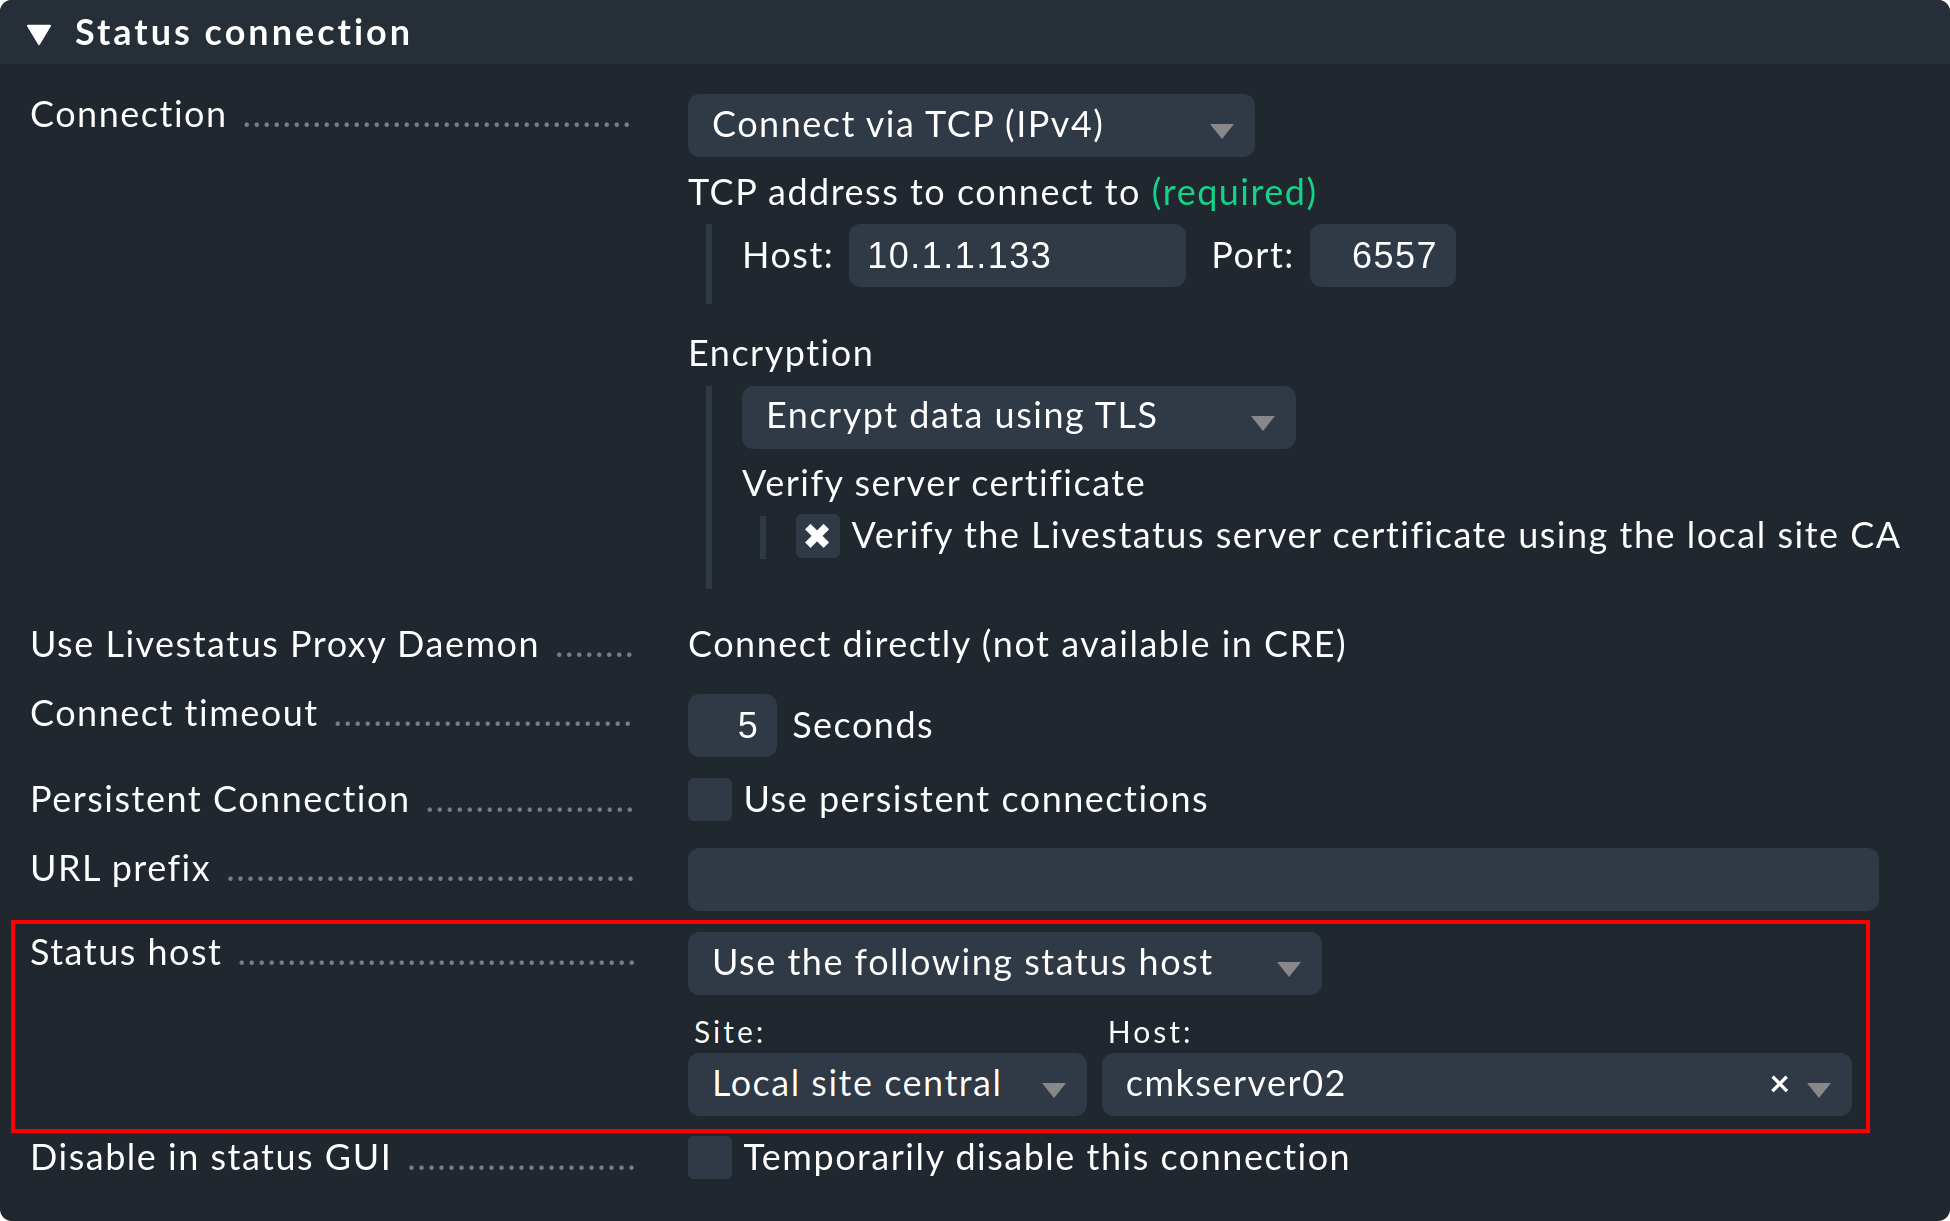
A failed connection to a remote site can now only lead to a brief hangup of the GUI – namely until the monitoring has recognized it. By reducing the status host’s proof interval from the default of sixty seconds to, e.g. five seconds, you can minimize the duration of a hangup.
If you have set up a status host, there are further possible states for connections:
|
The computer on which the remote site is running is just now unreachable to the monitoring because a router is down (the status host has an UNREACH state). |
|
The status host that monitors the connection to the remote system has not yet been verified by the monitoring (it still has a PEND state). |
|
The status host’s state has an invalid value (this should never occur). |
In all three cases the connection to the site will be excluded and timeouts thus avoided.
3.2. Persistent connections
With the Use persistent connections check box you can prompt the GUI
to maintain established Livestatus connections to remote sites permanently
in an ‘up’ state, and to continue using them for queries.
Especially for connections with longer packet turnarounds (e.g. intercontinental),
this can make the GUI noticeably more responsive.
Because the Apache GUI is shared over multiple independent processes a connection
is required for each Apache-Client process running simultaneously.
If you have many simultaneous users, please ensure the configuration
has a sufficient number of Livestatus connections in the remote’s Nagios core.
These are configured in the etc/mk-livestatus/nagios.cfg file.
The default is twenty (num_client_threads=20).
By default, Apache is so configured in Checkmk that it permits up to 128
simultaneous user connections. This is configured in the following section
of the etc/apache/apache.conf file:
<IfModule prefork.c>
StartServers         1
MinSpareServers      1
MaxSpareServers      5
ServerLimit          128
MaxClients           128
MaxRequestsPerChild  4000
</IfModule>
This means that under high load up to 128 Apache processes can start which then
also generate and sustain up to 128 Livestatus connections.
Not setting the num_client_threads high enough can result in errors or a
very slow response time in the GUI.
For connections with LAN or with fast WAN-Networks we advise not utilizing persistent connections.
3.3. The Livestatus proxy
With the Livestatus proxy the
Checkmk Enterprise Editions features
a sophisticated mechanism for detecting dead connections.
Additionally, it especially optimizes the performance of connections
with long round-trip-times. The Livestatus proxy’s advantages are:
Very fast, proactive detection of unresponding sites
Local caching of queries that deliver static data
Standing TCP-connections – which require fewer round trips and consequently allow much faster responses from distant sites (e.g. USA ⇄ China)
Precise control of the maximum number of Livestatus connections required
Enables Hardware/Software inventory in distributed environments
Installation
Installing the Livestatus proxy is very simple. It is activated by default in the CEE – which can be seen when starting a site:
OMD[central]:~$ omd start
Temporary filesystem already mounted
Starting mkeventd...OK
Starting liveproxyd...OK
Starting mknotifyd...OK
Starting rrdcached...OK
Starting cmc...OK
Starting apache...OK
Starting dcd...OK
Starting redis...OK
Starting stunnel...OK
Starting xinetd...OK
Initializing Crontab...OK
Select the setting ‘Use Livestatus Proxy-Daemon’ for the connection to the remote sites instead of ‘Connect via TCP’:
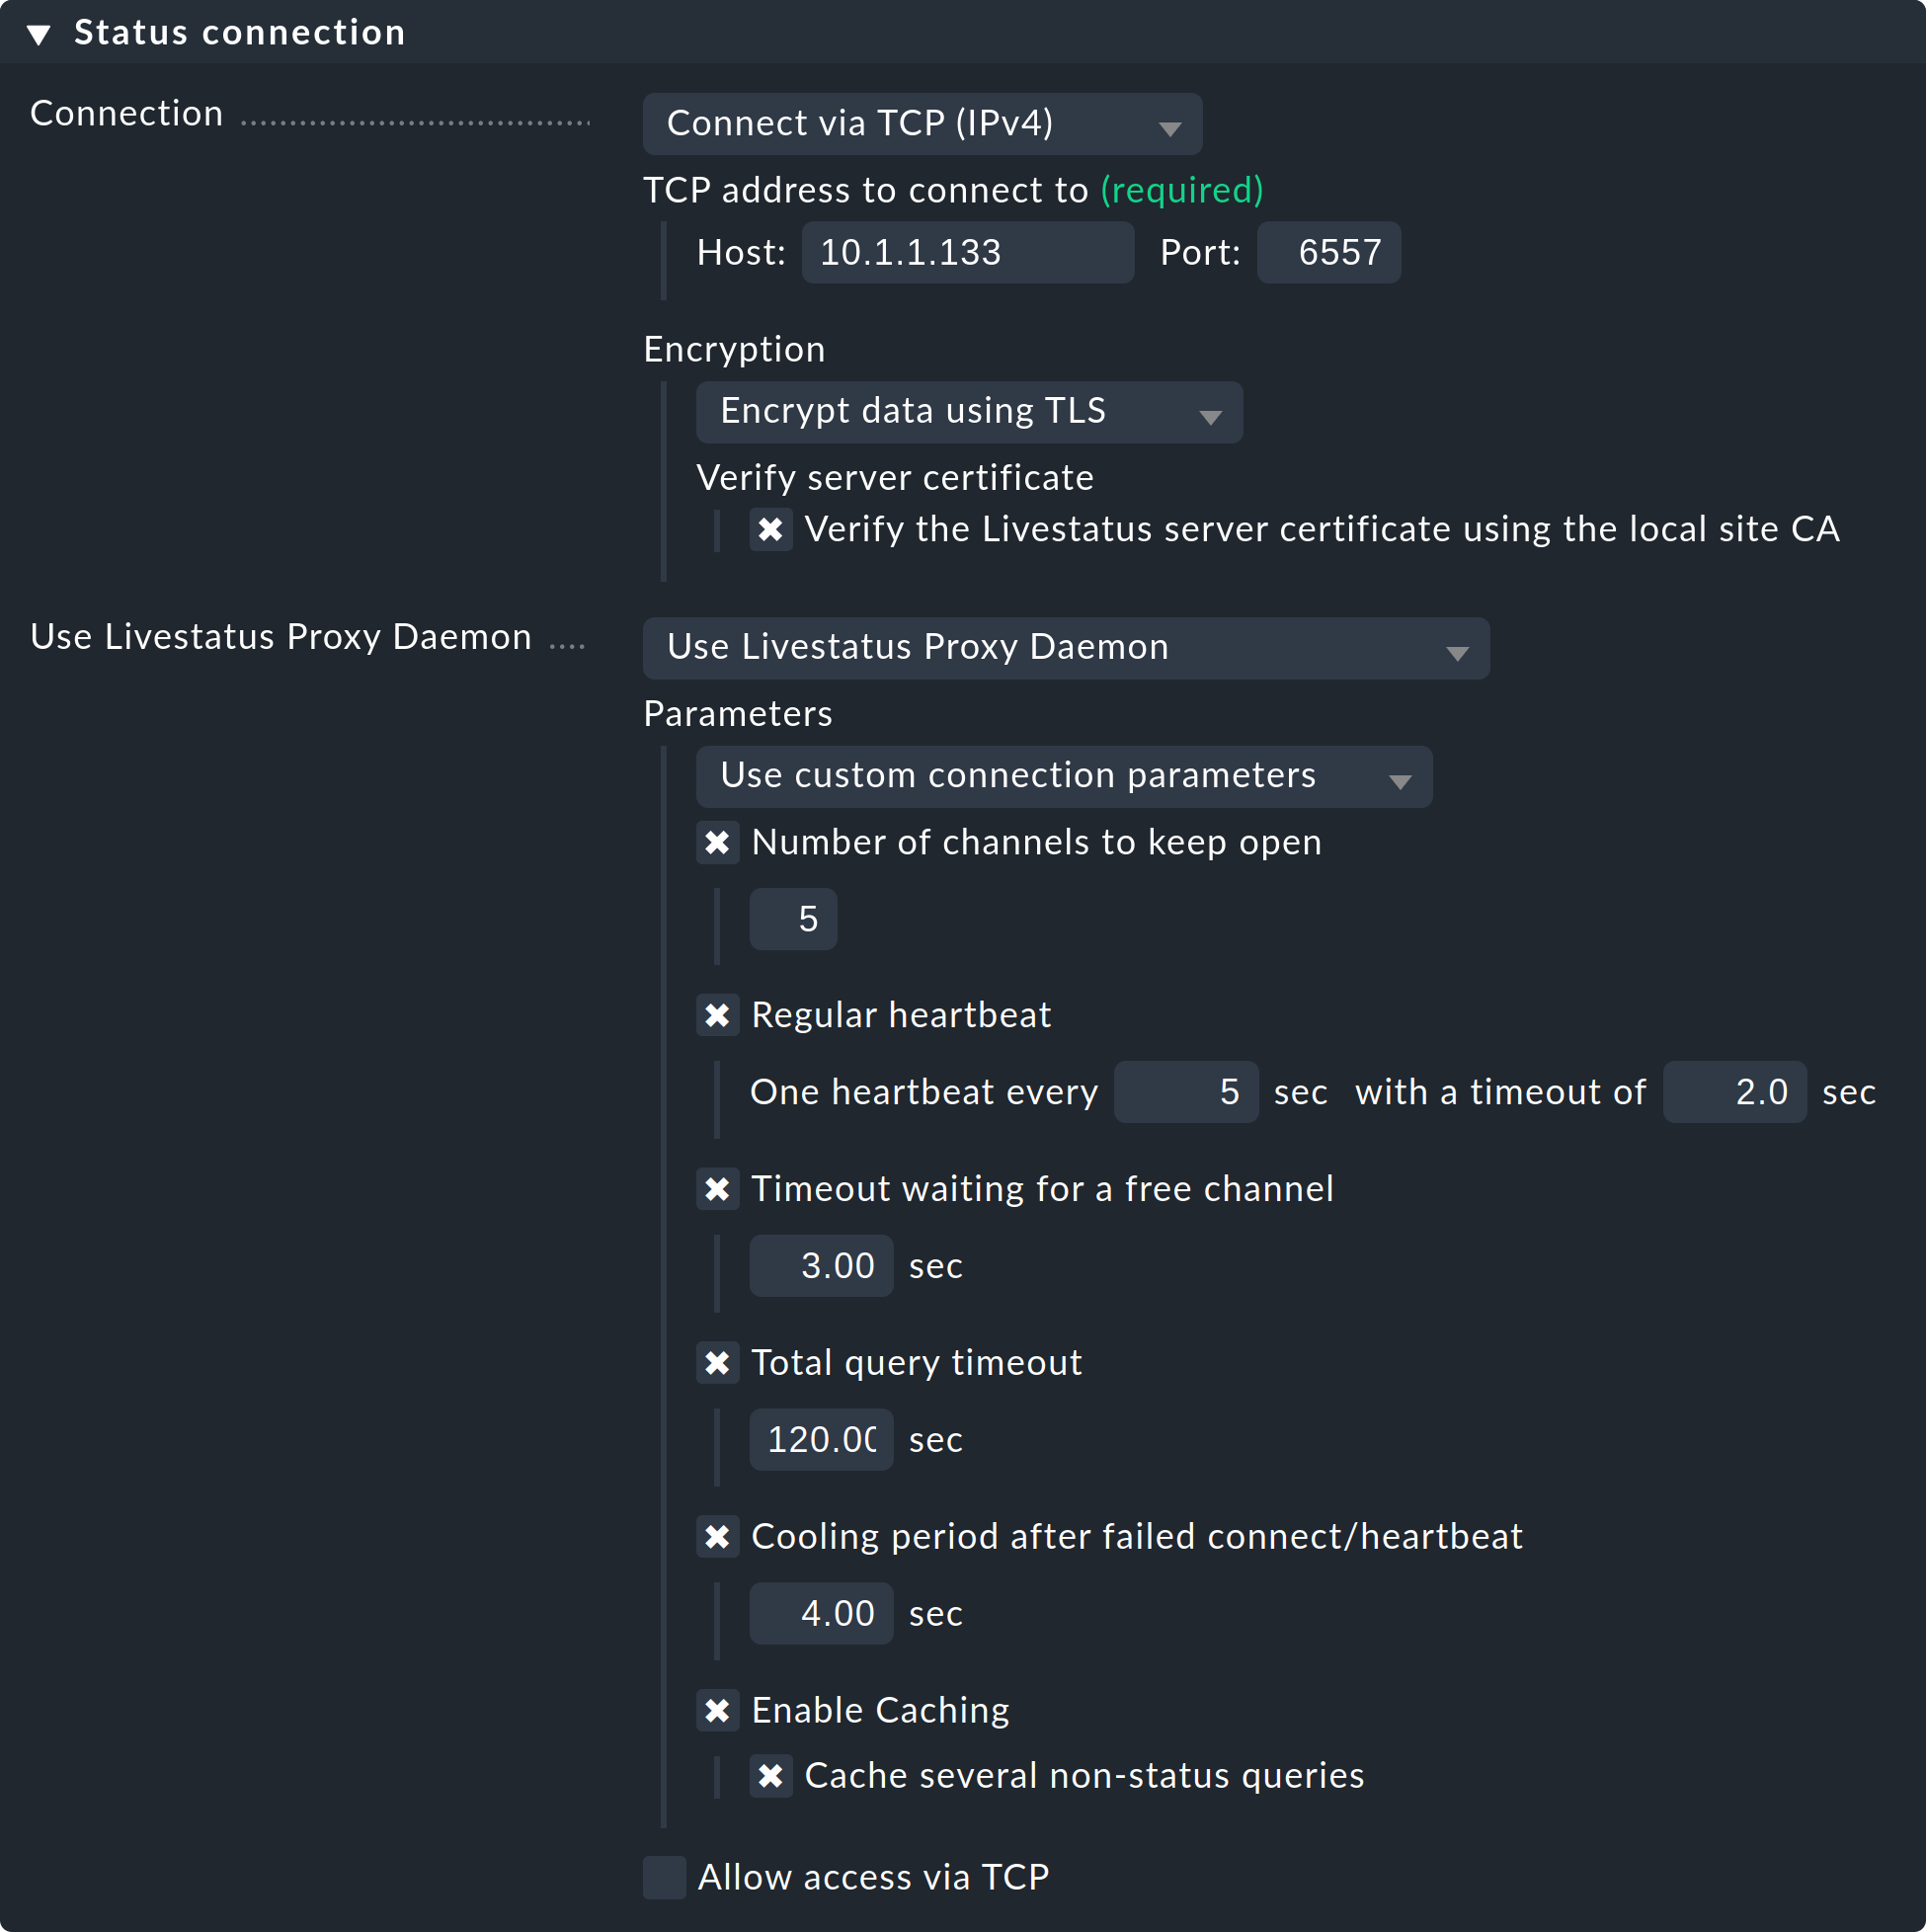
The details for host and port are as always. No changes must be made on the remote site. In Number of channels to keep open enter the number of parallel TCP-connections the proxy should establish and sustain to the target site.
The TCP-connections pool is shared by all GUI inquiries. The number of connections limits the maximum number of queries that can be processed concurrently. This indirectly limits the number of users. In situations in which all channels are reserved this will not immediately lead to an error. The GUI waits a given time for a free channel. Most queries actually require only a few milliseconds.
If the GUI must wait longer than Timeout waiting for a free channel for a channel, it will be interrupted with an error and the user will receive an error message. In such a case the number of connections should be increased. Be aware however that on the remote site sufficient parallel incoming connections must be allowed – this is set to 20 by default. This setting can be found in the global options under Monitoring core > Maximum concurrent Livestatus connections.
The Regular heartbeat provides a constantly active monitoring of the connections directly at the protocol level. In the process the proxy regularly sends a simple Livestatus query which must be answered by the remote site within the predetermined time (default: 2 seconds). With this method a situation where the target server and the TCP-port are actually reachable, but the monitoring core no longer responds, will also be detected.
If a response fails to appear, all connections will be declared ‘dead’, and following a ‘cooldown’ time (default: 4 seconds) will be newly established. All this takes place proactively – i.e. without a user needing to open a GUI-window. In this way outages can be quickly detected, and via a recovery the connections can be immediately reestablished and in the best case be available before a user even notices the outage.
The Caching ensures that static queries need only be responded-to once by the remote site, and from that point of time can be responded to directly and locally, without delay. An example of this is the list of monitored hosts required by Quicksearch.
Error diagnosis
The Livestatus proxy has its own log file
which can be found under var/log/liveproxyd.log.
On a correctly-configured remote site with five channels (standard)
it will look something like this:
2021-12-01 15:58:30,624 [20] ----------------------------------------------------------
2021-12-01 15:58:30,627 [20] [cmk.liveproxyd] Livestatus Proxy-Daemon (2.0.0p15) starting...
2021-12-01 15:58:30,638 [20] [cmk.liveproxyd] Configured 1 sites
2021-12-01 15:58:36,690 [20] [cmk.liveproxyd.(3236831).Manager] Reload initiated. Checking if configuration changed.
2021-12-01 15:58:36,692 [20] [cmk.liveproxyd.(3236831).Manager] No configuration changes found, continuing.
2021-12-01 16:00:16,989 [20] [cmk.liveproxyd.(3236831).Manager] Reload initiated. Checking if configuration changed.
2021-12-01 16:00:16,993 [20] [cmk.liveproxyd.(3236831).Manager] Found configuration changes, triggering restart.
2021-12-01 16:00:17,000 [20] [cmk.liveproxyd.(3236831).Manager] Restart initiated. Terminating site processes...
2021-12-01 16:00:17,028 [20] [cmk.liveproxyd.(3236831).Manager] Restart master process
The Livestatus proxy regularly records its state in the var/log/liveproxyd.state file:
Current state:
[remote1]
  State:                   ready
  State dump time:         2021-12-01 15:01:15 (0:00:00)
  Last reset:              2021-12-01 14:58:49 (0:02:25)
  Site's last reload:      2021-12-01 14:26:00 (0:35:15)
  Last failed connect:     Never
  Last failed error:       None
  Cached responses:        1
  Channels:
       9 - ready             -  client: none - since: 2021-12-01 15:01:00 (0:00:14)
      10 - ready             -  client: none - since: 2021-12-01 15:01:10 (0:00:04)
      11 - ready             -  client: none - since: 2021-12-01 15:00:55 (0:00:19)
      12 - ready             -  client: none - since: 2021-12-01 15:01:05 (0:00:09)
      13 - ready             -  client: none - since: 2021-12-01 15:00:50 (0:00:24)
  Clients:
  Heartbeat:
    heartbeats received: 29
    next in 0.2s
  Inventory:
    State: not running
    Last update: 2021-12-01 14:58:50 (0:02:25)
And when a site is currently stopped the state will look like this:
----------------------------------------------
Current state:
[remote1]
  State:                   starting
  State dump time:         2021-12-01 16:11:35 (0:00:00)
  Last reset:              2021-12-01 16:11:29 (0:00:06)
  Site's last reload:      2021-12-01 16:11:29 (0:00:06)
  Last failed connect:     2021-12-01 16:11:33 (0:00:01)
  Last failed error:       [Errno 111] Connection refused
  Cached responses:        0
  Channels:
  Clients:
  Heartbeat:
    heartbeats received: 0
    next in -1.0s
  Inventory:
    State: not running
    Last update: 2021-12-01 16:00:45 (0:10:50)
Here the state is ‘starting’.
The proxy is thus attempting to establish connections.
There are no channels yet.
During this state queries to the site will be answered with an error.
4. Cascading Livestatus
As already mentioned in the introduction, it is possible to extend a distributed monitoring to include dedicated Checkmk viewer sites that display the monitoring data from remote sites that by themselves are not directly accessible. The only prerequisite for this is that the central site must of course be accessible. Technically, this is implemented via the Livestatus proxy. The central site receives data from the remote site via Livestatus and itself acts as a proxy — i.e. it can pass the data on to third sites. You can extend this chain as you wish, for instance, by connecting a second viewer site via the first.
This is practical, for example, in a scenario such as the following: The central site supports three independent networks — customer1, customer2 and customer3, and is itself operated in the network operator1. If the management of the operator from the operator1 network would like to see the monitoring status from the customer sites, this could of course be regulated via an access from the central site. For technical and legal reasons, however, the central site could be reserved exclusively for the personnel responsible for it. A direct access can thus be avoided by setting up a viewer site dedicated to viewing remote sites. The viewer site then shows the hosts and services on connected sites, but its own configuration remains completely empty.
The setup is done in the connection settings on the distributed monitoring, first on the central site, then on the viewer site (which does not actually have to exist yet).
On the central site, open the connection settings for the desired remote site via Setup > General > Distributed monitoring.
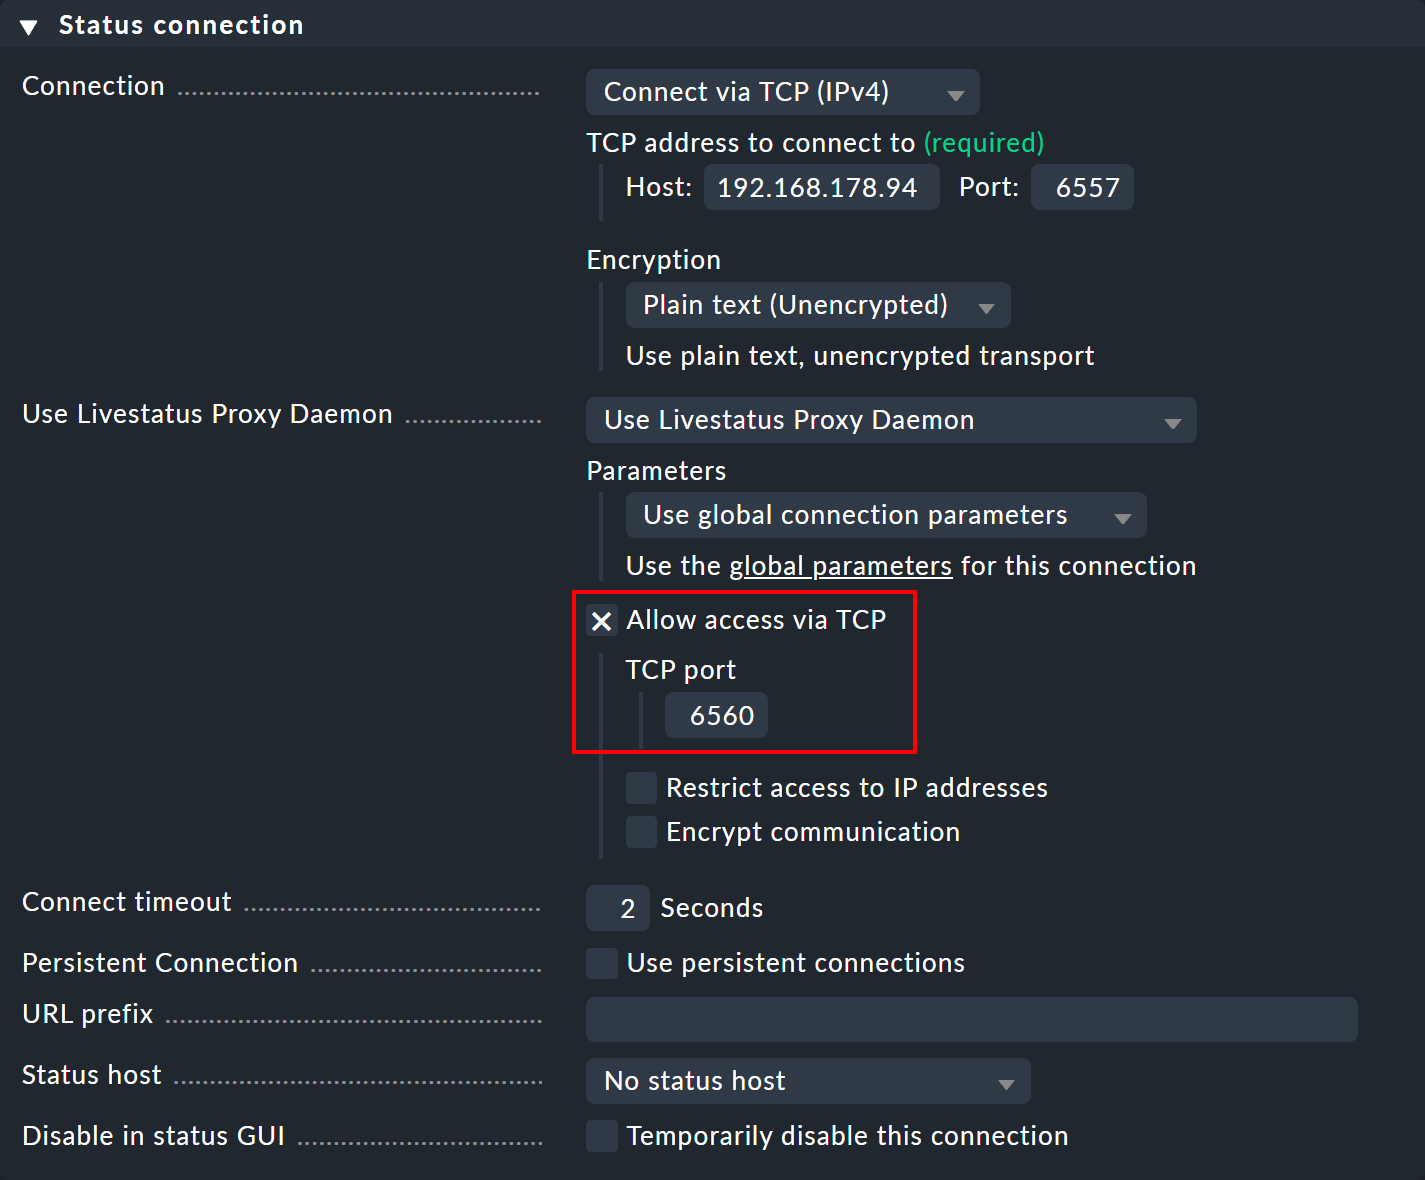
Under Use Livestatus Proxy Daemon activate the Allow access via TCP option and enter an available port (here 6560).
In this way, the Livestatus proxy on the central site connects to the remote site and opens a port for requests from the viewer site — which are then forwarded to the remote site.
Now create a viewer site and again open the connection settings via Setup > General > Distributed monitoring. In the Basic settings enter — as always for connections in distributed monitoring — the exact name of the central site as the Site ID.

In the Status connection panel, enter the central site as the host — as well as the manually assigned free port (here 6560).
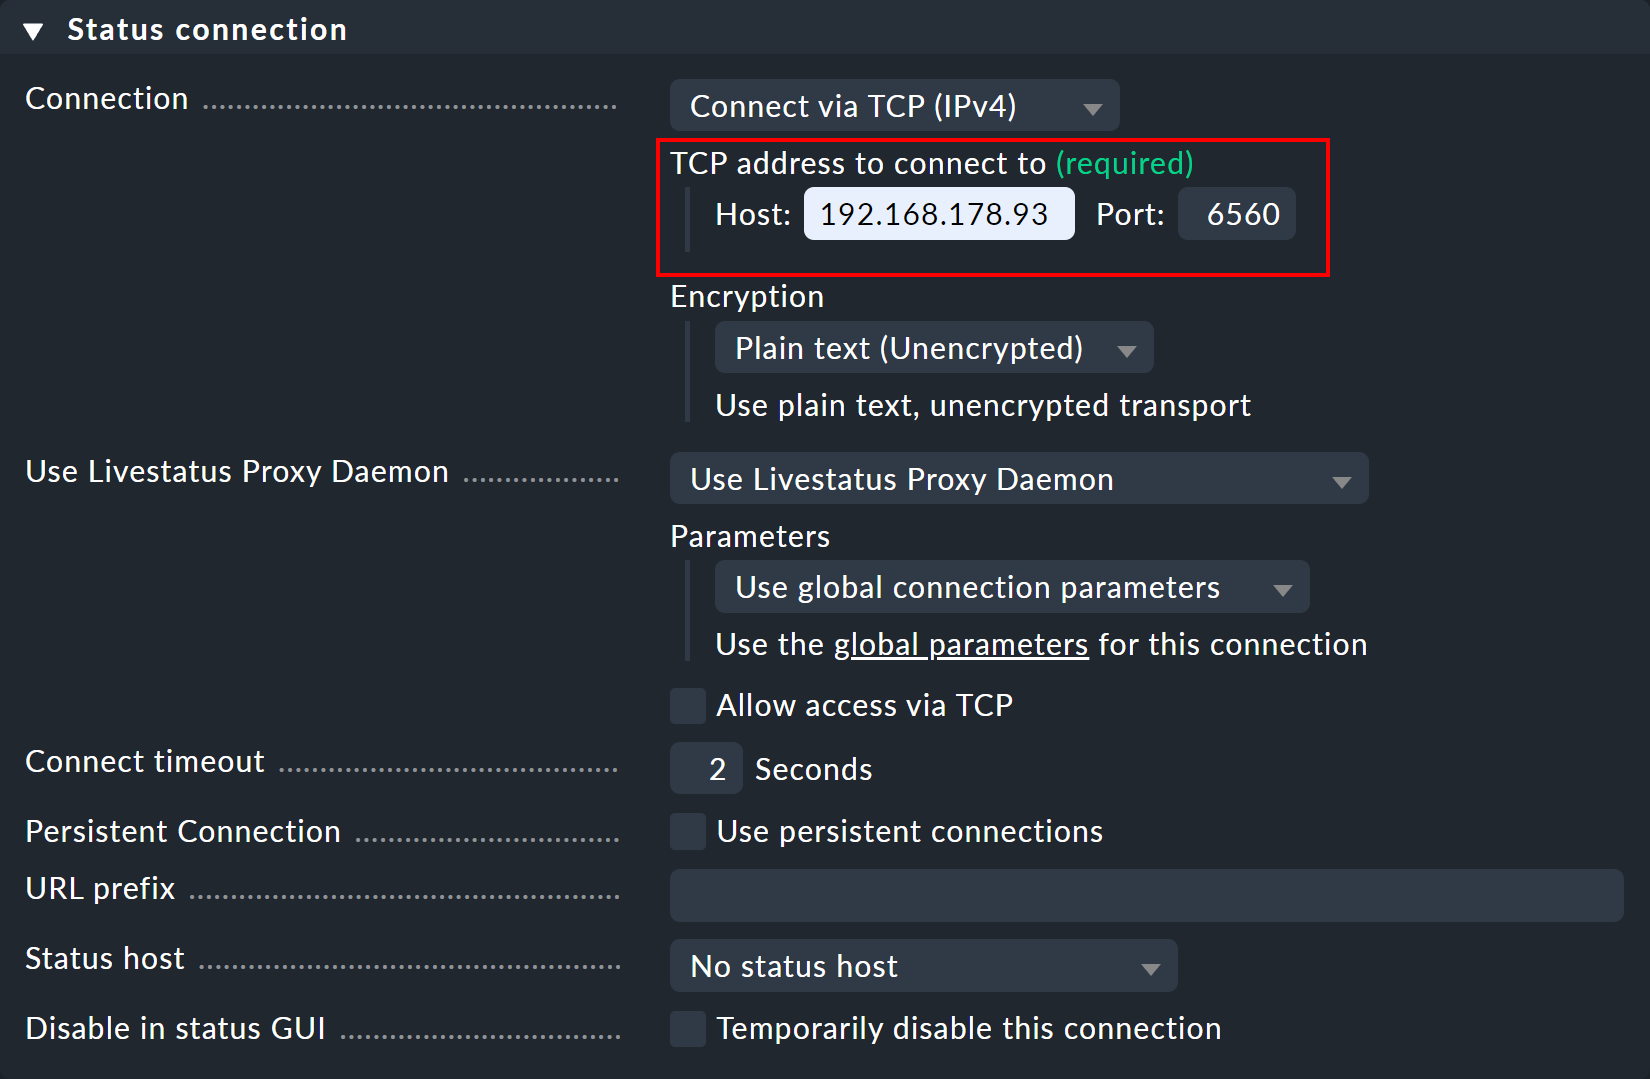
As soon as the connection is established, you will see the desired hosts and services on the remote site in the monitoring views for the viewer site.
If you want to cascade further, you must also allow TCP access to the Livestatus proxy on the viewer site, as done before on the central site, this time with a different free port.
5. Livedump and CMCDump
5.1. Motivation
The concept of a distributed monitoring with Checkmk that has been described up until now is a good and simple solution in most cases. It does however require network access from the central to the remote sites. There are situations in which access is either not possible or not desired, because, for example:
The remote sites are in your customer’s network for which you have no access.
The remote sites are in a security area to which access is strictly forbidden.
The remote sites have no permanent network connection or no fixed IP-addresses and methods like Dynamic DNS are no option.
Distributed monitoring with Livedump, or respectively, CMCDump takes a quite different approach. Firstly, the remote sites are so attached so that they operate completely independently of the central site and are administered decentralized. A distributed configuration environment will be dispensed with.
All of the remote site’s hosts and services will then be replicated as copies in the central site. Livedump/CMCDump can help by generating a copy of the remote sites’ configuration which can then be loaded into the central site.
Now during the monitoring, on every remote site a copy of the current status will be
written to a file at predetermined intervals (e.g. every minute).
This will be transmitted to the central site via a user-defined method and will be
saved there as a status update. No particular protocol has been provided or specified
for this data transfer.
Any automatable transfer protocol could be used. It is not essential to use scp –
even a transfer by email is conceivable!
Such a setup differs from a ‘normal’ distributed monitoring in the following ways:
Actualization of the states and performance data in the central site will be delayed.
Calculation of availability on the central site will give minimally different results to a calculation on the remote site.
State changes that occur more quickly than the actualization interval will be invisible to the central site.
If a remote site is ‘dead’, the states will become obsolete on the central site – the services will be ‘stale’, but nonetheless still visible. Performance and availability data for this time period will be ‘lost’ (but they will still be available on the remote site).
Commands on the central site such as Schedule downtimes and Acknowledge problems cannot be transmitted to the remote site.
The central site can never access the remote sites.
Access to log file details by Logwatch is impossible.
The Event Console will not be supported by Livedump/CMCDump.
Since brief state changes – depending on the periodic interval selected on the central site – may not be visible, a notification through the central site is not ideal. If however the central site is utilized as a purely display site – as a central overview of all customers for example – this method definitely has its advantages.
Incidentally, Livedump/CMCDump can be used simultaneously alongside distributed monitoring over Livestatus without problems. Some sites are are simply connected via Livestatus directly – others use Livedump. Livedump can also be added to one of the Livestatus remote sites.
5.2. Installing Livedump
If you are installing the
Checkmk Raw Edition (or the CEE with a Nagios core),
use the
livedump tool. The name is derived from Livestatus and
Status-Dump. From the Checkmk Version 1.2.8p12
livedump is located directly in the search path and is thus available
as a command.
In older versions you can find it under ~/share/doc/check_mk/treasures/livedump/livedump.
We will make the following assumptions:
the remote site has been fully set up and is actively monitoring hosts and services,
the central site has been started and is running,
at least one host is being locally monitored on the central site (because the central monitors itself).
Transferring the configuration
First, on the remote site, create a copy of its host’s and service’s configurations in
Nagios-configuration format. Also redirect the output from livedump -TC to a file:
OMD[remote1]:~$ livedump -TC > config-remote1.cfgThe start of the file will look something like this:
define host {
    name                    livedump-host
    use                     check_mk_default
    register                0
    active_checks_enabled   0
    passive_checks_enabled  1

}

define service {
    name                    livedump-service
    register                0
    active_checks_enabled   0
    passive_checks_enabled  1
    check_period            0x0

}
Transmit the file to the central site, (e.g. with scp) and save them there in
the ~/etc/nagios/conf.d/ directory – here Nagios expects to find the
configuration data for hosts and services. Select a file name that ends with
.cfg, for example ~/etc/nagios/conf.d/config-remote1.cfg.
If an SSH-access from remote to central site is possible it can be done, for example, as below:
OMD[remote1]:~$ scp config-remote1.cfg central@myserver.mydomain:etc/nagios/conf.d/
central@myserver.mydomain's password:
config-remote1.cfg                                             100% 8071     7.9KB/s   00:00
Now log in to the central site and activate the changes:
OMD[central]:~$ cmk -R
Generating configuration for core (type nagios)...OK
Validating Nagios configuration...OK
Precompiling host checks...OK
Restarting monitoring core...OK
Now all of the remote’s hosts and services should appear in the central site – initially with the PEND state, which they will retain for the time being:

Note:
With the
-Toption inlivedumptemplate definitions are created in Livedump from which it draws the configuration. Without these Nagios cannot be started. Only one of these may be present however. If you import a configuration from another remote site it must not use the-Toption!A dump of the configuration is also possible on a Checkmk Micro core (CMC) — the importing of which requires Nagios. If the CMC is running on your central site use CMCDump.
The copying and transferring of the configuration must be repeated for every change to hosts or services on the remote site.
Transferring the status
Once the hosts are visible in the central site, we will need to setup a (regular) transmission
of the remotes' monitoring status. Again create a file with livedump,
but this time without secondary options:
OMD[remote1]:~$ livedump > stateThis file contains the states of all hosts and services in a format which Nagios can read directly from check results. The start of this file looks something like this:
host_name=myhost1900
check_type=1
check_options=0
reschedule_check
latency=0.13
start_time=1615521257.2
finish_time=16175521257.2
return_code=0
output=OK - 10.1.5.44: rta 0.066ms, lost 0%|rta=0.066ms;200.000;500.000;0; pl=0%;80;100;; rtmax=0.242ms;;;; rtmin=0.017ms;;;;
Copy this file to the central site into the ~/tmp/nagios/checkresults directory.
Important: This file’s name must begin with c and be seven characters long.
With scp it will look something like this:
OMD[remote1]:~$ scp state central@mycentral.mydomain:tmp/nagios/checkresults/caabbcc
central@mycentral.mydomain’s password:
state                                                  100%   12KB  12.5KB/s   00:00
Finally, create an empty file on the central site with the same name and the .ok extension.
With this Nagios will know that the status file has been transferred completely and can
now be read in:
OMD[central]:~$ touch tmp/nagios/checkresults/caabbcc.okThe status of the remotes’ hosts/services will now be immediately updated on the central site:
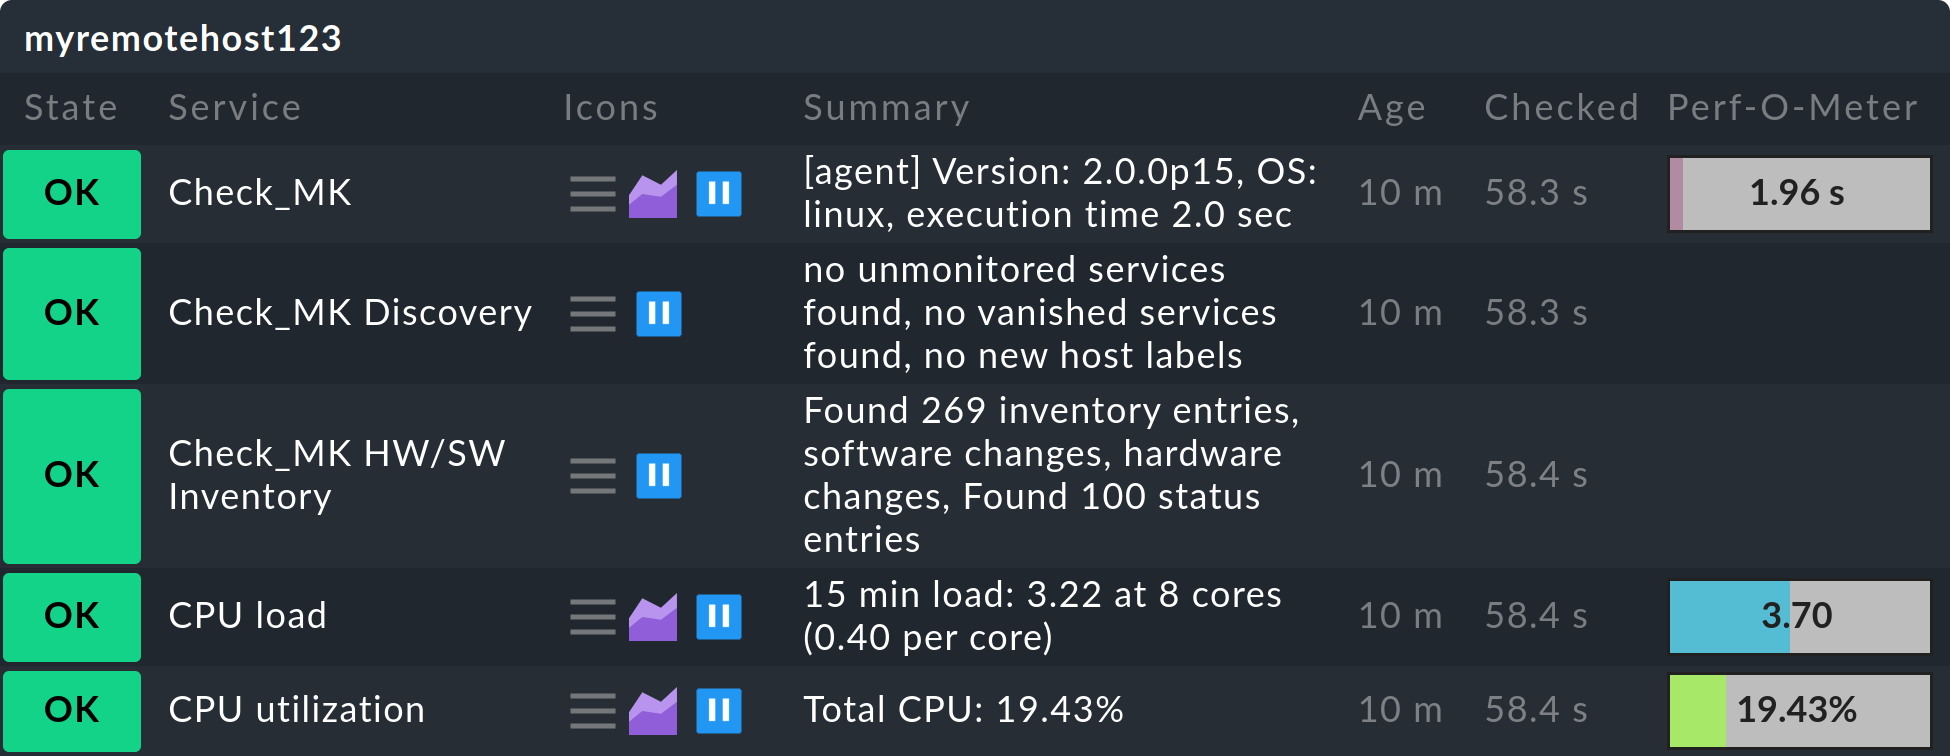
The transmission of the status must from now on be made regularly.
Livedump unfortunately doesn’t support this task and you will need to script it yourself.
The livedump-ssh-recv script can be found
in ~/share/check_mk/doc/treasures/livedump, which you can employ
in order to receive Livedump updates (including those from the configuration)
on the central site per SSH. Details about this can be found in the script itself.
The configuration and status dump can also be restricted by using Livestatus filters.
For example, you could limit the hosts to the members of the mygroup host group:
OMD[remote1]:~$: livedump -H "Filter: host_groups >= mygroup" > stateFurther information on Livedump can be found in the README file in the directory ~/share/doc/check_mk/treasures/livedump.
5.3. Implementing CMCDump
CMCDump is for the Checkmk Micro Core what Livedump
is for Nagios – and it is thus the tool of choice for the Checkmk Enterprise Editions.
In contrast to Livedump, CMCDump can replicate the complete status
of hosts and services (Nagios doesn’t have the required interfaces for this task).
To compare: Livedump transfers the following data:
The current states – i.e. PEND, OK, WARN, CRIT, UNKNOWN, UP, DOWN or UNREACH
The output from Check plug-ins
The performance data
CMCDump additionally synchronizes:
The long output from the plug-in
Whether the object is currently
 flapping
The time stamps for the last check execution and the last state change
The duration of the check execution
The latency of the check execution
The sequence number of the current check attempt and whether the current state is ‘hard’ or ‘soft’
 acknowledged, if present
Whether the object is currently in a
 planned maintenance.
This provides a much more precise reflection of the monitoring. When importing the status the CMC doesn’t just simulate a check execution, rather by using an interface designed for this task it transmits an accurate status. Among other things, this means that at any time the operations center can see whether problems have been acknowledged or if maintenance times have been entered.
The installation is almost identical to that for Livedump, but is however somewhat simpler since there is no need to be concerned about possible duplicated templates or similar.
The copy of the configuration is made with cmcdump -C. Store this file on
the central site in etc/check_mk/conf.d/. The .mk file extension must be used:
OMD[remote1]:~$ cmcdump -C > config.mk
OMD[remote1]:~$ scp config.mk central@mycentral.mydomain:etc/check_mk/conf.d/remote1.mk
Activate the configuration on the central site:
OMD[central]:~$ cmk -OAs with Livedump the hosts and services will now appear on the central site in the
PEND state. You will however see by the ![]() symbol that we
are dealing with a shadow object. In this way it can be distinguished
from an object being monitored directly on the central site or on a ‘normal’ remote site:
symbol that we
are dealing with a shadow object. In this way it can be distinguished
from an object being monitored directly on the central site or on a ‘normal’ remote site:

The regular generation of the status is achieved with cmcdump without
additional arguments:
OMD[remote1]:~$ cmcdump > state
OMD[remote1]:~$ scp state central@mycentral.mydomain:tmp/state_remote1
To import the status to the central site the file content must be written into the
tmp/run/live UNIX-Socket with the help of the unixcat tool.
OMD[central]:~$ unixcat tmp/run/live < tmp/state_remote1If you have a connection from the remote to the central site via SSH without a password all three commands can be combined into a single one – and when so doing not even a temporary file is created:
OMD[remote1]:~$ cmcdump | ssh central@mycentral.mydomain "unixcat tmp/run/live"It really is so simple! But, as already mentioned, ssh/scp is
is not the only method for transferring files, and a configuration or status
can be transferred just as well using email or another desired protocol.
6. Notifications in distributed environments
6.1. Centralized or decentralized?
In a distributed environment the question arises – from which site should the notifications (e.g. emails) be sent: from the individual remotes or from the central site? There are arguments in favor of both procedures.
Arguments for sending from the remotes:
Simpler to set up
A local notification is still possible if the link to the central site is not available
Also works with the
Checkmk Raw Edition
Arguments for sending from the central site:
Notifications can be further processed at a central location (e.g. be forwarded to a ticket system)
remote sites require no setting up for email or SMS
For sending an SMS over hardware this is only required once – on the central site
6.2. Decentralized notification
No special steps are required for a decentralized notification since this is the standard setting. Every notification that is generated on a remote site runs through the chain of notifications rules there. If you implement a distributed configuration environment these rules are the same on all sites. Notifications resulting from these rules will be delivered as usual, for which the appropriate notification scripts will have been run locally.
It must simply be ensured that the appropriate service has been correctly installed on the sites – that a smart host has been defined for emails for example – in other words the same procedure as for setting up an individual Checkmk site.
6.3. Centralized notification
Fundamentals
The
Checkmk Enterprise Editions provide a built-in mechanism for centralized notifications which can be individually activated for each remote site.
Such remotes then route all notifications to the central site for further processing.
The centralized notification is thereby independent of whether the distributed monitoring has been set up in the standard way, or with CMCDump, or by using a blend of these procedures.
Technically speaking, the central notification server does not even need to be the ‘central’. This task can be taken on by any Checkmk site.
If a remote site has been set to ‘forwarding’, all notifications will be forwarded directly to the central site as they would be from the core – effectively in a raw format. Once there the notification rules will be evaluated which actually decide who should be notified and how. The required notification scripts will be invoked on the central site.
Setting up the TCP-connections
The remote and (notification-)central notification spoolers communicate with each other via TCP. Notifications are sent from remote to central site. The central acknowledges to the remotes that the notifications have been received, which prevents notifications being lost even if the TCP connection is broken.
There are two alternatives for the construction of a TCP-connection:
A TCP-connection is configured from central to remote site. Here the remote is the TCP-server.
A TCP-connection is configured from remote to central site. Here the central is the TCP-server.
Consequently there is nothing standing in the way of forwarding notifications if for network reasons establishing connections is only possible in a specific direction. The TCP-connections are supervised by the spooler with a heartbeat signal and are immediately reestablished as needed – not only in the event of a notification.
Since remote and central site require different global settings you must make site specific settings for all remotes. Configuring the central site is performed using the normal global settings. Please note – these settings will be automatically inherited by all remotes for which no specific settings have been defined.
Let us look first at an example where the central site establishes the TCP-connections to the remote sites.
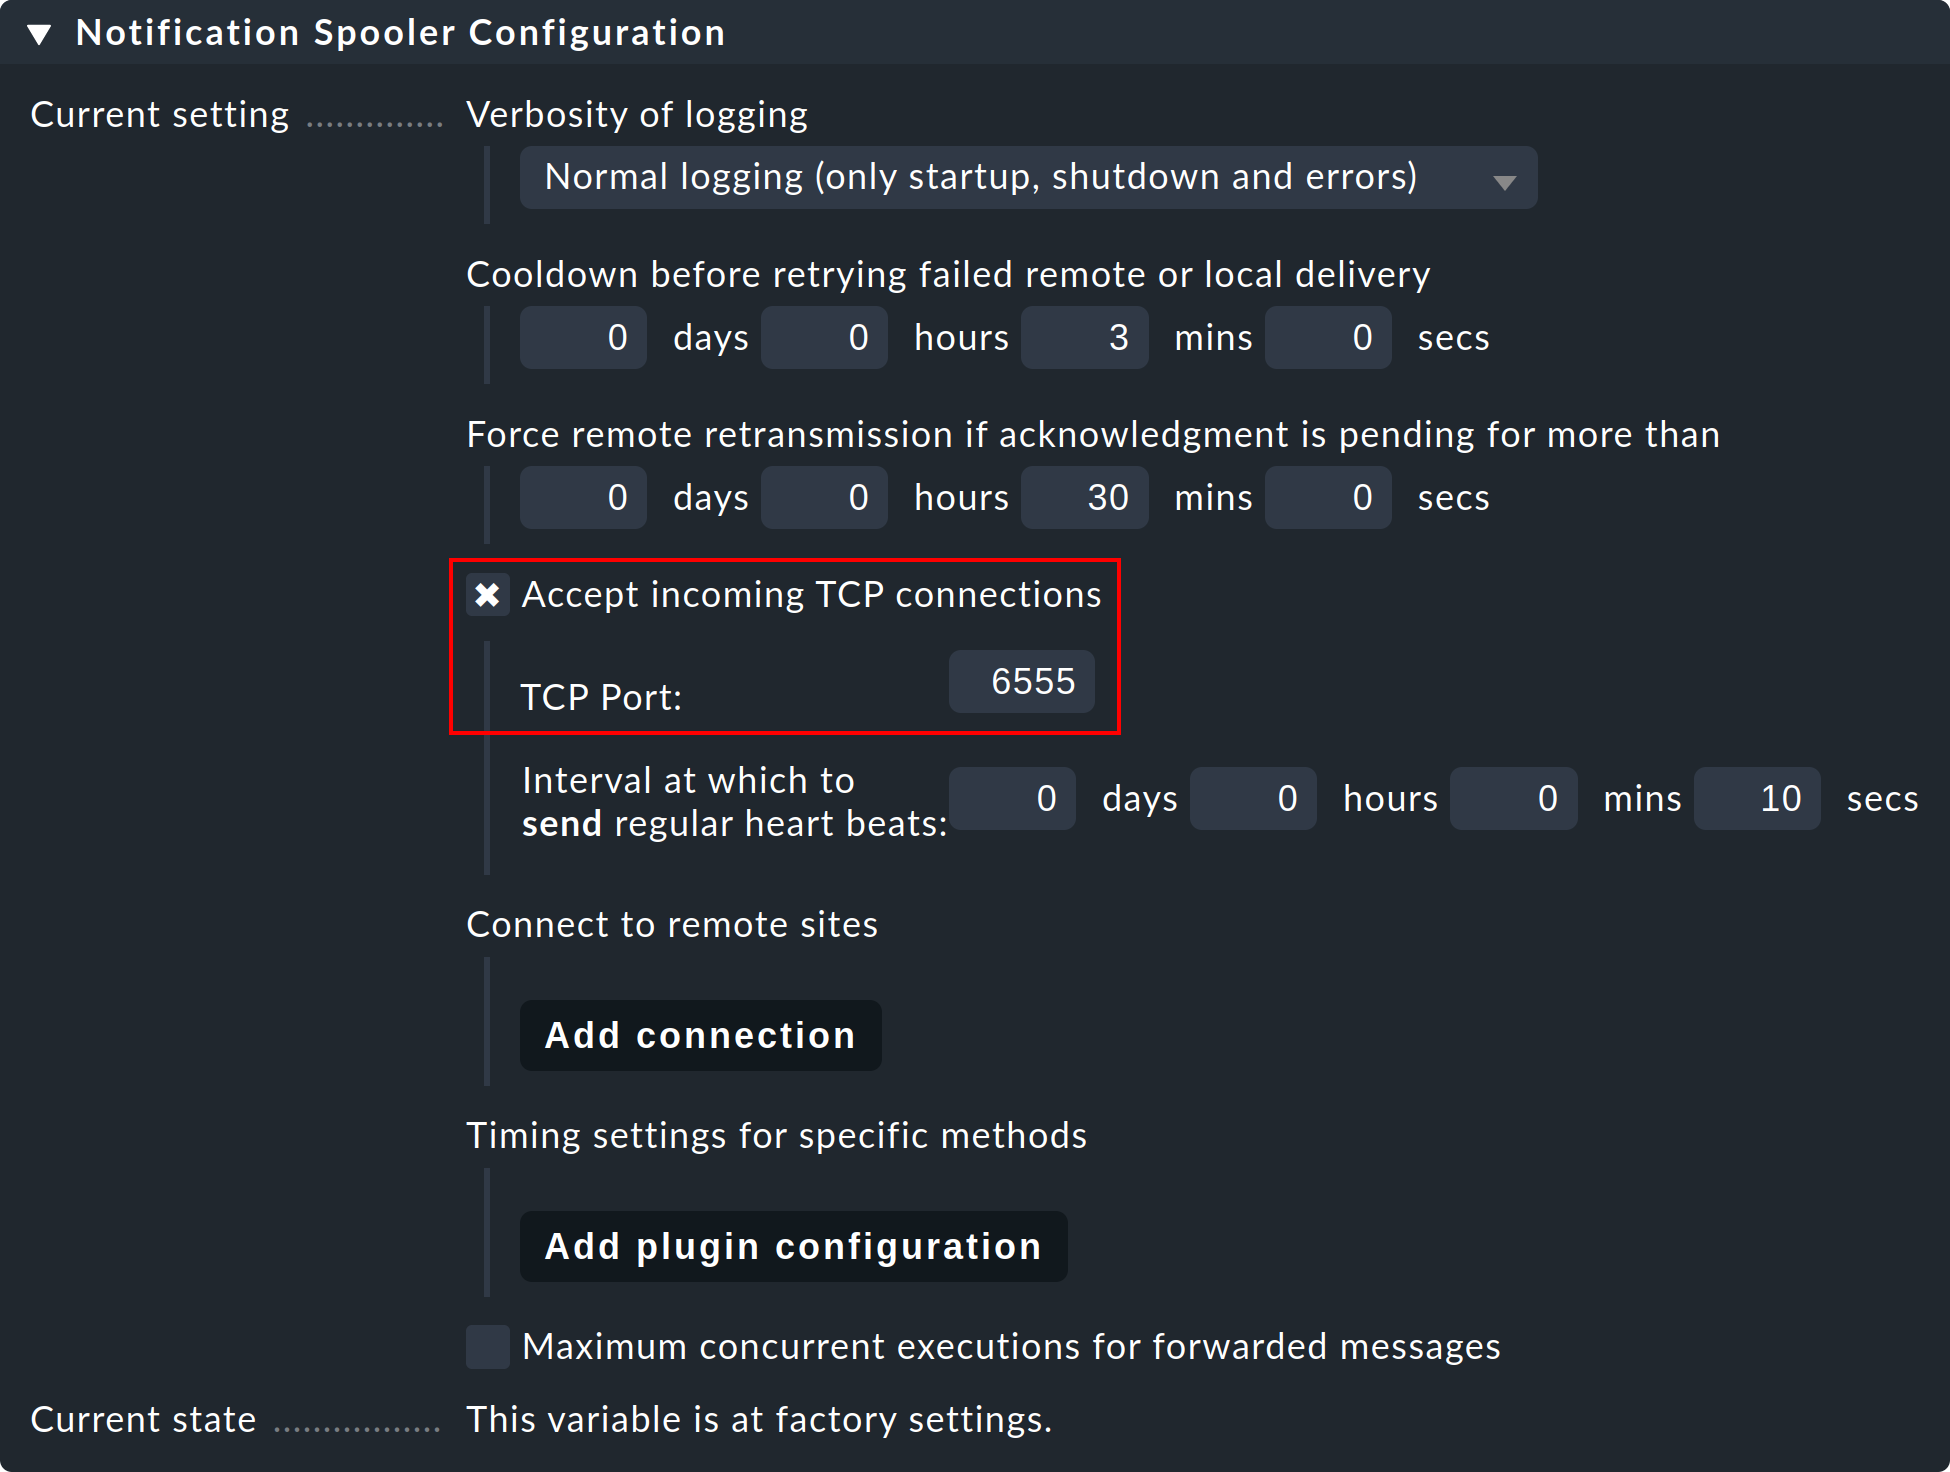
Step 1: On the remote site, edit the site specific global setting Notifications > Notification Spooler Configuration and activate Accept incoming TCP connections. TCP-Port 6555 will be recommended for incoming connections. If there are no objections, adopt these settings.
Step 2: Now, likewise, in the Notification Spooling submenu only on the remote site, select the option Forward to remote site by notification spooler.

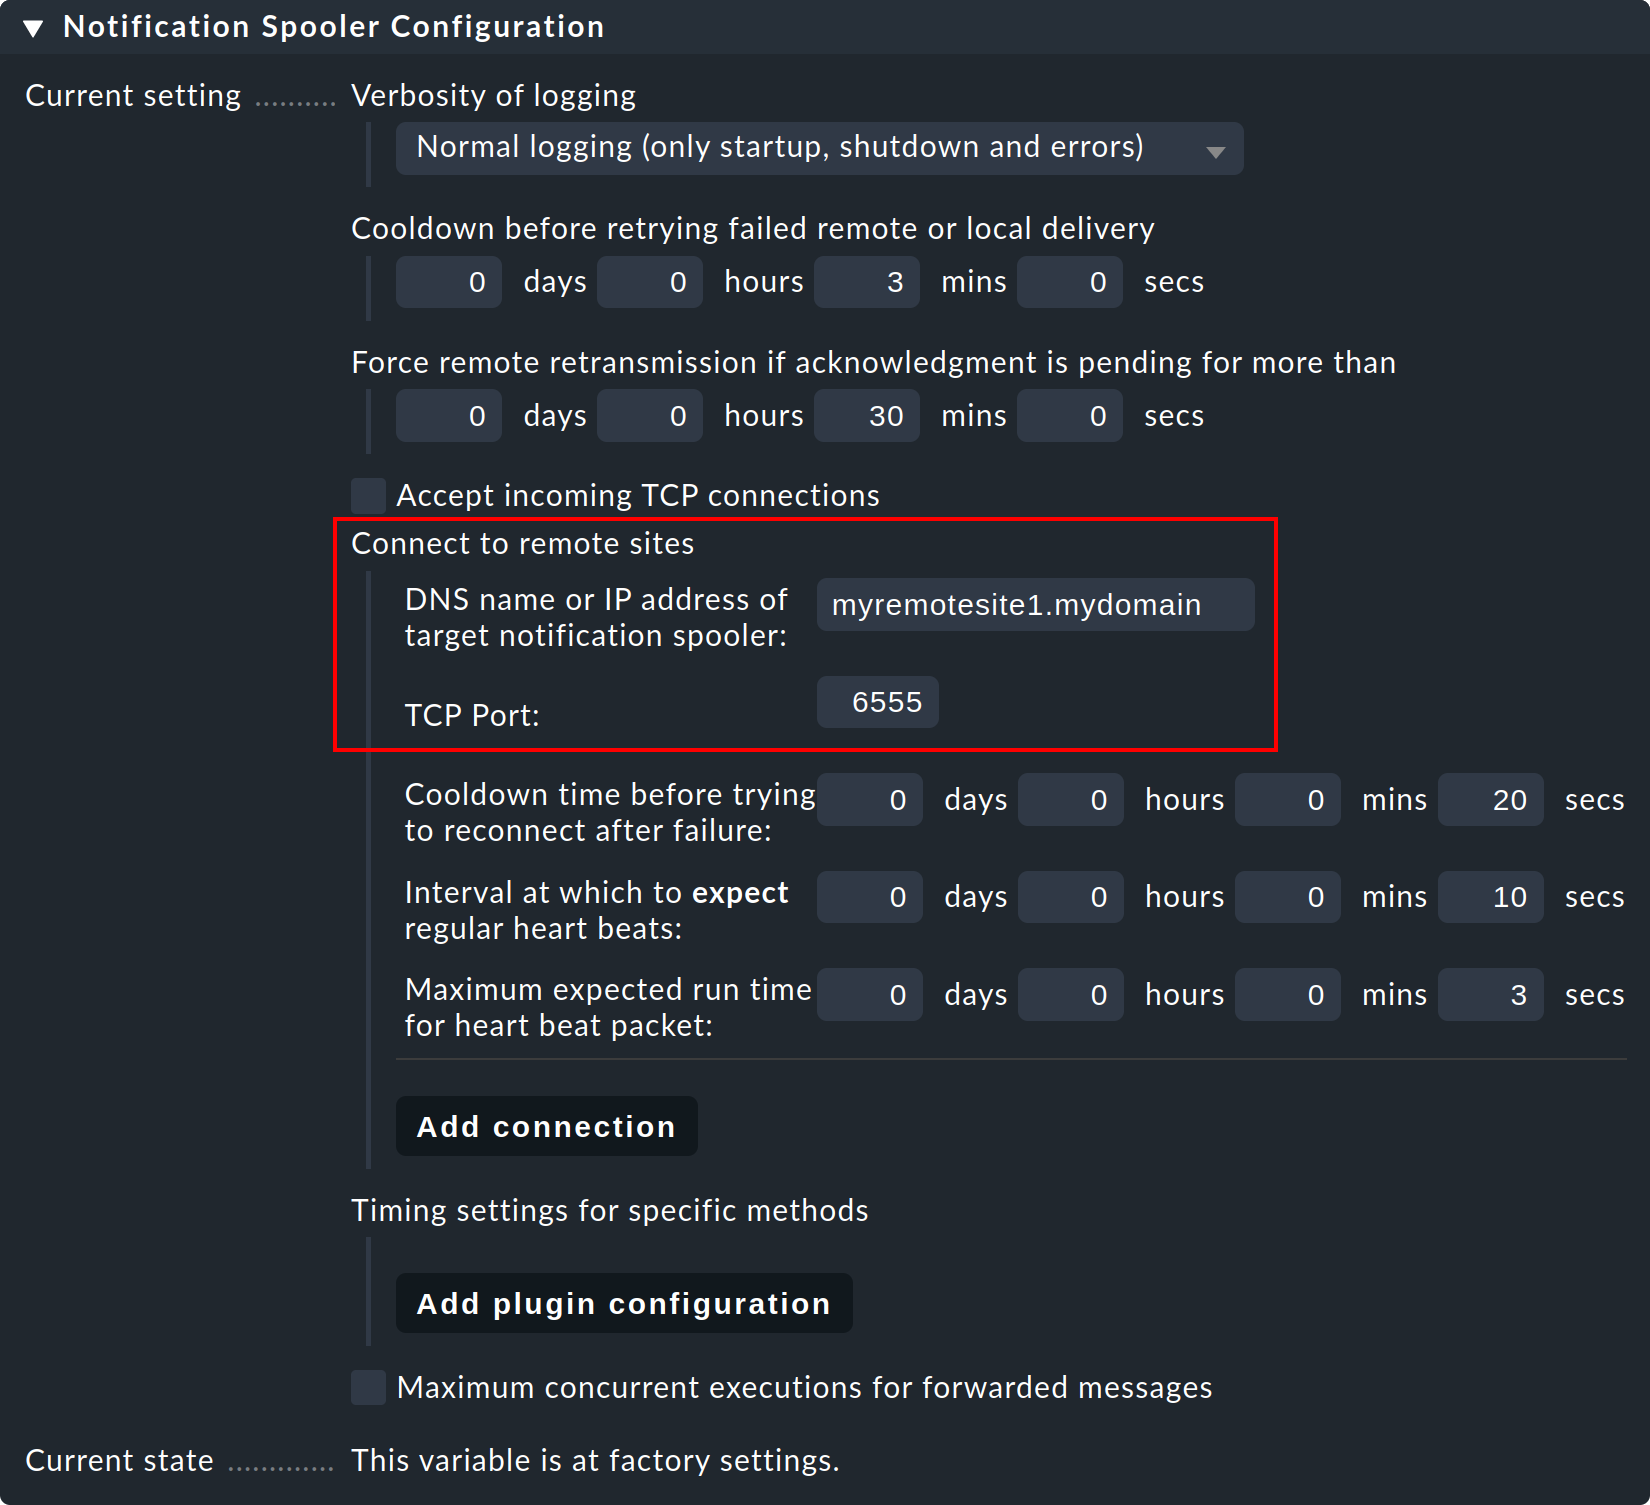
Step 3: Now, on the central site – i.e. in the normal global settings – configure the connection to the remote site (and then to additional remotes as needed):
Step 4: Set the global setting Notification Spooling to Asynchronous local delivery by notification spooler, so that the central site’s communications will also be processed over the same central spooler.

Step 5: Activate the changes.
Establishing connections from a remote site
If the TCP-connection should be established from the remote outwards, the procedure is identical, differing only from the description above by simply exchanging the roles of central and remote site.
A blend of the two procedures is also possible. In such a case the central site must be installed so that it listens to incoming connections as well as connecting to remote sites. However in every central/remote relationship only one of the pair is permitted to establish the connection!
Test and diagnose
The notification spooler logs to the var/log/mknotifyd.log file.
In the spooler configuration the log level can be raised so that more messages are received.
With a standard log level one should see something like this on the central site:
2021-11-17 07:11:40,023 [20] [cmk.mknotifyd] -----------------------------------------------------------------
2021-11-17 07:11:40,023 [20] [cmk.mknotifyd] Check_MK Notification Spooler version 2.0.0p15 starting
2021-11-17 07:11:40,024 [20] [cmk.mknotifyd] Log verbosity: 0
2021-11-17 07:11:40,025 [20] [cmk.mknotifyd] Daemonized with PID 31081.
2021-11-17 07:11:40,029 [20] [cmk.mknotifyd] Connection to 10.1.8.44 port 6555 in progress
2021-11-17 07:11:40,029 [20] [cmk.mknotifyd] Successfully connected to 10.1.8.44:6555
At all times the var/log/mknotifyd.state file contains the current status of
the spooler and all of its connections:
Connection:               10.1.8.44:6555
Type:                     outgoing
State:                    established
Status Message:           Successfully connected to 10.1.8.44:6555
Since:                    1637129500 (2021-11-17 07:11:40, 140 sec ago)
Connect Time:             0.002 sec
A version of the same file is also present on the remote site. There the connection will look something like this:
Connection:               10.22.4.12:56546
Type:                     incoming
State:                    established
Since:                    1637129500 (2021-11-17 07:11:40, 330 sec ago)
To test, select any monitored remote service and set it manually to CRIT with the Fake check results command.
Now on the central site an incoming notification should appear in the notifications log file (notify.log):
2021-11-17 07:59:36,231 ----------------------------------------------------------------------
2021-11-17 07:59:36,232 [20] [cmk.base.notify] Got spool file 307ad477 (myremotehost123;Check_MK) from remote host for local delivery.
The same event will look like this on the remote site:
2021-11-17 07:59:28,161 [20] [cmk.base.notify] ----------------------------------------------------------------------
2021-11-17 07:59:28,161 [20] [cmk.base.notify] Got raw notification (myremotehost123;Check_MK) context with 71 variables
2021-11-17 07:59:28,162 [20] [cmk.base.notify] Creating spoolfile: /omd/sites/remote1/var/check_mk/notify/spool/307ad477-b534-4cc0-99c9-db1c517b31f
In the global settings, as well as the normal notifications log (notify.log)
you can also alter the notification spooler’s log to a higher log level.
Monitoring the spooling
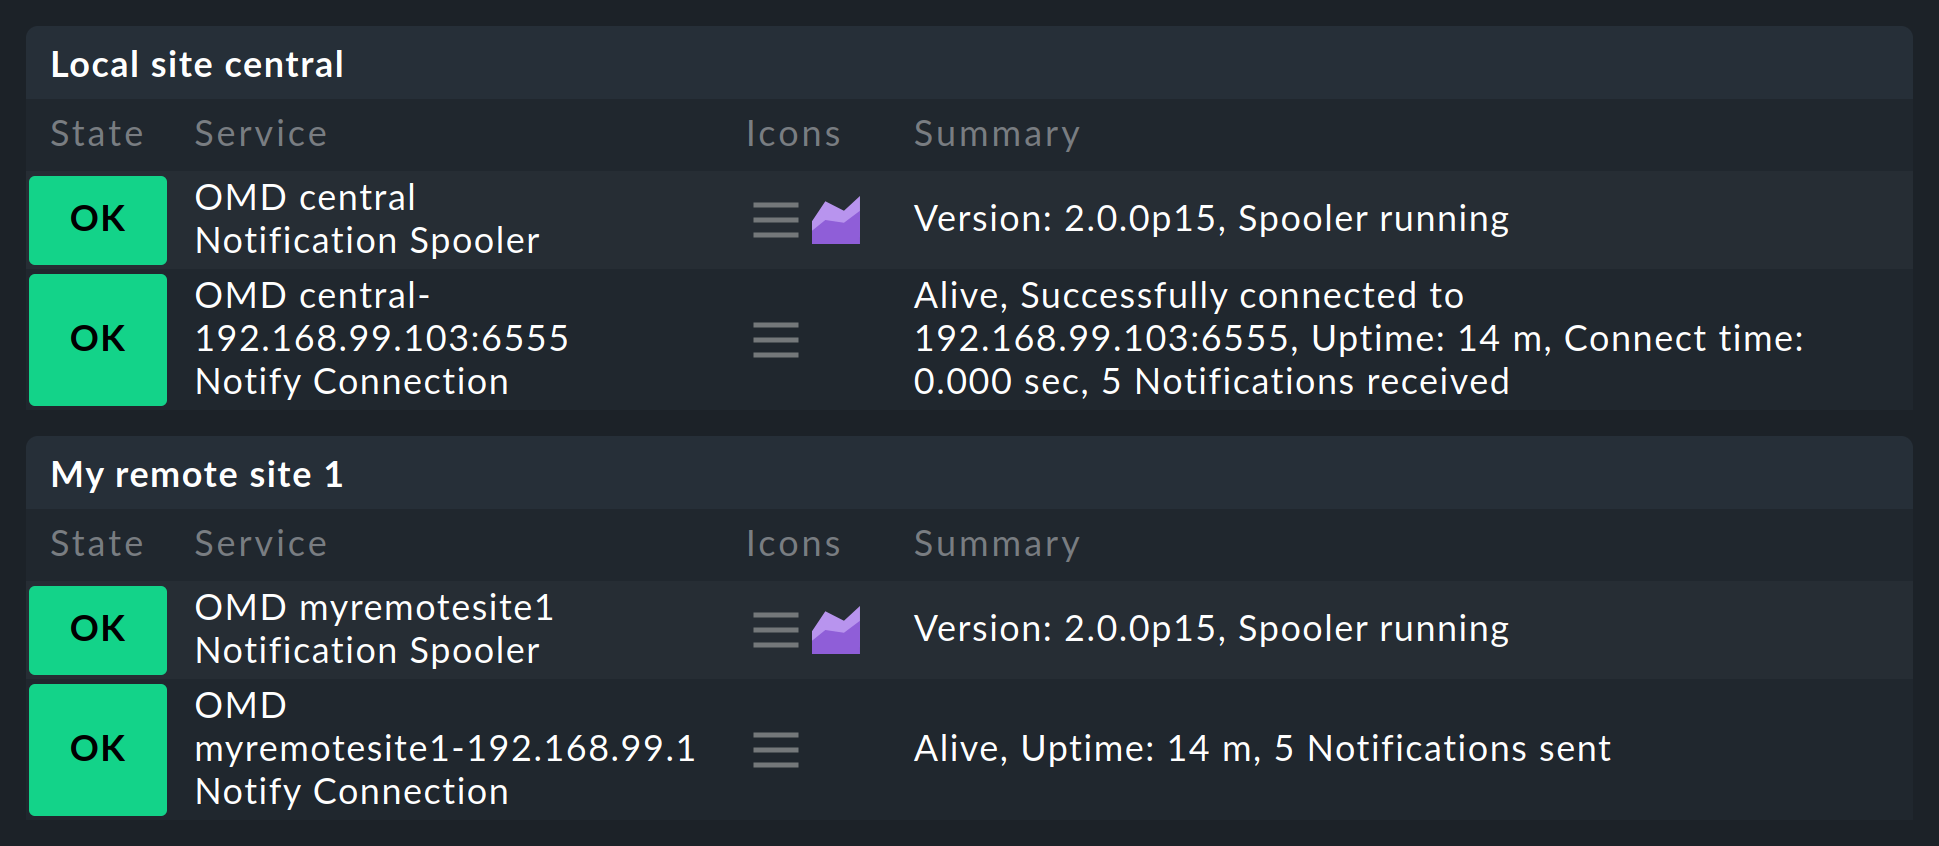
Once you have set up everything as described you will notice that on the central site, and respectively on the remotes, a new service will be found that must definitely be taken into the monitoring. This monitors the notification spooler and its TCP-connections. Every connection will thereby be monitored twice: once by the central, and once by the remote site:
7. Files and directories
7.1. Configurations files
| Path | Description |
|---|---|
|
Here Checkmk stores the configuration for the connections to the individual sites. If the interface ‘hangs’ due to an error in the configuration, so that it becomes inoperable, you can edit the disruptive entry directly in the file. If the Livestatus proxy is activated however, it will subsequently be necessary to edit and save at least one connection, since only with this action will a suitable configuration be generated for this daemon. |
|
Configuration for the Livestatus proxy. This file will be freshly-generated by Checkmk with every alteration in the configuration of a distributed monitoring. |
|
Configuration for the notification spooler. This file will be generated by Checkmk when saving the global settings. |
|
This is created on the remote sites and ensures that they only monitor their own hosts. |
|
Storage location for customer-created Nagios-configurations files with hosts and services. These are required for the use of Livedump on the central site. |
|
The configuration of Livestatus for the use of Nagios as the core. Here you can configure the maximum number of simultaneous connections allowed. |
|
The configuration of hosts and rules for Checkmk. Store configurations files that are generated by CMCDump here. Only the |
|
For services found by the service discovery. These are always stored locally on the remote site. |
|
Location of the Round-Robin-Database for archiving the performance data when using the Checkmk-RRD-format (the default with the Enterprise Editions) |
|
Location of the Round-Robin-Database with the PNP4Nagios-format ( |
|
Log file for the Livestatus proxies. |
|
The current state of the Livestatus proxies in a readable form. This file is updated every 5 seconds. |
|
Log file for the Checkmk notification system. |
|
Log file for the notification spooler. |
|
The current state of the notification spooler in a readable form. This file is updated every 20 seconds. |
