1. Introduction
In Checkmk you can monitor your infrastructure in many different ways. Monitoring by means of agents or SNMP are only two of a number of methods. What both have in common is that they only report states as the host sees them from the inside, but you will probably be aware of some services that can only be monitored effectively from the outside. Whether the web server is functioning can still be verified from the inside, but however, the accessibility and response times of the actual user cannot be determined in this way.
Checkmk provides its active checks for such situations. These checks allow you to monitor network services directly and conveniently from the outside, and to display the information in your monitoring. Active checks are small programs or scripts that connect to a service in the network or the internet, and then provide the user with the monitoring data. Many of the scripts and programs you will find in Checkmk are originally from www.monitoring-plugins.org. Since Checkmk is generally compatible with Nagios, you can also use all of the plug-ins that work under Nagios.
When you integrate such plug-ins, keep in mind the main purpose of active checks — In terms of end-to-end monitoring, they are supposed to check the accessibility, response time, or response status of a network-accessible service on the monitored host. Checkmk offers a range of efficient checks for many other monitoring tasks. You can find an overview in the article Write your own check plug-ins.
The most important of these programs and scripts are available in Checkmk directly in the web interface. Here is a small selection:
2. Setting up active checks
2.1. Setting up regular active checks
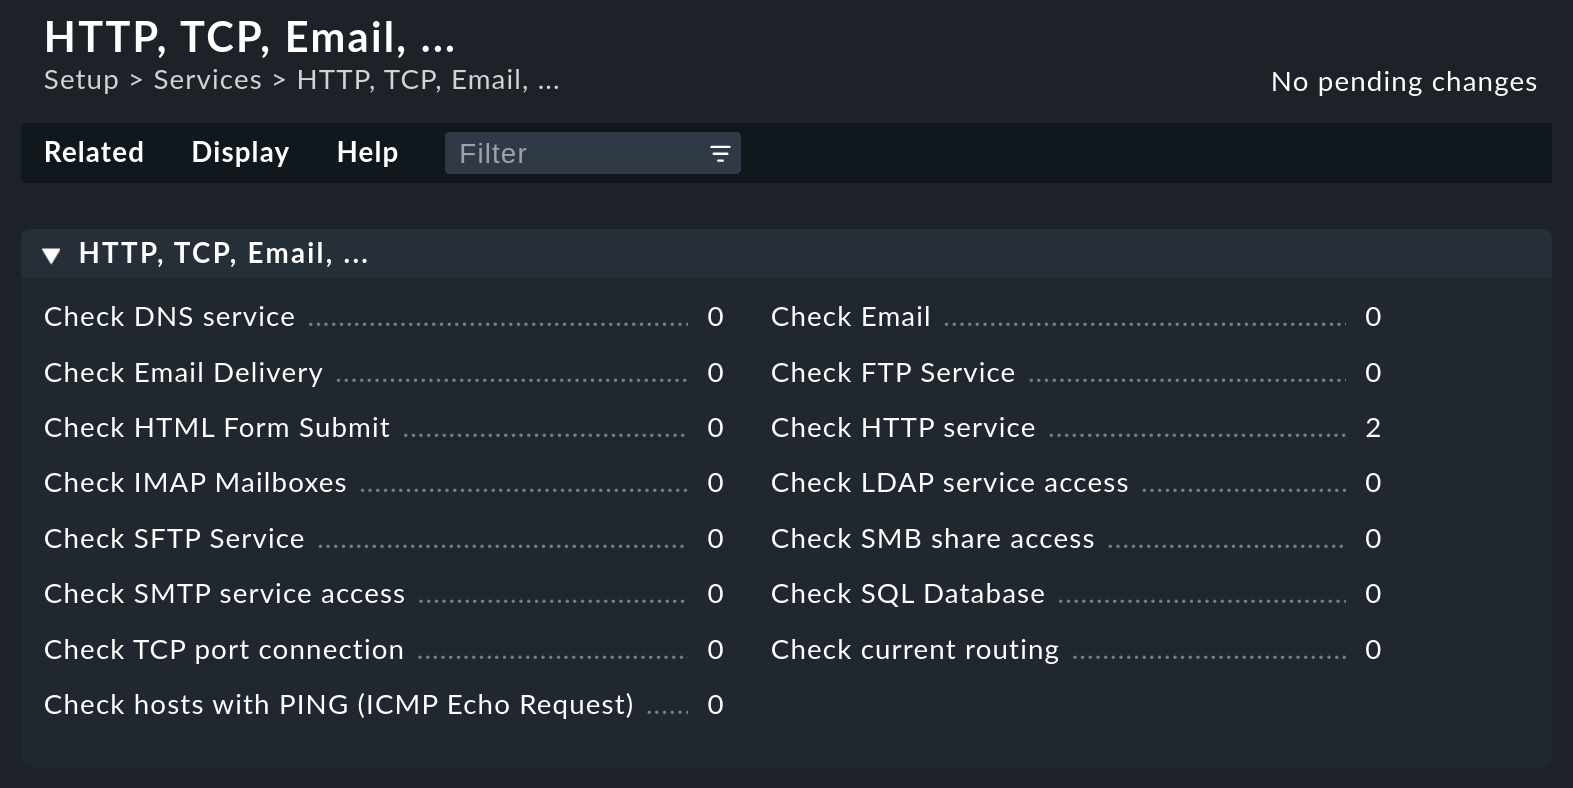
In the Setup you can — as already mentioned above — set up the most important and most frequently used checks directly in the web interface. To do this, open Setup > Services > HTTP, TCP, Email. Here you will find the rule sets with which you can set up these checks:

Most options in the rule sets are self-explanatory. However if something is
unclear you can also refer to the ![]() inline help for
explanations of the many options.
inline help for
explanations of the many options.
2.2. Assigning active checks to a host
For some rules, it is necessary to specify an IP address or host name in the
options. In many places it is possible to leave this option empty, so that the
host name or the IP is adopted from the hosts for which this rule applies.
In this way you can easily use just one rule to provide a whole group of hosts
with an active check. Therefore always make sure — also with the aid of the
already-mentioned ![]() inline help — whether this option is available in the specific rule set.
You may thus save yourself a lot of configuration work.
inline help — whether this option is available in the specific rule set.
You may thus save yourself a lot of configuration work.
Here is an example using the HTTP check: Let’s assume you want to monitor the validity of the certificates for all of the web servers in your infrastructure, but do not want to create dozens or even hundreds of rules:

To accomplish this with a single rule, first think about how best to fill the
Conditions. In the following example we use the function of labels.
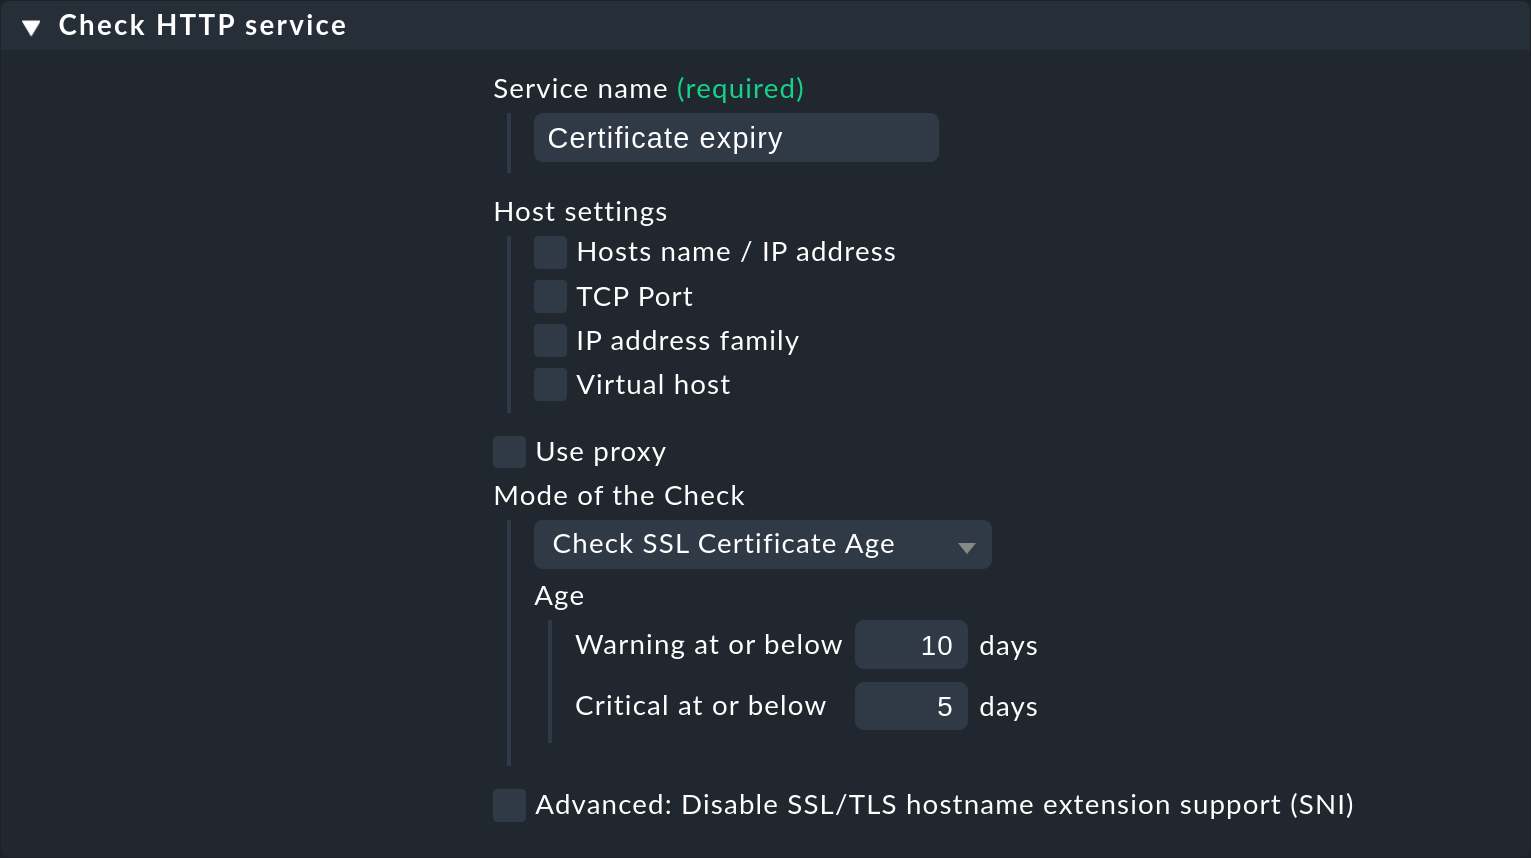
In our case, we have previously set the label webprotocol:https for all of our web servers.
Using this label we can now create a rule and set the Conditions to reference this label:

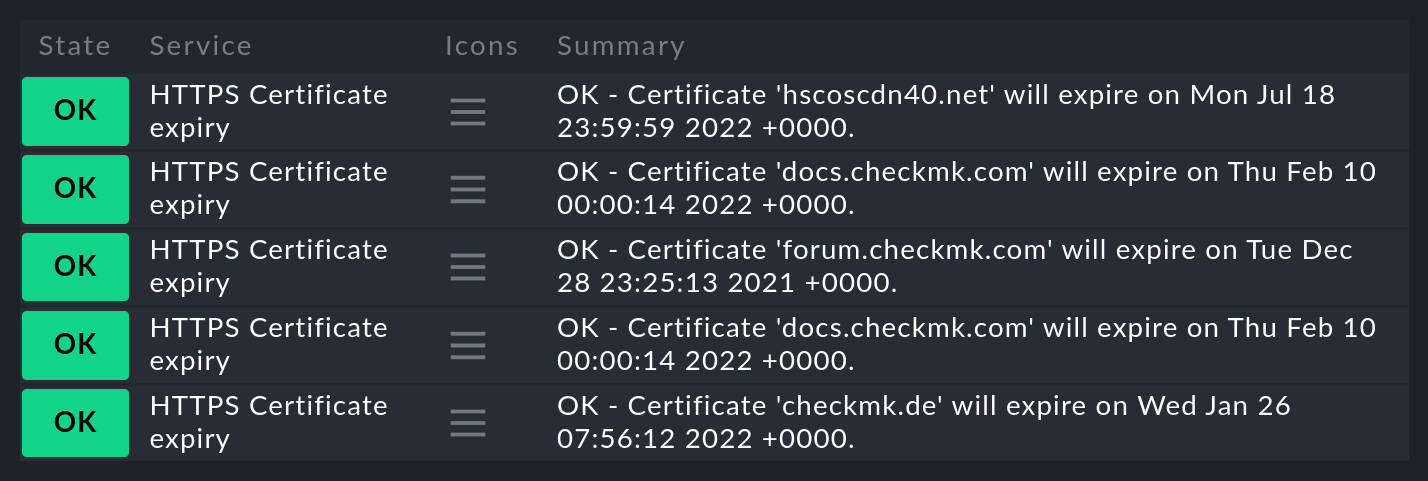
After you have activated the rule you have just created, search in the Monitor menu
for the service name Certificate expiry you just set. In the following example the label has been
set on four hosts. With the Summary you can then actually see that several
websites were checked, because the expiration dates of their certificates are slightly
different:

Important: Note that for active checks, not only the first rule to which the conditions apply is evaluated, but rather all rules for which the conditions for a host apply! Only in this way is it possible to set up multiple services on one host.
2.3. Integrating other Nagios-compatible plug-ins
Not only the active checks which you can find as rule sets in the web interface are available to you in Checkmk of course. In addition to these check plug-ins, you will find many more in your site. To simplify the example of an overview shown here, only selected relevant lines are displayed in the following sample output:
OMD[mysite]:~$ ll ~/lib/nagios/plugins/
total 2466
-rwxr-xr-x 1 root root   56856 Feb  3 00:45 check_dig
-rwxr-xr-x 1 root root    6396 Feb  3 00:45 check_flexlm
-rwxr-xr-x 1 root root    6922 Feb  3 00:45 check_ircd
-rwxr-xr-x 1 root root   60984 Feb  3 00:45 check_ntp_peer
-rwxr-xr-x 1 root root   78136 Feb  3 00:45 check_snmp
Each of these check plug-ins also offers a help option (-h),
which allows you to learn more about how to use the respective plug-in without
having to visit the monitoring-plugins website.
In Setup > Services > Other services Checkmk offers the special rule set Integrate Nagios plugins to make these plug-ins convenient to use. The two most important options here are the specification of a service description and a command line. The latter can be written as if you are already in the correct directory:

Note that the above-mentioned macros, such as $HOSTNAME$ or
$HOSTADDRESS$ are also available here. A list of all of the available
macros can be found as always in the ![]() inline help. After activating the changes, you can see the new service on the assigned host:
inline help. After activating the changes, you can see the new service on the assigned host:

Using your own plug-ins
In some cases, you will have already written your own plug-ins and now want to use them in Checkmk. In this case the procedure is largely identical. The only requirement is that the plug-in is compatible with Nagios. This includes a single line output with the details of the status and an exit code describing the status. This must be 0 for OK, 1 for WARN, 2 for CRIT or 3 for UNKNOWN.
A short example to illustrate the very simple syntax shows the following script that you can create e.g. in the tmp subdirectory of the site directory:
#!/bin/bash
echo "I am a self written check and I feel well."
exit 0
With a single action place the plug-in in the local file path for your site and make it executable:
OMD[mysite]:~$ install -m755 ~/tmp/myscript.sh ~/local/lib/nagios/plugins/The rest of the procedure is then identical to other plug-ins which are created via the Integrate Nagios plugins rule set, so that you can see the new service at the end:

3. Special features of active checks
Services that were created by active checks behave differently in some respects than other services. So the services of an active check…
… continue to be checked even if a host is DOWN.
… execute independently of other (passive) services. This also allows you to set your own interval.
… are always executed by the Checkmk site’s server. Exceptions are MRPEs, which are executed directly on a host.
… are not incorporated via service discovery, but are generated automatically.
4. Running active checks on a host (MRPE)
Suppose you are monitoring a host A (e.g. a web server) from your Checkmk site, which in turn accesses services from host B (e.g. a database). Monitoring the services on host B directly from the Checkmk site will most likely be corrupted by other packet run times, etc., and therefore will not give any accurate indication of how the accessibility from host A behaves in operation. Here it is convenient to have a Nagios plug-in run from the agent of the monitored host (here A), which directly checks the services on host B.
To run a classic Nagios plug-in on a host being monitored, we provide MK’s Remote Plugin Executor (abbreviated: MRPE). Depending on whether you want to run such a plug-in on a unix-type system or on a Windows system, place it in the appropriate location in the respective agent’s installation directory. In addition you will need a configuration file that determines how the plug-in is to be executed, and what the specific command line for the call looks like.
5. Files and directories
| File path | Description |
|---|---|
|
Here you will find all plug-ins that are delivered with Checkmk. No distinction is made between plug-ins that are written by www.monitoring-plugins.org and those that are written specifically for Checkmk. |
|
You can store your own plug-ins here. They are then dynamically read in, and will also survive an update of the Checkmk site. |
