1. Introduction
Checkmk can monitor containers that you manage with Podman using the agent plug-in mk_podman.py.
This monitors not only general data, such as the status of your Podman host, but also the containers themselves.
As always, you can find a complete list of currently monitorable items in the Catalog of Check Plug-ins.
The agent plugin can communicate with Podman in two different ways.
Either via the Podman API and thus via the associated Unix socket, or directly via the podman command.
You can learn how to configure the agent plugin in the chapters Manual Setup and Setup using the Agent Bakery.
In addition to the status and inventory information that Checkmk can determine via the Podman host—i.e., the host on which Podman is installed and running—Checkmk can also determine detailed status information about the containers themselves. To do this, each container is created as a standalone host in Checkmk if it is to be monitored. Its data is transferred to your Checkmk server using the Piggyback method.
Within the commercial editions, container hosts can be automatically created or removed using the dynamic host management.
2. Manual setup
2.1. Prerequisites
On the Podman host, the Checkmk agent must already be installed and registered.
2.2. Install the agent plug-in
In addition to the agent, you will also need the agent plugin mk_podman.py, which you can find in ![]() Checkmk Community under Setup > Agents > Linux > Plug-ins.
In the commercial editions, go to the Setup menu via Agents > Windows, Linux, Solaris, AIX to first access the Agent Bakery, where you will find the baked packages.
From there, use the menu entry Related > Linux, Solaris, AIX files to access the list of agent files.
Checkmk Community under Setup > Agents > Linux > Plug-ins.
In the commercial editions, go to the Setup menu via Agents > Windows, Linux, Solaris, AIX to first access the Agent Bakery, where you will find the baked packages.
From there, use the menu entry Related > Linux, Solaris, AIX files to access the list of agent files.
Install the plugin on the Podman host in the agent’s plugin directory (by default /usr/lib/check_mk_agent/plugins):
For more detailed information on installing an agent plugin, see the article on the Linux agent.
If you then perform a service discovery on the corresponding host in Checkmk, you should already see several services that include the word Podman in their names:
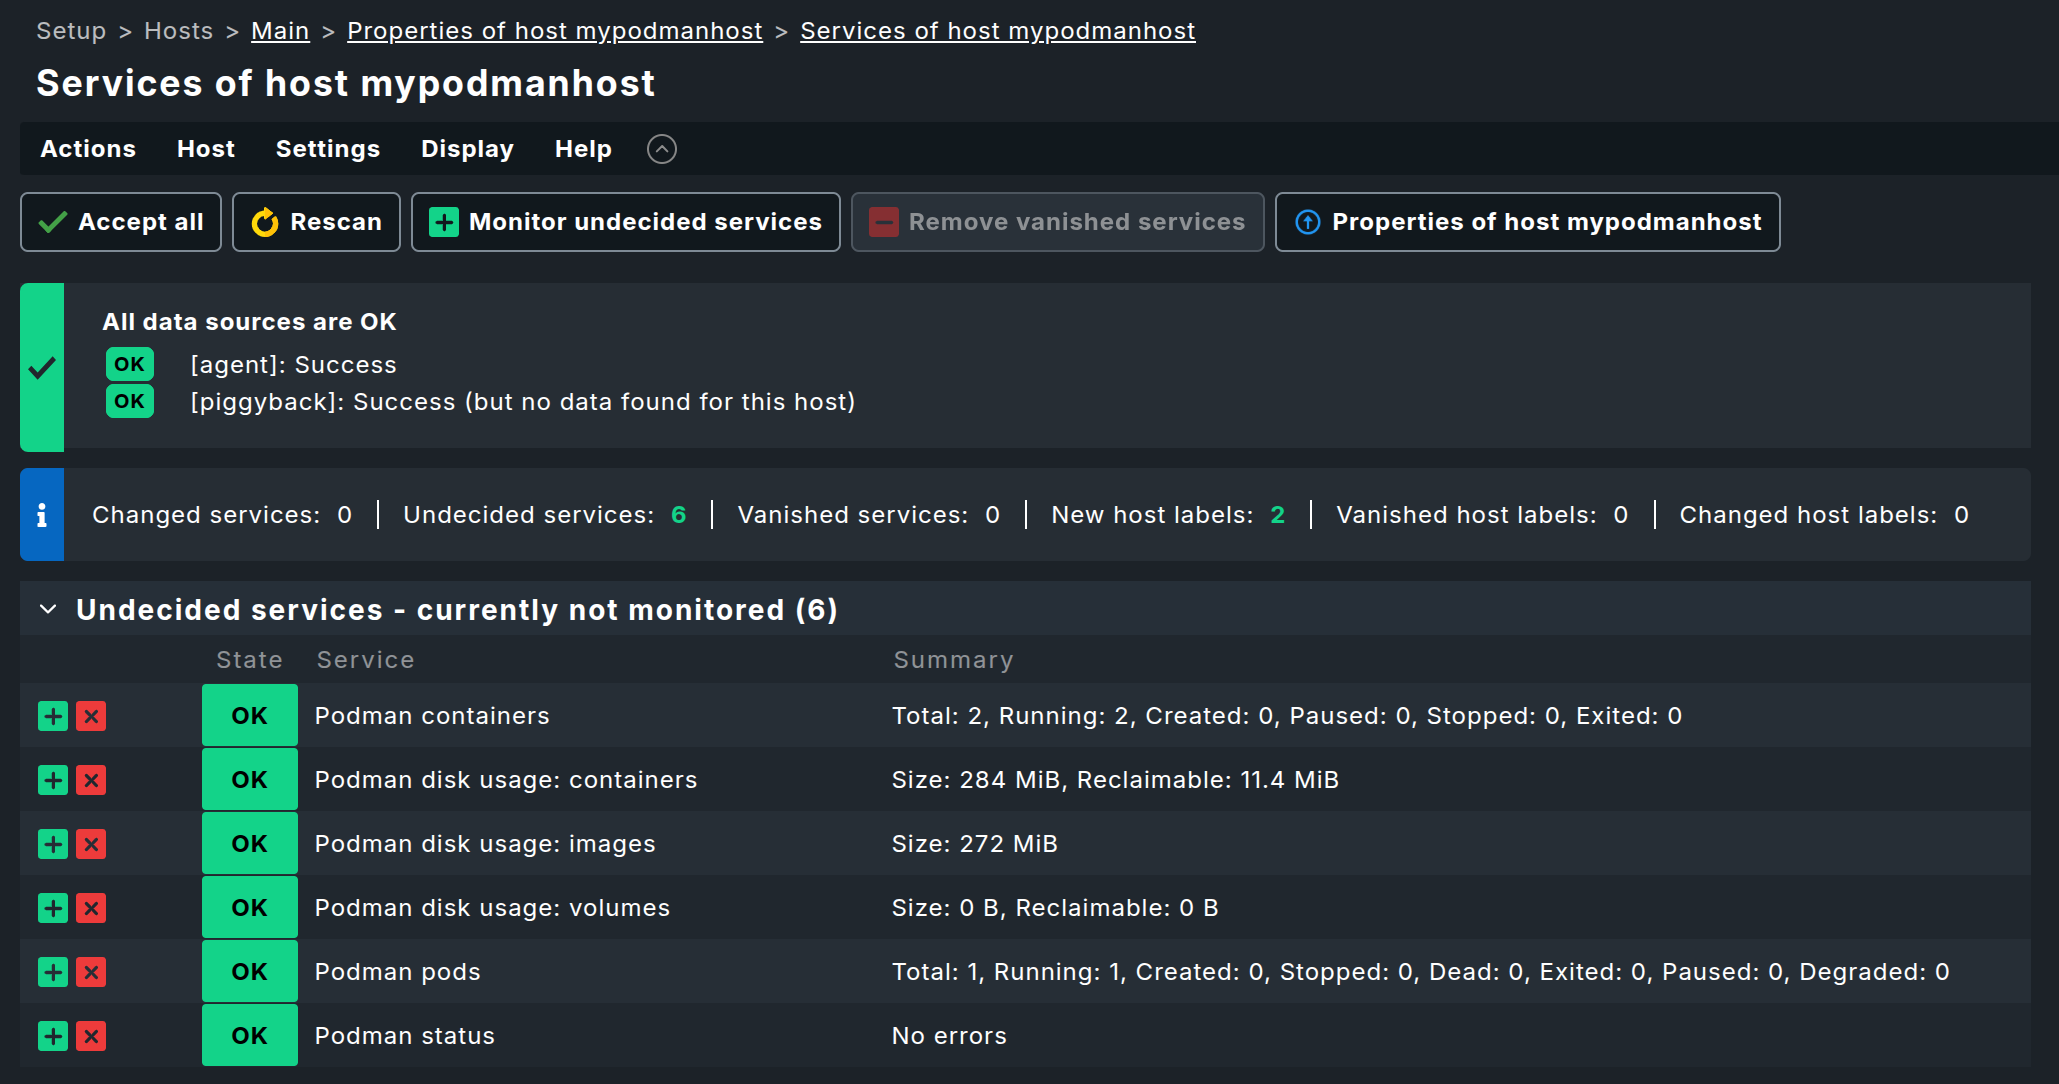
However, if you do not see any Podman services listed here, it may be because the agent plugin’s automatic detection was unable to communicate with your Podman instance through the usual channels. In this case—and also if you want to change certain parameters—you must provide the agent plugin with a configuration. You can learn how to do this in the following chapter Configure agent plug-in.
2.3. Configure the agent plug-in
The agent plug-in usually figures out on its own how to communicate with Podman on the respective host. However, if this automatic detection fails or if you want to specify that only certain sockets—or, for example, only the root socket—should be queried, you can configure the plugin accordingly.
To do this, create a configuration file named mk_podman.cfg on the Podman host in the agent’s configuration directory.
By default, this is /etc/check_mk/.
As a site user of your Checkmk site, you can find a template for this configuration file with detailed explanations in the directory ~/share/check_mk/agents/cfg_examples/mk_podman.cfg.
In the ![]() Checkmk Community graphical interface, you can find the sample configuration under Setup > Agents > Linux > Plug-ins.
In the commercial editions, you can access the Setup menu via Agents > Windows, Linux, Solaris, AIX to first enter the Agent Bakery.
From there, use the menu item Related > Linux, Solaris, AIX files to access the list of agent files.
Checkmk Community graphical interface, you can find the sample configuration under Setup > Agents > Linux > Plug-ins.
In the commercial editions, you can access the Setup menu via Agents > Windows, Linux, Solaris, AIX to first enter the Agent Bakery.
From there, use the menu item Related > Linux, Solaris, AIX files to access the list of agent files.
However, we’d like to briefly touch on a key configuration option here.
This is the connection_method, which determines how mk_podman.py attempts to communicate with your Podman instance.
By default, the agent plugin attempts to communicate with the Podman API via a Unix socket.
Alternatively, you can instruct the plugin to perform monitoring via the podman command.
A corresponding configuration might look like this:
[PODMAN]
connection_method: cli
piggyback_name_method: name_id
3. Setup using the Agent Bakery
![]() In the commercial editions,
setup is greatly simplified by the Agent Bakery, as it helps prevent syntax errors in configuration files and makes it easy to adapt to changing environments.
In the commercial editions,
setup is greatly simplified by the Agent Bakery, as it helps prevent syntax errors in configuration files and makes it easy to adapt to changing environments.
To do this, use the rule set Podman hosts and containers (Linux) and enable the option Deploy Podman plug-in there.

You can also specify the connection method (API or podman command) and the naming convention for the container hosts here.
For details on the available options, see the rule’s inline help.
4. Monitoring the containers
4.1. Creating the container hosts
The really interesting part of monitoring Podman is, of course, monitoring the containers. This data is also provided by the agent plugin. However, the services are not assigned to the Podman host; instead, Checkmk assumes a separate host for each container.
The assignment is handled via the piggyback mechanism. All you need to do is create hosts with the correct names during setup, and the services will be automatically assigned to them.
In the commercial editions, you can have these hosts created automatically. To do this, use the Piggyback data connection type in dynamic host management. You can also create the hosts manually.
Please note the following:
The host name must exactly match the directory created in
~/tmp/check_mk/piggyback.If the containers do not have their own IP address (which is usually the case), set the attribute in the Network address section to No IP under IP address family.
Under Monitoring agents, be sure to set Checkmk agent / API integrations to No API integrations, no Checkmk agent.
You can set the Parents field in the Basic settings section to the hostname of the Podman host.
After you have created the container hosts and performed service discovery, additional services will appear here.
4.2. Renaming the container hosts
The agent plugin mk_podman.py already generates the names for the container hosts.
By default, the plugin concatenates the name of the Podman host with the name of the container, separated by an underscore.
Alternatively, you can instruct the agent plugin to combine the container name with the container ID, or to use only the container name.
To do this, you must set the piggyback_name_method option in the agent plugin’s configuration file to either name or name_id.
However, if you choose one of these two methods, you must ensure elsewhere that no name collisions occur in Checkmk.
In Checkmk, each host name can only exist exactly once.
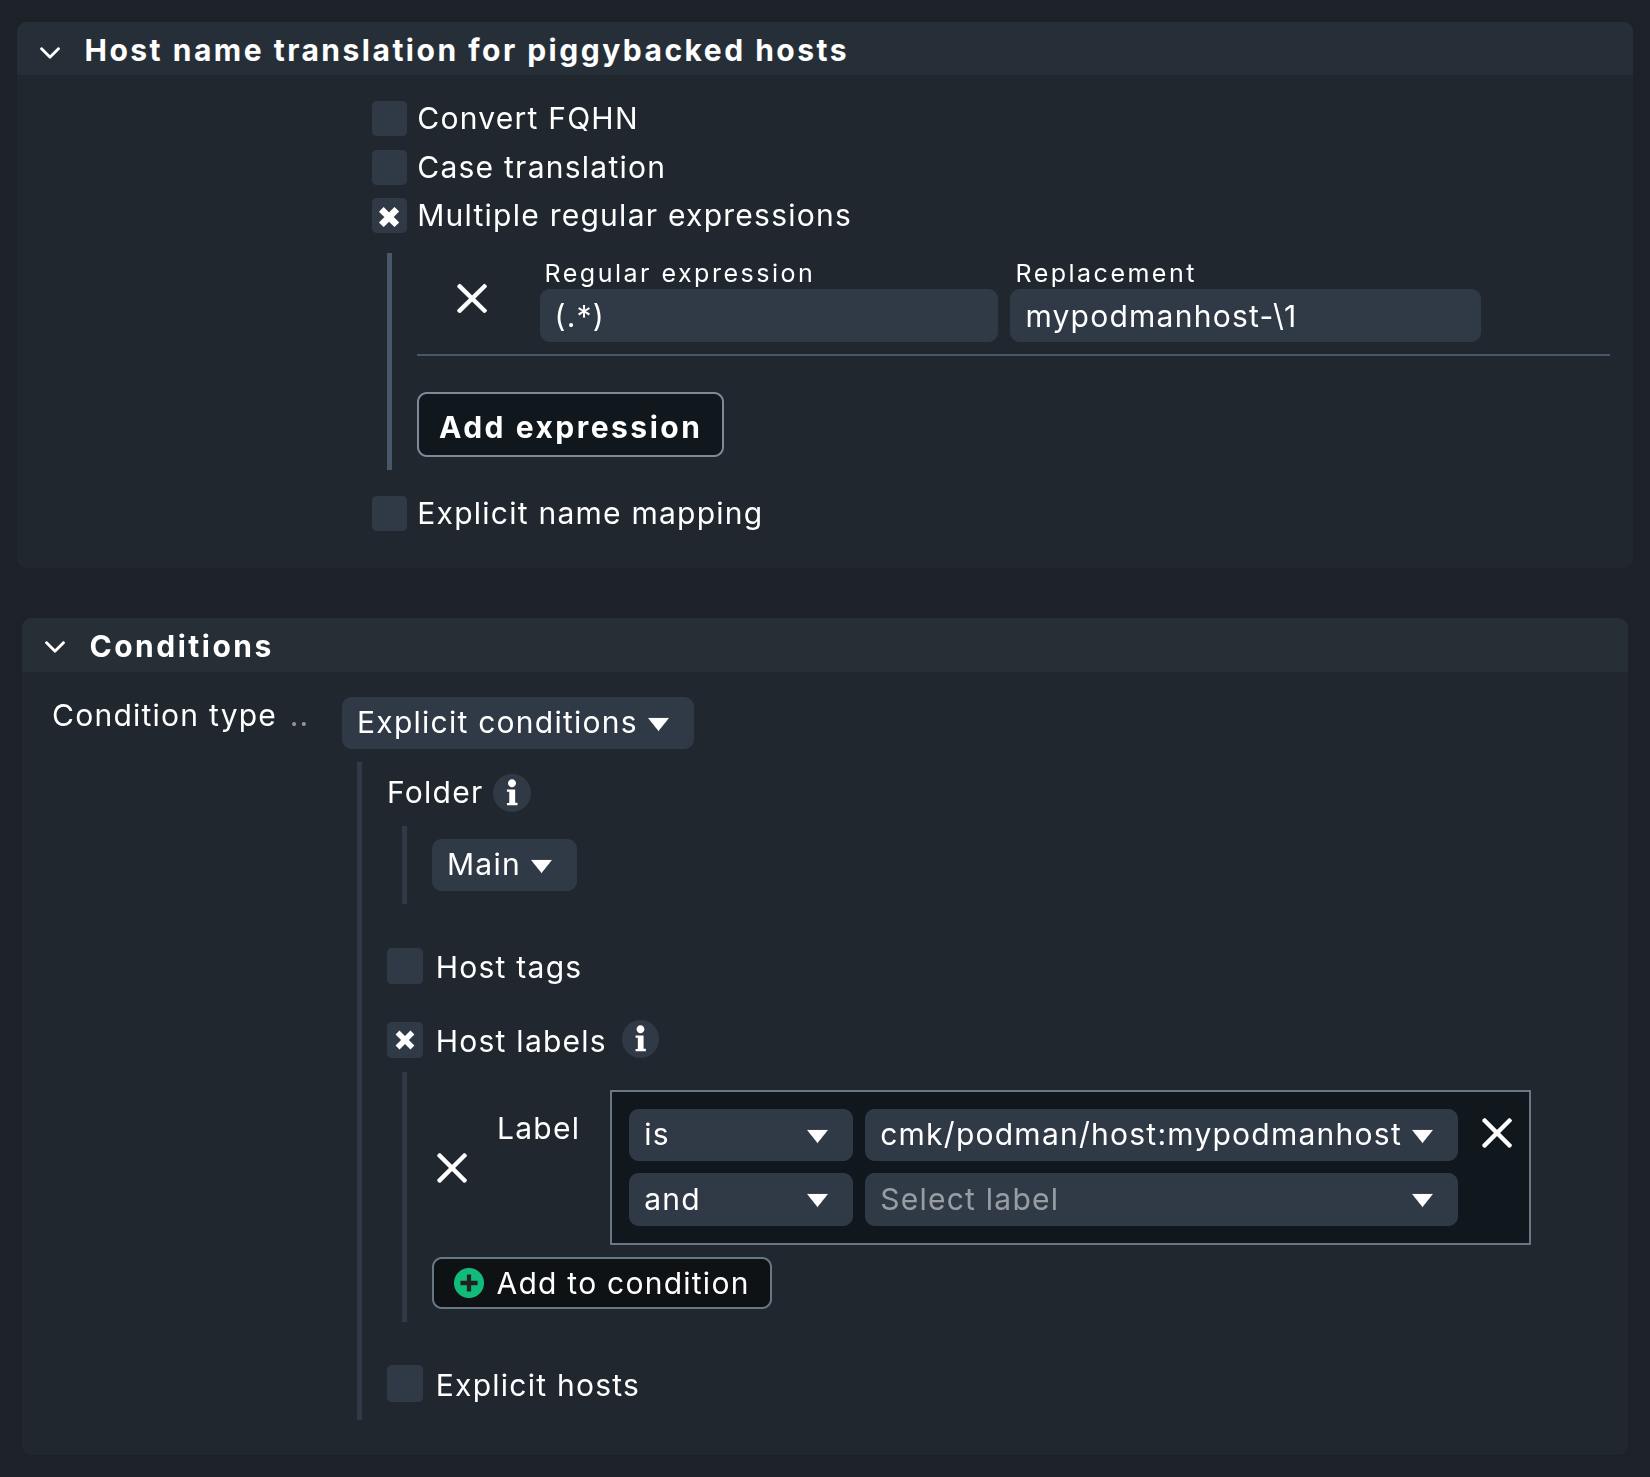
If you later want to change these names—for example, to extract specific information directly from the host name—you can use the rule set Host name translation for piggybacked hosts.
This allows you to define rules quite flexibly for renaming host names contained in piggyback data.
In the following example, the string mypodmanhost- is prepended to all containers that are piggybacked via the host mypodmanhost.
For more options and a more detailed description, see the article the piggyback mechanism.
4.3. Monitor the status of container hosts
By default, every Checkmk site already contains a rule in the Host check command rule set that ensures each container host receives the status of the respective service Status. This rule should remain unchanged or be configured exactly as shown:
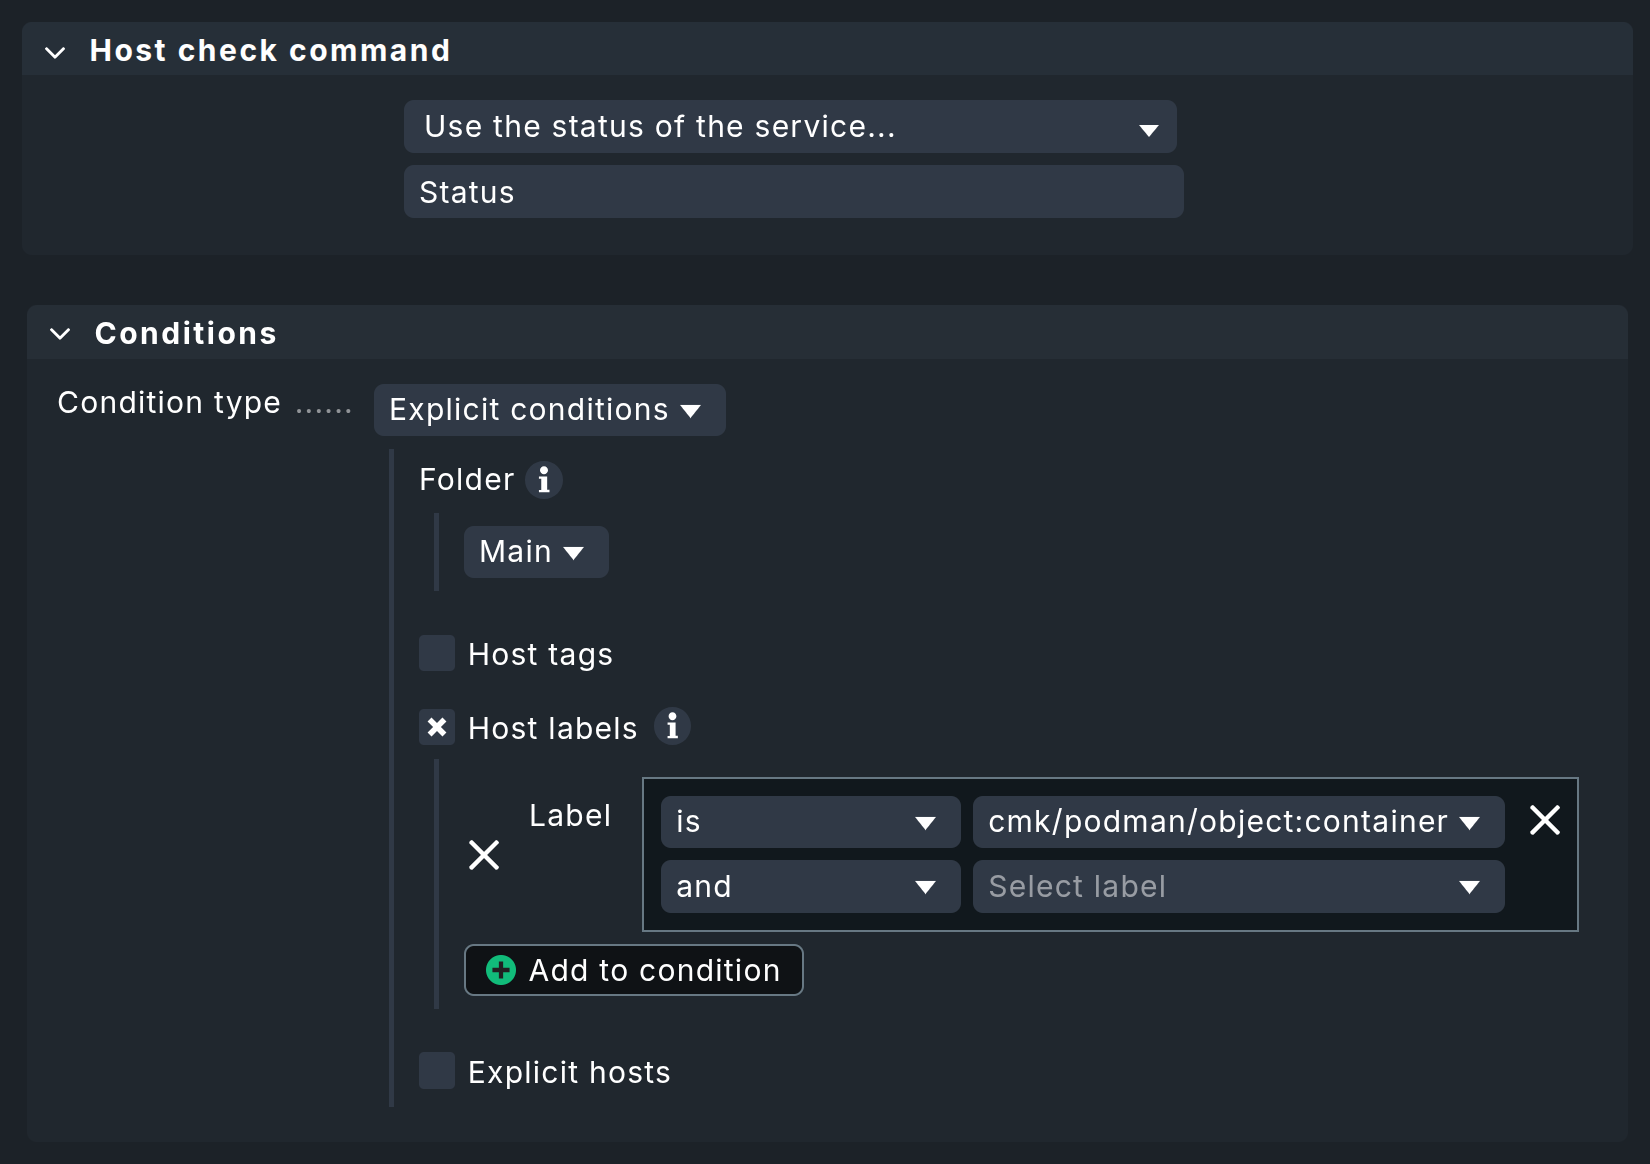
The service Status checks whether the container is running and can therefore be used as a reliable means of determining the host status.
Since every container host is automatically assigned the host label cmk/podman/object:container, this is used as a condition here.
5. Diagnostic options
5.1. Diagnosis for a Podman host
If the setup does not work, there are several ways to troubleshoot the issue.
First, check the output of the Checkmk agent. You can access this in the host view in Monitoring via the Download agent output entry in the action menu.

Or you can search the agent cache directly.
If the agent’s output does not contain any sections that begin with <<<podman, you’ll need to continue troubleshooting on the Podman host.
To do this, manually run the agent plugin on the Podman host:
The output of mk_podman.py will also provide information about what went wrong in the event of an error.
For example, if the agent plugin cannot find Podman on the host, it will state this fact plainly:
5.2. Diagnosis for a container host
If only a container host is not receiving data or no services are detected for it, first check whether the piggyback data for that host is available. To do this, review the agent output again to see if there are sections for the container host. You can search the agent output, for example, by the container’s ID.
As an instance user, you can check whether Piggyback data has been created for a container.
In the tmp/check_mk/piggyback directory, you should find directories that belong to your containers.
If you do not change the host names via Host name translation for piggybacked hosts, you should find directories here that consist of the container’s name and its ID.
6. Host labels
Checkmk also generates host Labels for all Podman objects that can be monitored. Podman monitoring sets the following automatic labels, among others:
the label
cmk/podman/object:nodefor the Podman host,the labels
cmk/podman/object:containerandcmk/podman/userfor each container,for all containers that are part of a pod, additional labels are also generated to identify the pod.
You can use these labels, for example, in conditions for your rules to make your monitoring configuration dependent on the image used in a container.
7. Files and directories
| File path | Function |
|---|---|
|
This is where Checkmk stores the piggyback data. A subfolder named after each piggyback host is created. Inside, there is a text file containing the host’s data. The filename is the name of the piggyback host that provided the data. |
|
This is where the most recent agent output for each host is temporarily stored. The contents of a file for a host are identical to the output of the command |
|
Default plugin directory on a Linux host |
|
default configuration directory on a Linux host |