1. Introduction
Services are the actual ‘substance’ of a monitoring system. Each one represents an important cog in your complex IT landscape. The usefulness of the complete monitoring stands or falls depending on how accurately and usefully the services have been configured. Finally, the monitoring should reliably notify whenever a problem becomes apparent somewhere, but should definitely also minimize false or useless notifications.
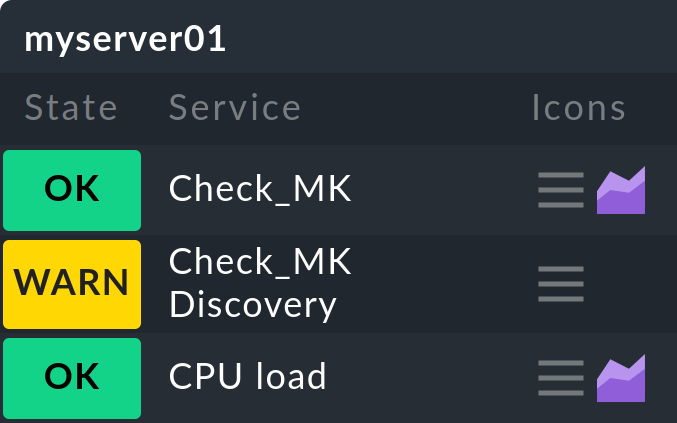
Checkmk demonstrates possibly its greatest strength when configuring services: it possesses an unrivaled and very powerful system for an automatic detection and configuration of services. With Checkmk there is no need to define every single service via templates and individual allocations. Checkmk can automatically and reliably detect the list of services to be monitored, and first and foremost, keep it up to date. This not only saves a lot of time — it also makes the monitoring accurate. It ensures that the daily changes in a processing center are always promptly covered and that no important service goes unmonitored.
The service discovery in Checkmk is based on an important basic principle: the separation of what from how:
What should be monitored? → The system
/varon the hostmyserver01How should it be monitored? → at 90 % used space WARN, at 95 % CRIT
What is automatically detected by the service discovery. It is
a combination of the host name (myserver01), the check
plug-in (df: data system check in Linux) and the item
(/var). Check plug-ins that can create a maximum of one service on a
host do not require an item (e.g., the check plug-in for CPU utilization). The
results from a service discovery are presented in a table as shown below:
| Host | Check plug-in | Item |
|---|---|---|
|
|
|
|
|
|
|
|
|
… |
… |
… |
|
|
|
… |
… |
… |
The how — thus the thresholds/check parameters for the individual
services — is configured independently via rules. You can
e.g., define a rule that monitors all data systems with the mount point /var,
and the 90 % / 95 % thresholds, without needing to think about on
which hosts such a data system even exists. This is what makes configuring
with Checkmk so clear and simple!
A few services can’t be installed using an automatic discovery. Among these are e.g., checks queried per HTTP-specified websites. These are created via rules, as you can learn about in the article about active checks.
2. Host services in the Setup
2.1. Incorporating a new host
Once you have added a new host in the setup the next step is to call up the list of services. With this action the automatic service discovery takes place for the first time for this host. You can also call up this list at any time later in order to restart the discovery or to carry out modifications to the configuration. There are various ways of opening the service list:
via the button
 Save & run service discovery in the Properties of host in the setup
in the menu bar of the Properties of host via Host > Run service discovery
via the
 symbol in the list of hosts in a folder in the setup
via the
 Edit services entry in the context menu of the service Check_MK Discovery of a host
When a host has been newly-incorporated its services have not yet been configured, and therefore all discovered services appear in the Undecided services - currently not monitored category:
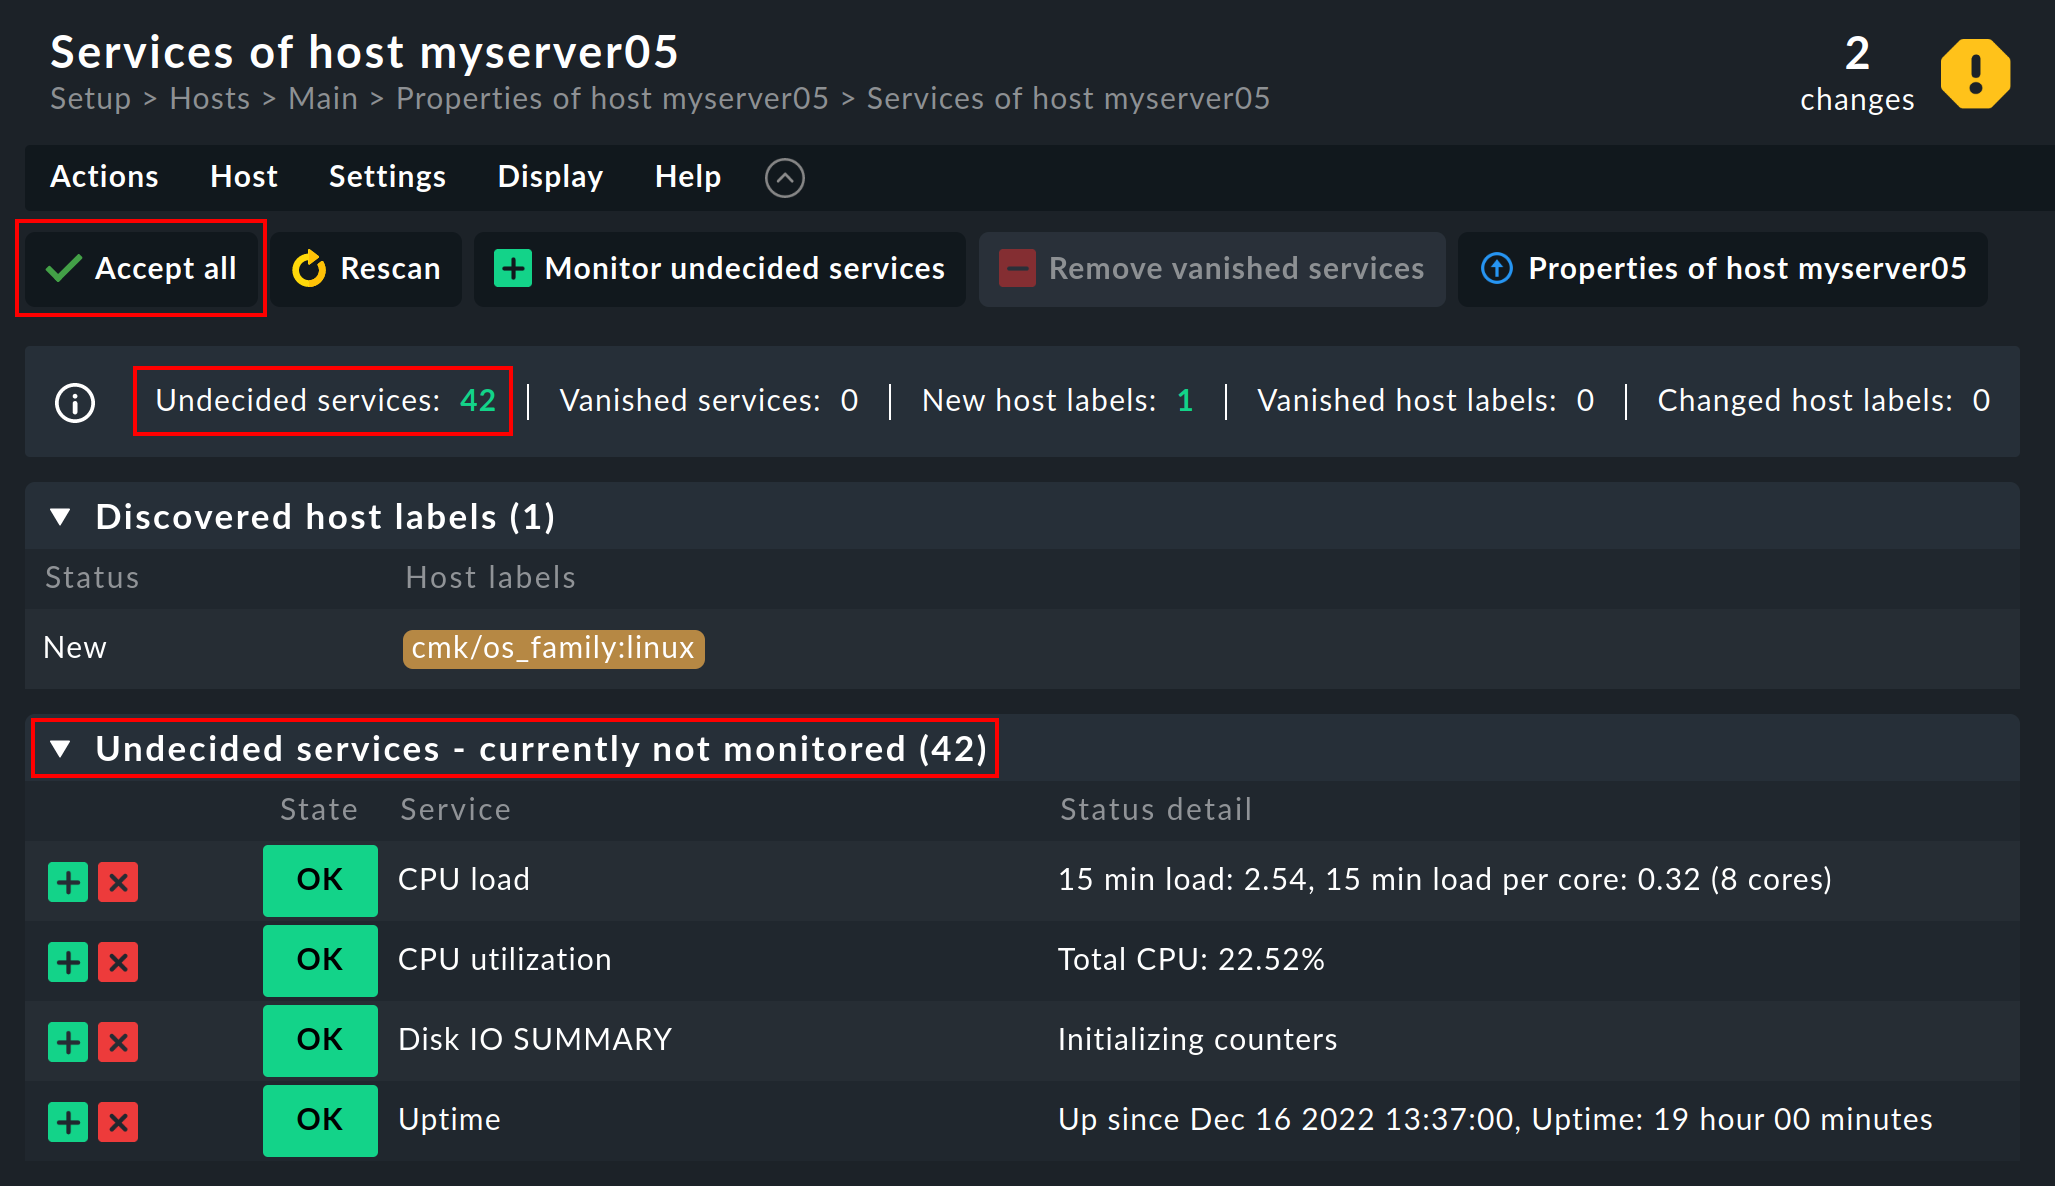
The usual method for adding the newly discovered services is to simply hit the ![]() Accept all button.
That way also all host labels will be added in one go.
Afterwards quickly Activate changes — after which the host will be in the monitoring.
Accept all button.
That way also all host labels will be added in one go.
Afterwards quickly Activate changes — after which the host will be in the monitoring.
2.2. Adding missing services
For a host that is already being monitored this list looks different. Instead of Undecided services - currently not monitored you will see Monitored services. If Checkmk detects something on a host that is not being monitored, that however should be monitored, then the list will look something like this:
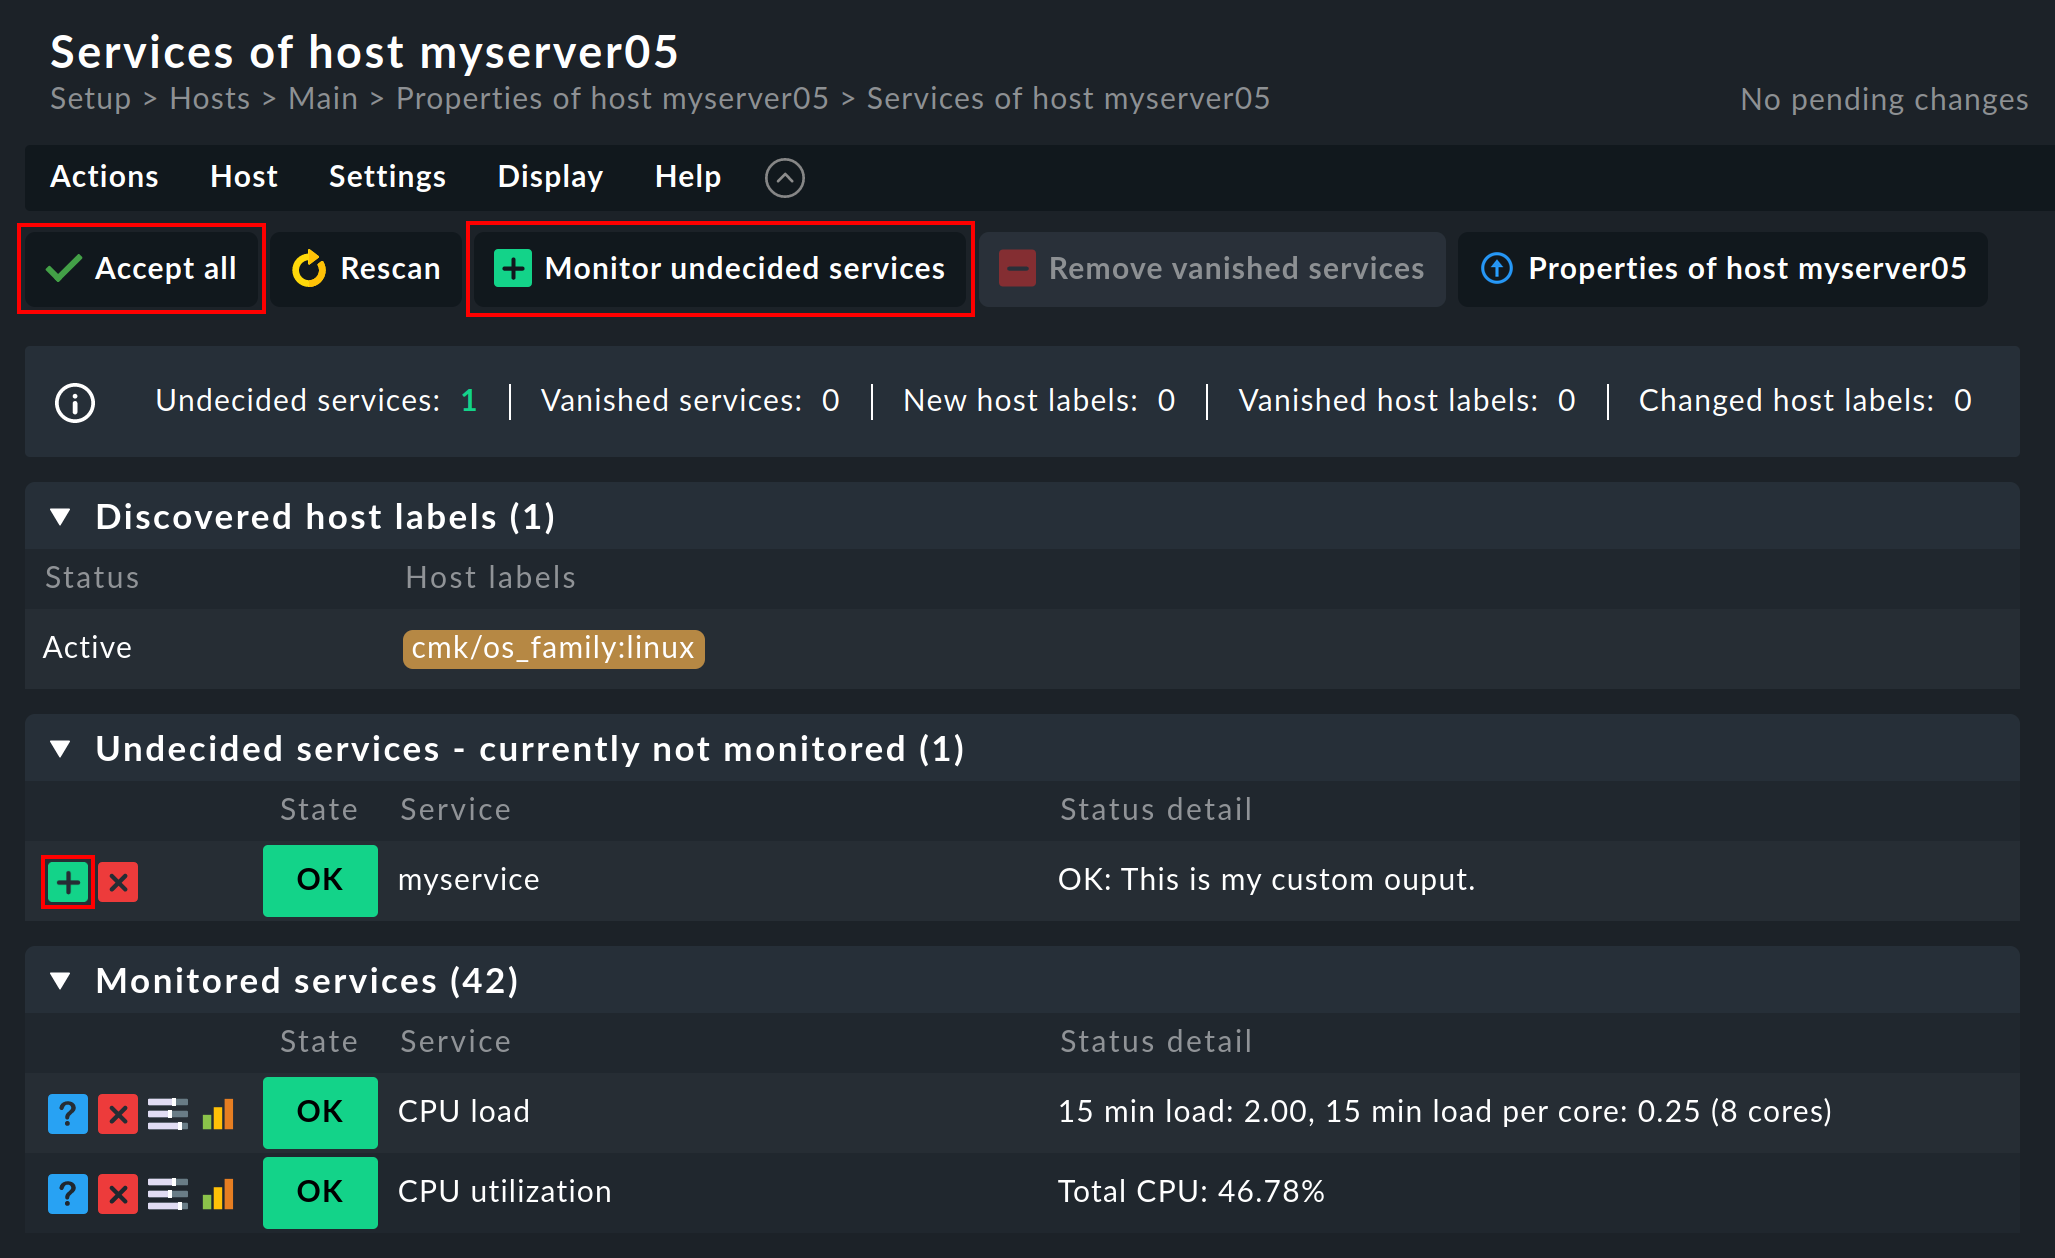
A click on ![]() Monitor undecided services or on
Monitor undecided services or on ![]() Accept all simply adds all of the missing services so that the monitoring is again complete.
If you only want to add some of the missing services, you can alternatively click the button
Accept all simply adds all of the missing services so that the monitoring is again complete.
If you only want to add some of the missing services, you can alternatively click the button ![]() in order to Move to monitored services.
in order to Move to monitored services.
2.3. Vanished services
In processing centers things can not only newly appear, but also disappear. A data base instance can be discontinued, a LUN unmounted, a file system removed, etc. Checkmk automatically recognizes such services as vanished. In the service list e.g., it will look like this:

The simplest way to be free of these services is again with a click on ![]() Accept all or by clicking the button
Accept all or by clicking the button ![]() in each individual line,
which stands for Remove vanished services.
Attention: The reason for the disappearance can of course be due to a problem!
The disappearance of a file system can also mean that due to an error it could not be mounted.
The monitoring is after all there for such cases!
You should only remove the service when you really know that this no longer needs monitoring.
in each individual line,
which stands for Remove vanished services.
Attention: The reason for the disappearance can of course be due to a problem!
The disappearance of a file system can also mean that due to an error it could not be mounted.
The monitoring is after all there for such cases!
You should only remove the service when you really know that this no longer needs monitoring.
2.4. Removing unwanted services
You won’t necessarily want to monitor everything that Checkmk finds. The discovery works in a target-oriented way of course, and it can exclude much unnecessary data in advance. Nonetheless, how can Checkmk know, for example, that a particular data base instance has been set up only ‘to play around with’, and is not in production? There are two ways of eliminating such services:
Temporarily disabling services
In order to remove certain services from the monitoring temporarily, you can
simply click the icon ![]() . That way the service
will be moved to the list of Undecided services. Or you could even
click the icon
. That way the service
will be moved to the list of Undecided services. Or you could even
click the icon ![]() at the beginning of the line, in
order to disable the service. And naturally, don’t forget the usual
Activate changes.
at the beginning of the line, in
order to disable the service. And naturally, don’t forget the usual
Activate changes.
This is however only intended for temporary and smaller actions, as the services deselected in this way will be highlighted as missing by Checkmk, and the Discovery Check (which we will show you later below) will likewise be unhappy. In any case, that would simply be too much work and not really practical in an environment with x-thousand services …
Permanently disabling services
It is far more elegant and enduring to permanently ignore services with the aid of the Disabled services rule set. Here you can not only exclude individual services from monitoring, but also formulate rules like “I don’t want to monitor services beginning with myservice on the host myserver01."
You can access the rule via Setup > Services > Discovery rules > Discovery and Checkmk settings > Disabled Services.
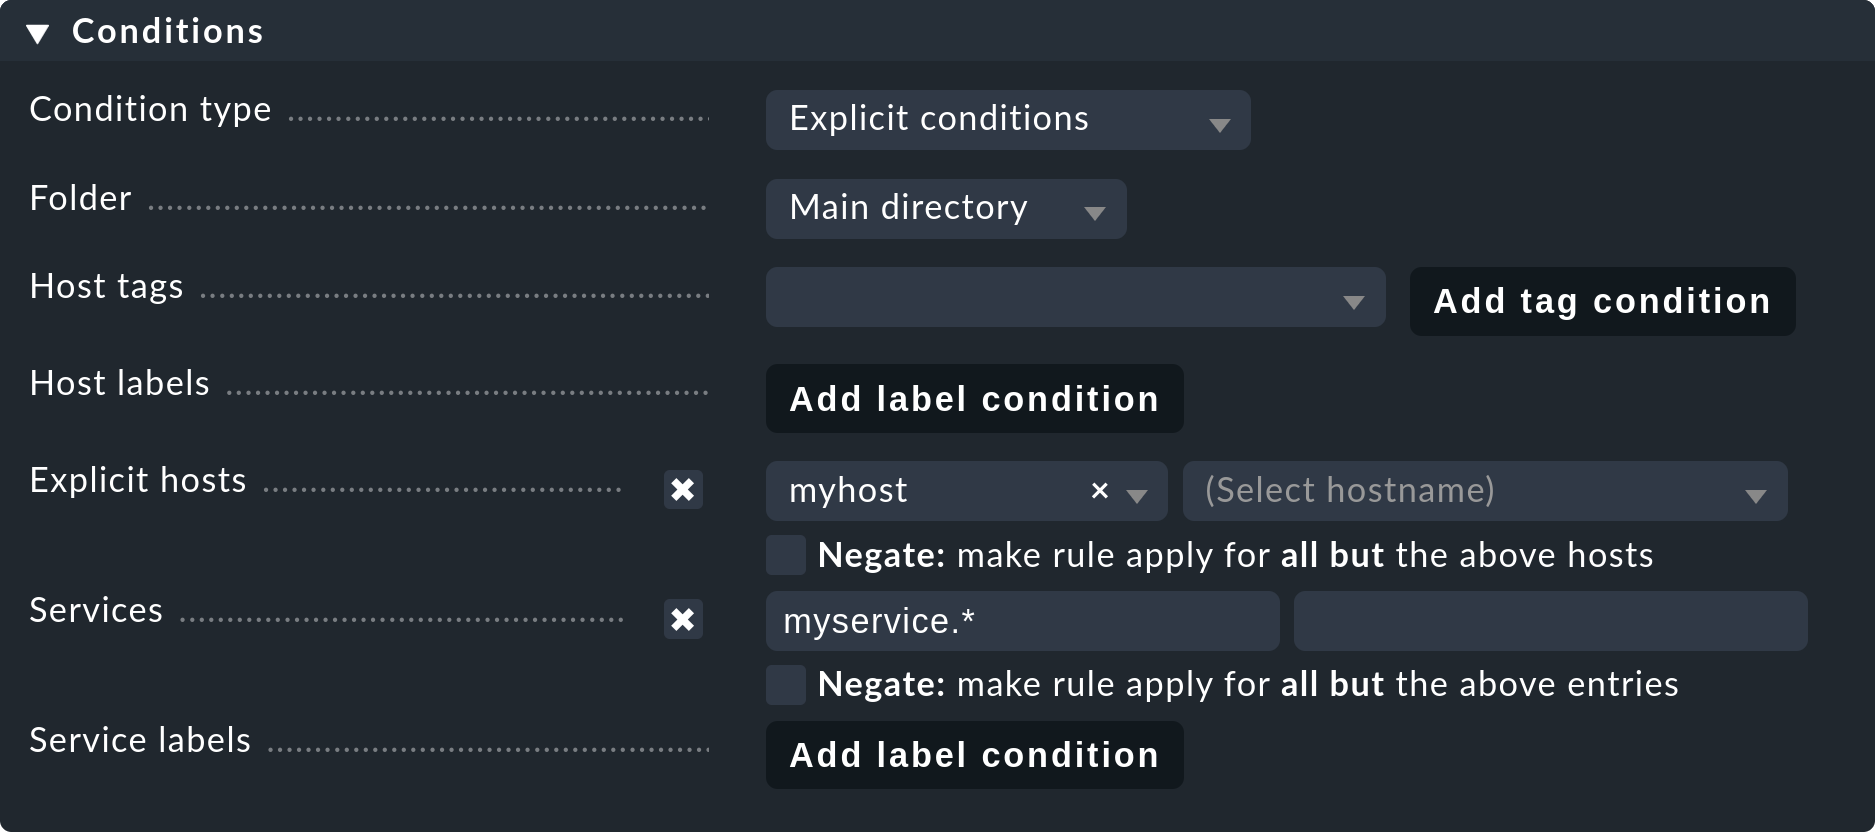
Once you have saved the rules, and return to the host’s service list, you will see the disabled services in the Disabled Services section, together with any service that might have been disabled manually.

2.5. Refreshing services
There are a number of plug-ins that notice things during a discovery. For example, the plug-in for network interfaces checks the speed set on the interface during the discovery. Why? In order to be able to warn you in case it changes! It is rarely a good sign when an interface is sometimes set to 10 MBit, and sometimes to 1 GBit — this could rather be an indication of a defective auto-negotiation.
What happens when this change is desired and is to be accepted as OK from
now on?
Either — remove the service via icon ![]() , which
stands for Move to undecided services and re-add it immediately
afterwards.
Or refresh all services of the host by clicking Actions > Remove all
and find new in the menu bar. This is naturally much easier, but only when you
don’t want to keep individual services in an error state.
, which
stands for Move to undecided services and re-add it immediately
afterwards.
Or refresh all services of the host by clicking Actions > Remove all
and find new in the menu bar. This is naturally much easier, but only when you
don’t want to keep individual services in an error state.
2.6. Update host labels
Updating only the labels of a host can be easily achieved via Actions > Host labels > Update host labels in the menu bar.
2.7. Special conditions with SNMP
There are a few special features for devices that are monitored via SNMP. You can learn about these in the Article about SNMP.
3. Bulk Discovery — simultaneous discovery on multiple hosts
If you want to perform a discovery for multiple hosts with a single action, you can make the work easier with Checkmk’s bulk actions. Firstly, choose the hosts on which the discovery is to be performed. You have several options for this:
In a folder, select the check boxes for individual hosts and then via Hosts > On selected hosts > Discover services in the menu bar.
Search for hosts with host search, select all hosts in the search result by clicking the
 and then again
via Hosts > On selected hosts > Discover services in the menu bar.
and then again
via Hosts > On selected hosts > Discover services in the menu bar.In a folder, click Hosts > In this folder > Discover services in the menu bar.
With the third variant you can also perform the service discovery recursively in all subfolders. In all of the above three options the next step will take you to the following dialog:

In Mode you will find exactly the same options as in the setup’s service list that we have previously discussed:

Under Selection you can again control the host selection. This is primarily sensible if you have selected these via the folder rather than via the check boxes. Most of the options are intended to accelerate the discovery:
Include all subfolders |
If you have started the bulk discovery for all hosts in a folder, this option will be active by default. The discovery will be run on all hosts of all subfolder, as well. |
Only include hosts that failed on previous discovery |
Hosts for which an earlier service discovery via bulk operations has failed (e.g. because the host was not accessible at the time), are flagged with the |
Only include hosts with a failed discovery check |
This restricts the discovery to such hosts for which the Discovery Check failed. When you work with Discovery Check this is a good method for greatly accelerating a discovery on many hosts. The combination with the Refresh all services (tabula rasa) option makes less sense in this case however as it can distort the status of existing services. |
Exclude hosts where the agent is unreachable |
Hosts that are not accessible cause long delays during discovery due to connection timeouts. This can greatly impede a discovery’s performance on larger numbers of hosts. If the hosts are already in monitoring — and it knows that the hosts are DOWN — you can bypass them here and thus avoid the timeouts. |
The Performance Options are predefined so that a full service scan will be performed. If you are not interested in new plug-ins a discovery can be greatly accelerated by not choosing this option.
The 10 set in Number of hosts to handle at once means that
ten hosts are always processed in one action. This is achieved internally
with an HTTP request. If you encounter timeout problems due to some hosts
requiring a long time to discover, you can try setting this number lower
(to the detriment of the total time required).
As soon as you confirm the dialog the procedure will start and you can observe its progress:
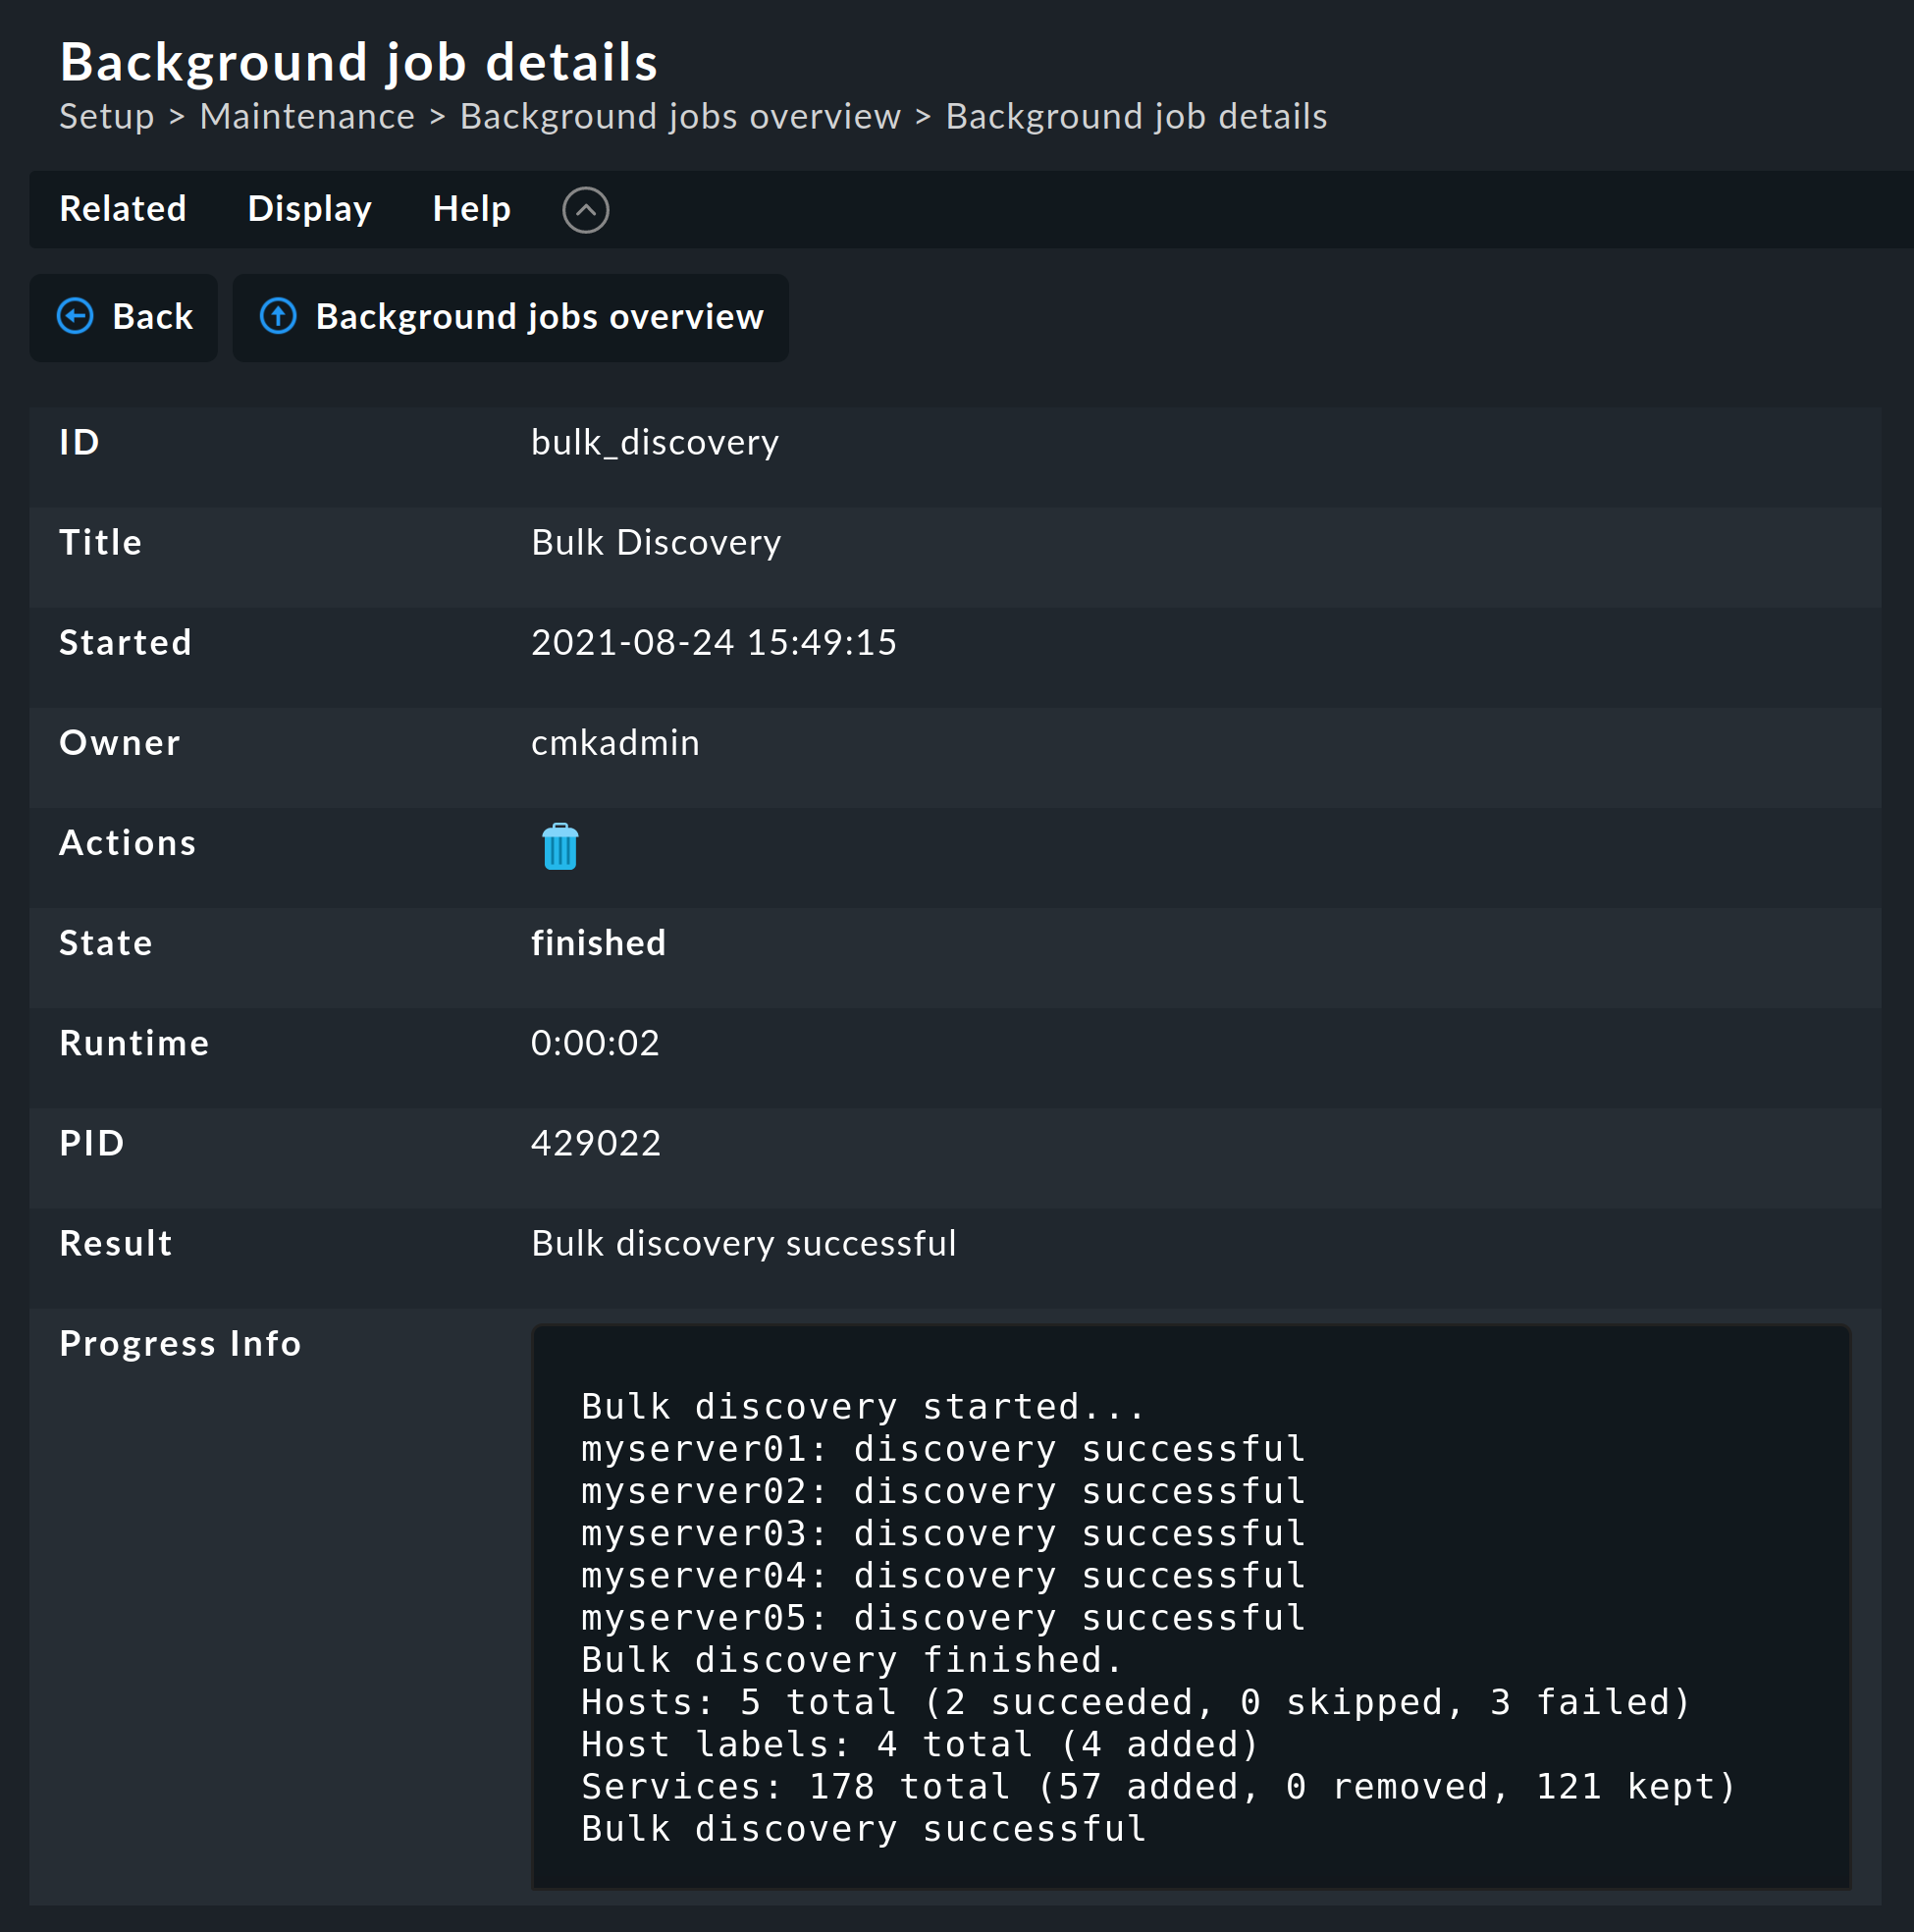
4. Check parameters in services
Many of the check plug-ins can be configured using parameters. The most common practice is the setting of thresholds for WARN and CRIT. Parameters can be structured in a much more complex way, as shown in this example of temperature-monitoring with Checkmk:
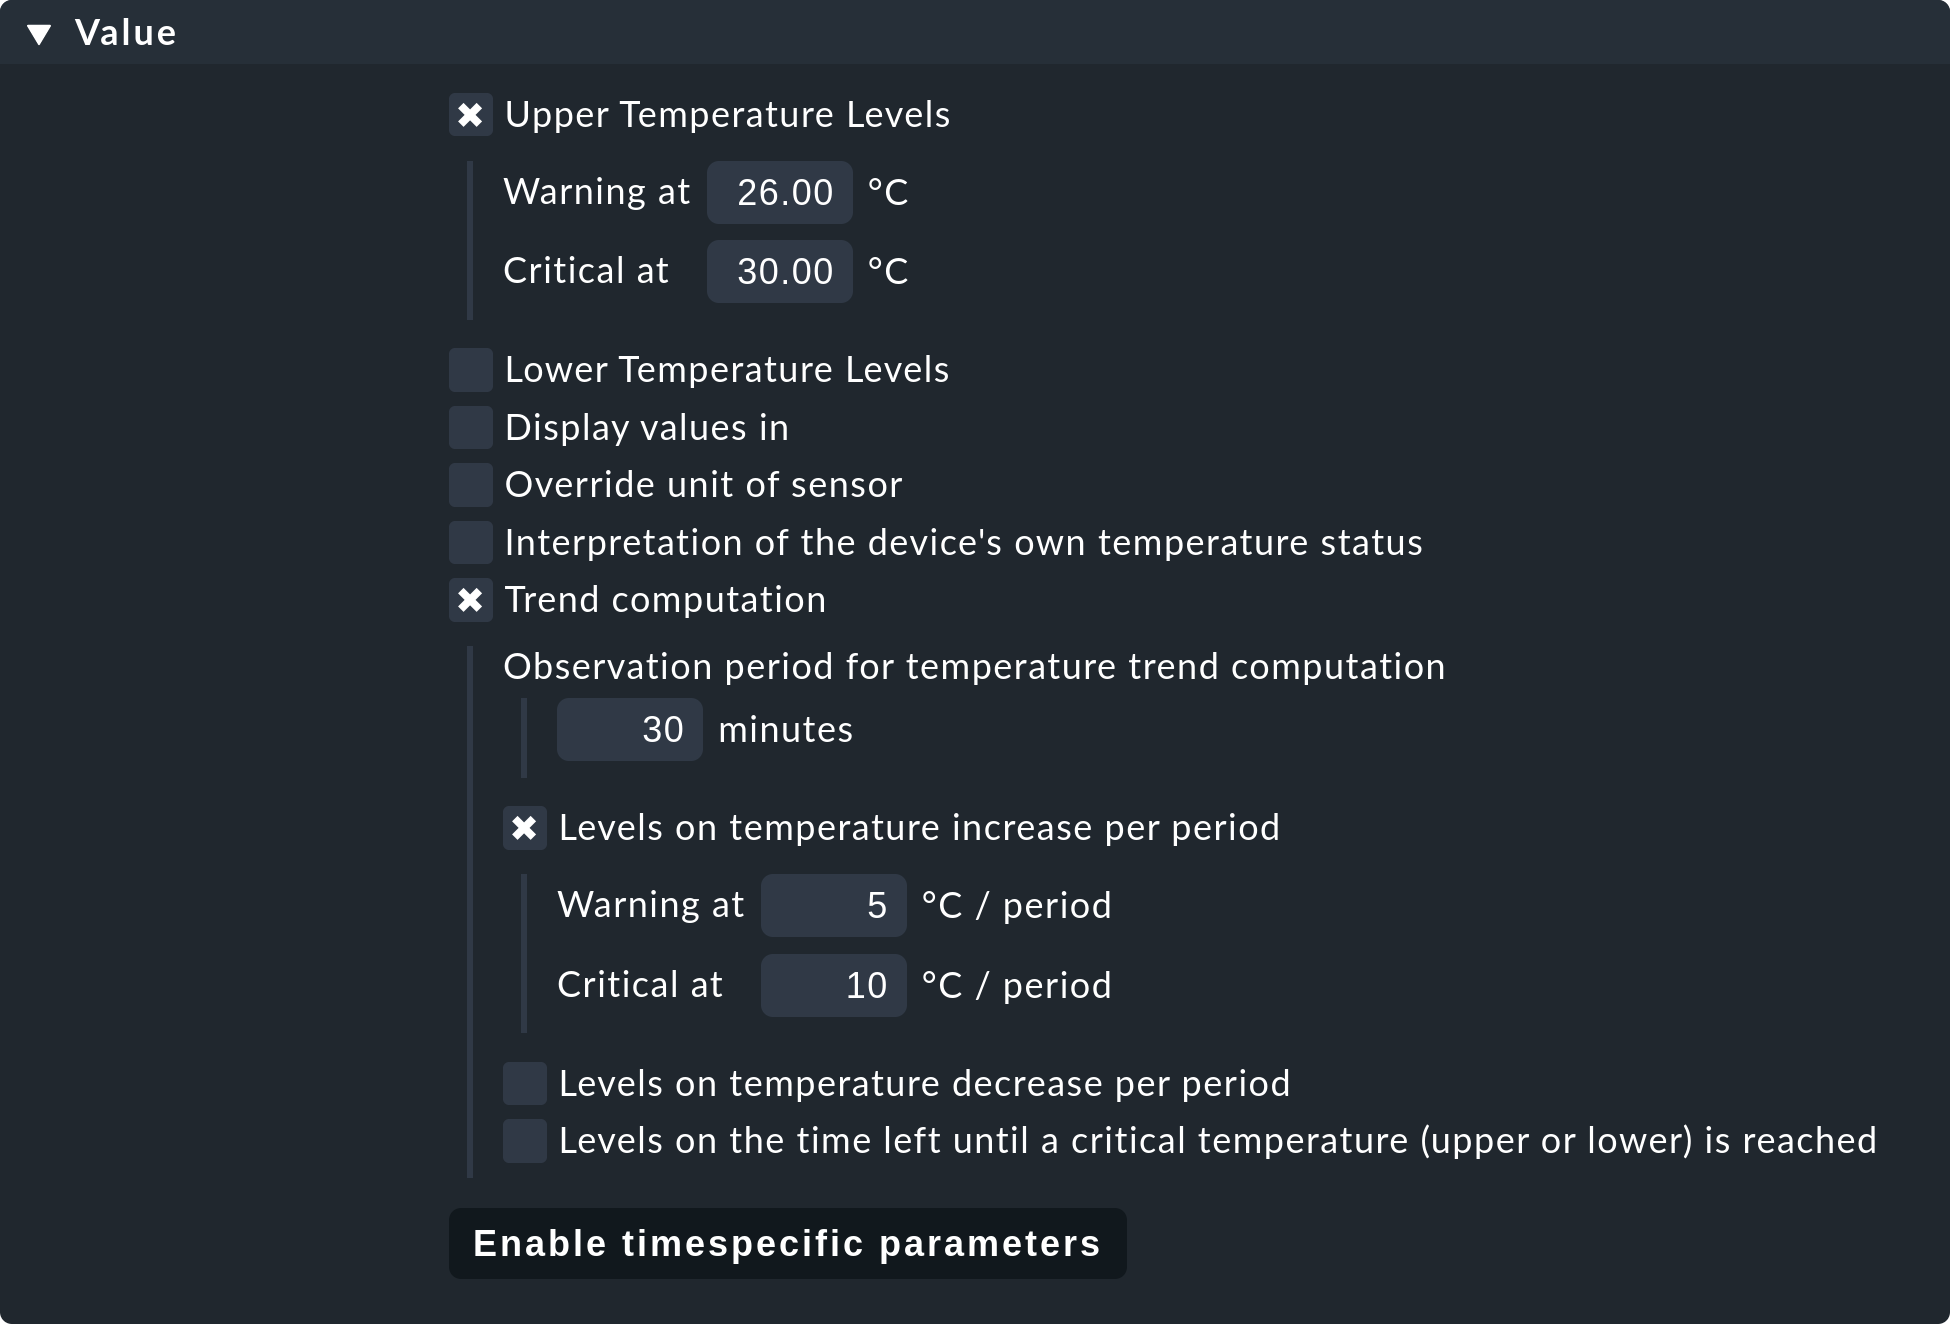
The check parameter for a service is composed of three parts:
Every plug-in has a Default value for the Parameter.
Some plug-ins set values during a discovery (see above).
Parameters can be set via rules.
Parameters from rules have priority over those set by a discovery, and these in turn have priority over default values. For complex parameters in which individual sub-parameters are set using check boxes (as with temperature for example), these priority-rules apply separately for each sub-parameter. So, if you set only one sub-parameter via rules, the others retain their respective default values. In this way you can, for example, activate the trend calculation of the temperatures with one rule, and with another rule set the temperature threshold value for a physical sensor device. The complete parameter set will then be composed from both rules.
The exact parameters a service eventually has can be found in the service’s
parameters page. This can be accessed via the ![]() symbol in the host’s service list. If you wish to see the parameters
from all services directly in the service table, you can show it by clicking
Display > Details > Show check parameters in the menu bar. It will
look something like this:
symbol in the host’s service list. If you wish to see the parameters
from all services directly in the service table, you can show it by clicking
Display > Details > Show check parameters in the menu bar. It will
look something like this:

5. Customizing the service discovery
We have earlier shown how you can configure the service discovery to suppress the displaying of undesired services. In addition there are further rule sets for a number of plug-ins that influence the behavior of the discovery with these plug-ins. Not only are there settings for omitting items, there are also those that actively find items, or collect them into groups. The naming of items is sometimes also an issue — e.g. for those switchports where you can decide on a description or alias to be used as an item (which will be used in the service name) instead of its interface ID.
All rule sets that are relevant for service discovery can be found under
![]() Setup > Services > Discovery rules.
Please don’t confuse these rule sets with those intended for parameterizing
the actual services. A number of plug-ins have two rule sets in fact — one
for the discovery, and one for the parameters. Here are a few examples.
Setup > Services > Discovery rules.
Please don’t confuse these rule sets with those intended for parameterizing
the actual services. A number of plug-ins have two rule sets in fact — one
for the discovery, and one for the parameters. Here are a few examples.
5.1. Monitoring of processes
It would make little sense for Checkmk to simply define a service to monitor every process found on a host. Most processes are either of no interest or are only temporarily present. At the very least there are hundreds of processes running on a typical Linux server.
For monitoring services you therefore need to work with enforced services or — and this is much more elegant — by using the rule set Process discovery to tell the service discovery which processes it should be on the lookout for. In this manner you can always allow a monitoring to be instituted automatically when a definitely interesting process is found on a host.
The following image shows a rule in the Process discovery rule set which
searches for processes that execute the program /usr/sbin/apache2.
In this example a service (Grab user from found processes) will be
created for every different operating system user for whom such a process
is found. The service will be named Apache %u, where %u
will be replaced by the user name. For the threshold the number of process
instances will be set to 1/1 (minimum) and 30/60 (maximum) respectively:
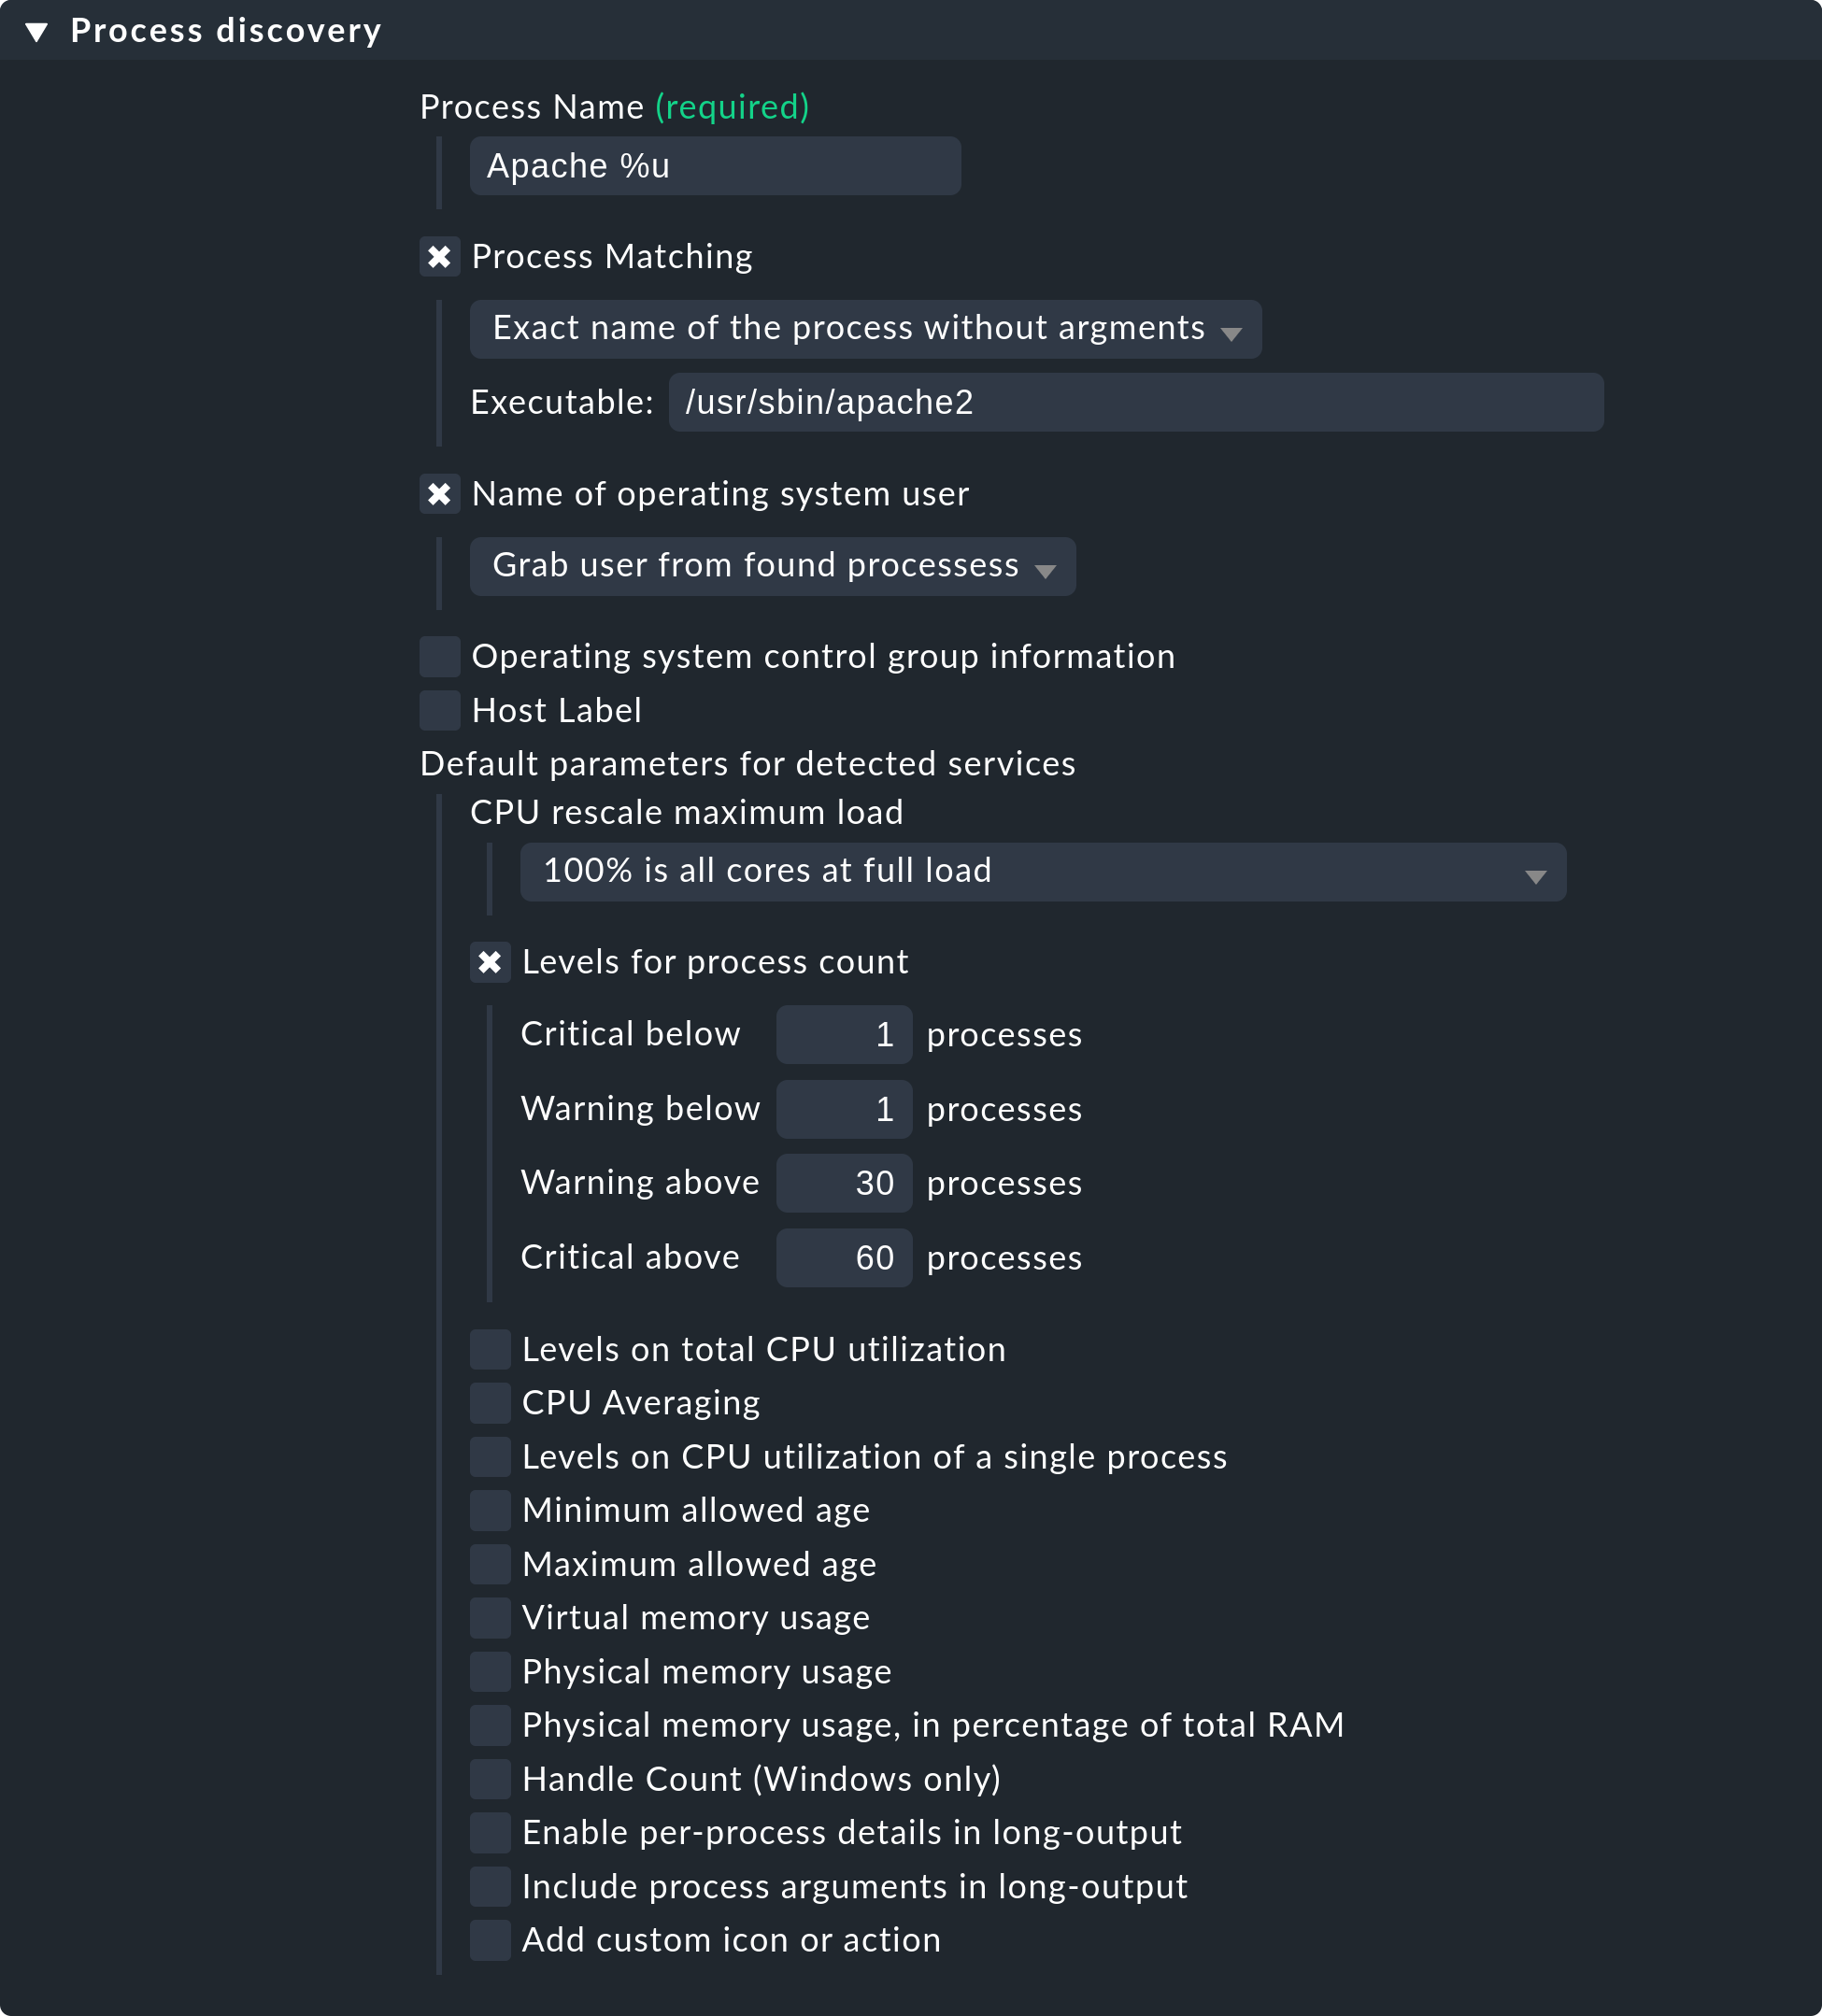
Please note that the predefined thresholds are referred to as Default parameters for detected services. You can assign these — and likewise all other services — via rules. As a reminder: the above rules configure the service discovery — the what. If the services are present for the first time, the rule chain State and count of processes is responsible for the thresholds.
The fact that you can set thresholds during a discovery is an aid to convenience. There is a catch though: changes to the discovery rule only take effect with the next discovery. If you change thresholds you will need to run a new discovery. If, however, you only use the rule to discover the services (the what), and the rule set State and count of processes for the how, then you will not have this problem.
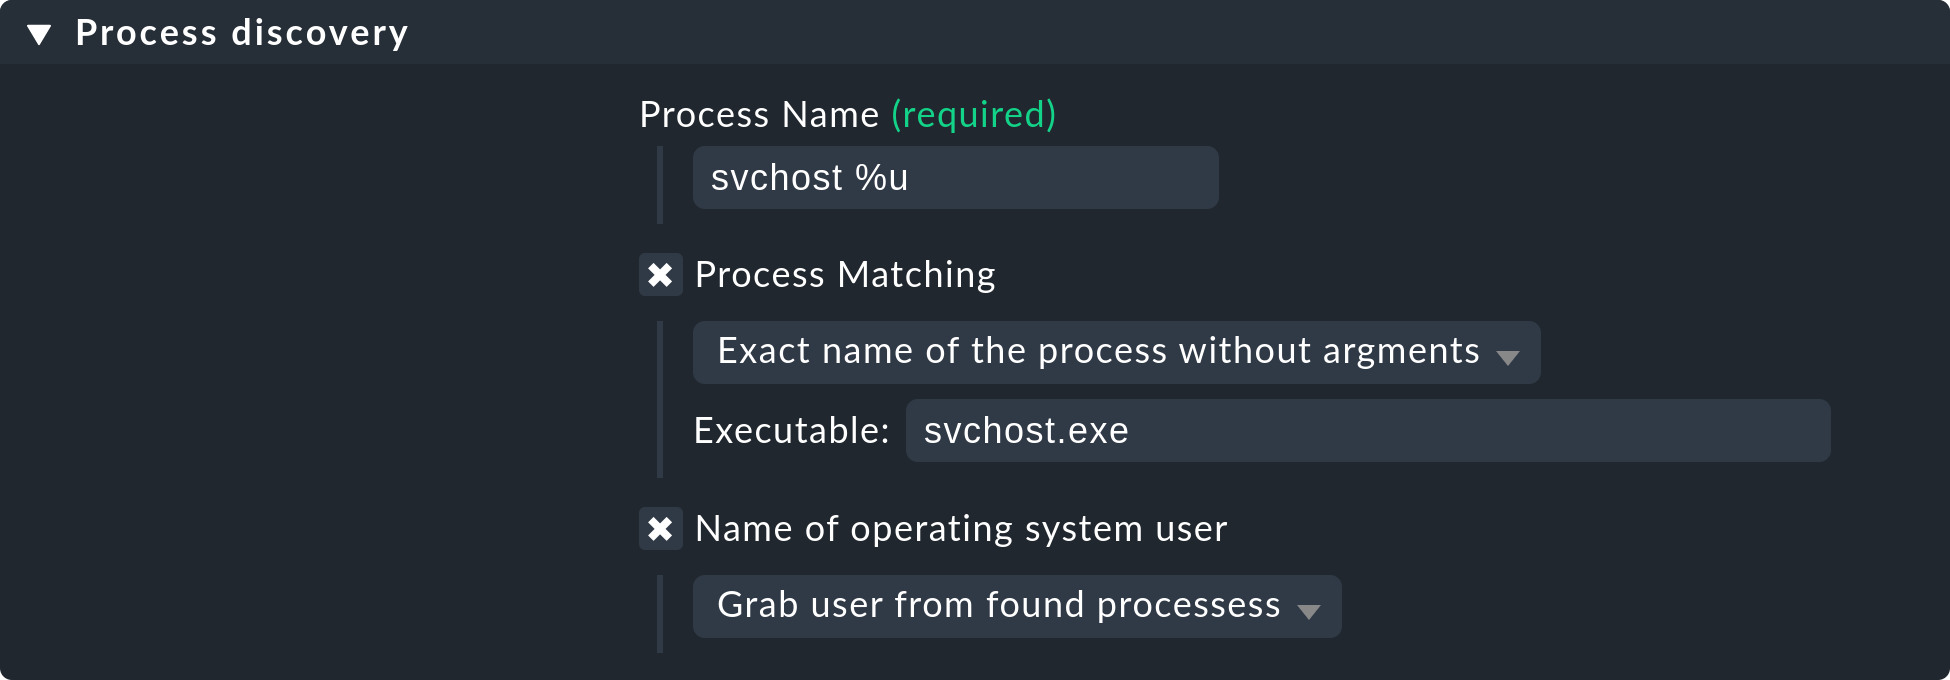
In order to monitor certain or single processes on a Windows host, you just have
to state the filename (incl. the extension) without any path in the field
Executable. You can find all these names in the details tab of the Windows
Task Manager for example. In the rule Process discovery this could look like
this for the process svchost:
Further information on process discovery can be found in the inline help for this rule set. As always you can activate this via Help > Show inline help in the menu bar.
5.2. Monitoring services under Windows
The discovery and parameterizing of the monitoring of Windows services is analogous to the processes and is controlled via the rule sets Windows service discovery (what) and Windows services (how) respectively. Here is an example of a rule that watches out for two services:

Exactly as for the processes, here the service discovery is also only one option. If, on the basis of host characteristics and folders, you can formulate precise rules for hosts on which specific services are to be expected, then you can also work with manual services. This is independent of the situation actually found — it can however require considerably more effort, as under these circumstances you need many rules in order to exactly describe which service is to be expected on which host.
5.3. Monitoring of switch ports
Checkmk uses the same logic for monitoring network interfaces on servers and ports on Ethernet switches. With switch ports the existing options for controlling the service discovery are especially interesting, even though (in contrast to the processes and Windows services) the discovery initially functions without rules. That is to say, by default Checkmk automatically monitors all physical ports that currently have an UP state. The applicable rule set is called Network interface and switch port discovery and offers numerous setting options that are only briefly described here:
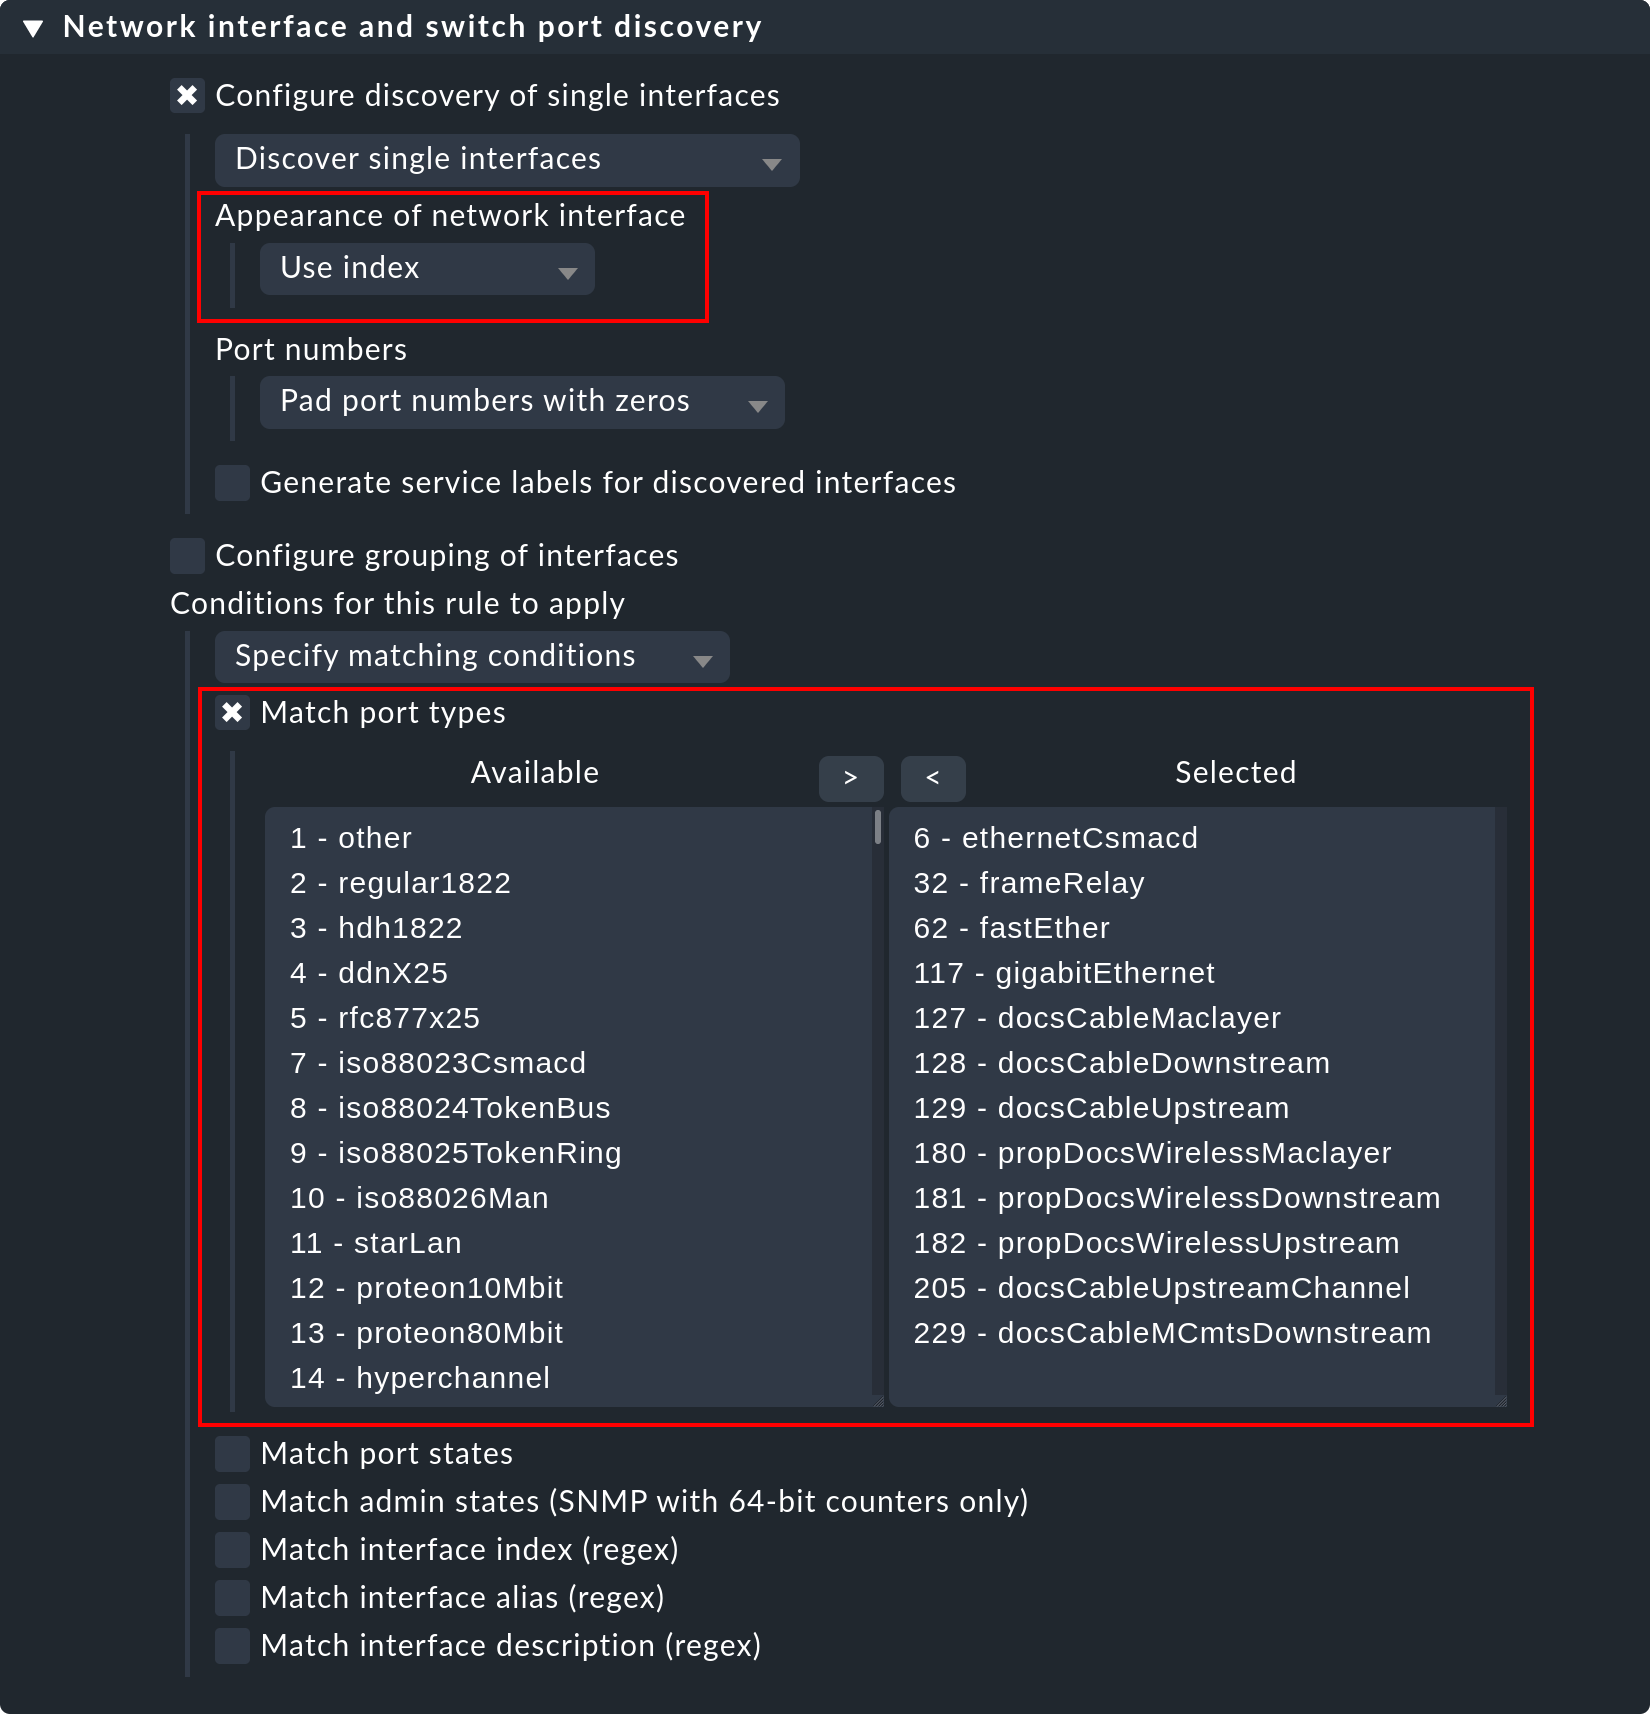
The following options are the most important ones:
In the section Appearance of network interface you can determine, how the interface should look in the name of the service. You can choose between Use description, Use alias and Use index.
The restriction or expansion of the types or names of interfaces being monitored.
6. Setting-up enforced services
There are some situations in which an automatic service discovery would make no sense. This is always the case if you want to force compliance with a specific guideline. As we saw in the previous chapter, you can allow the monitoring of Windows services to set itself up automatically when these are found. What happens when the absence of such a service presents a problem? For example:
A particular virus scanner should be installed on every Windows host.
NTP should be configured on every Linux host.
In such cases you can simply enforce those services. You find the starting point for this via Setup > Services > Enforced services. Underlying this is a collection of rule sets which have exactly the same names as the rule sets used for configuring the parameters for these checks.
The rules differ in two points however:
These are rules for hosts, not for services. The services will be created by the rules.
Since no discovery takes place, you must select the check plug-in to be used for the check.
The following example shows the body of the State of NTP time synchronisation rule under Enforced services:
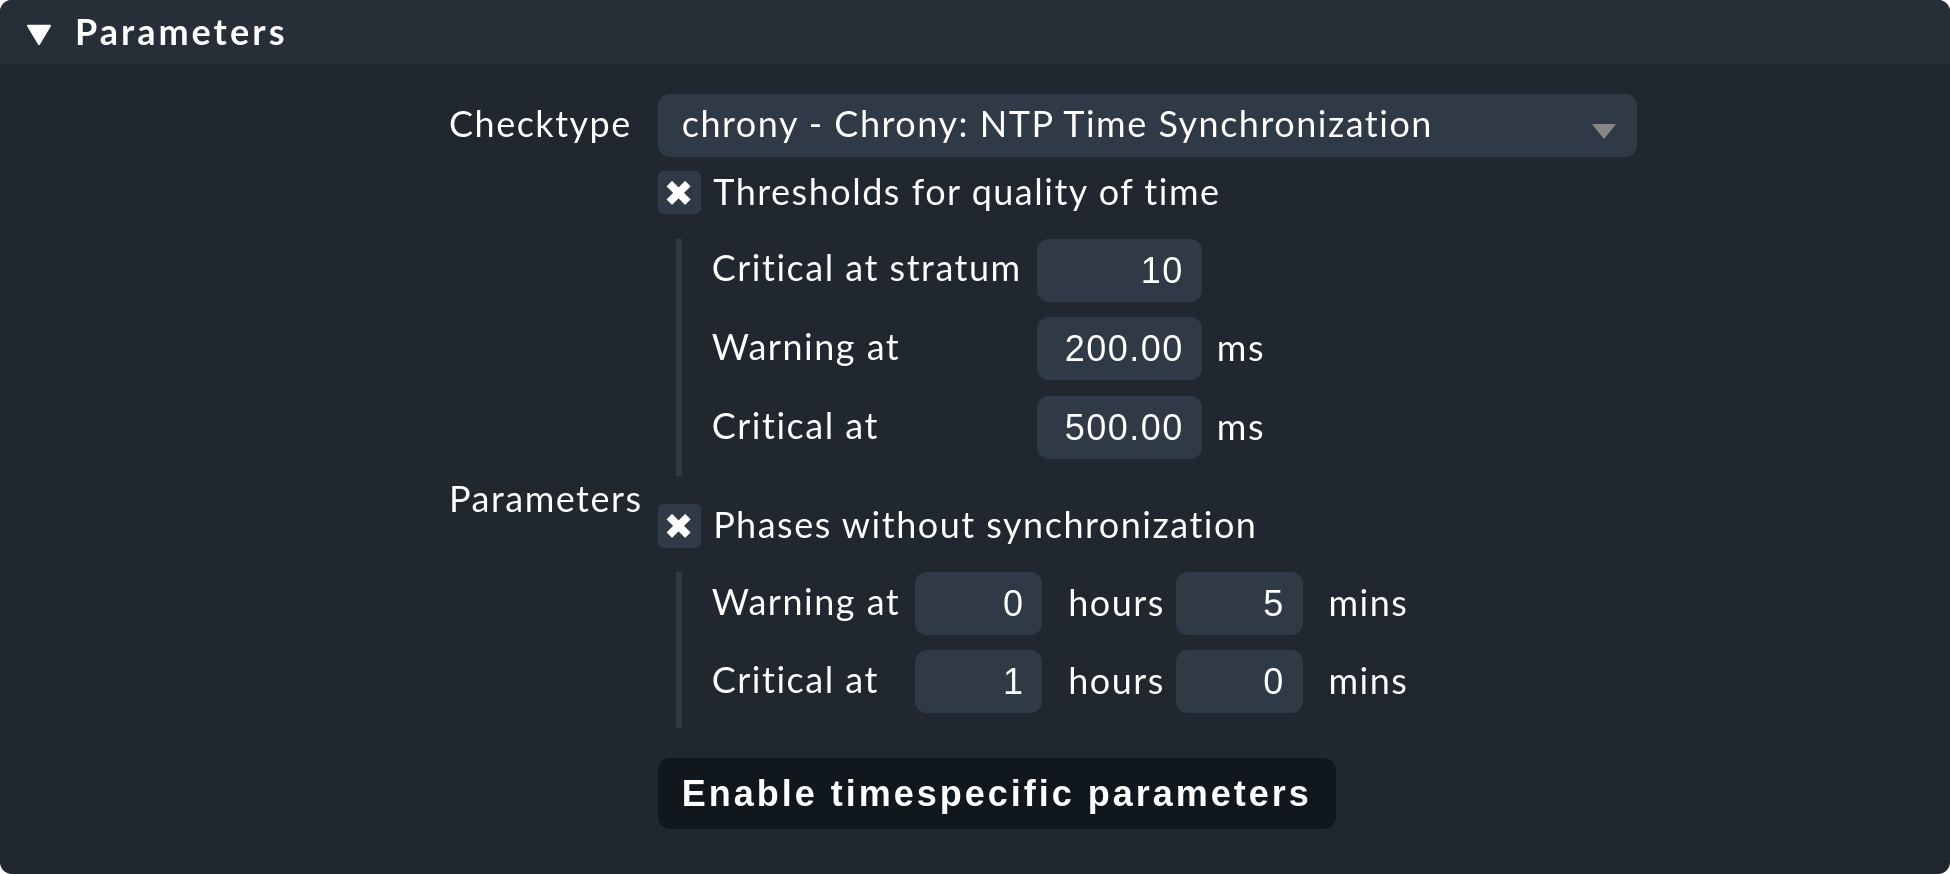
Alongside the thresholds, here you set the check plug-in (e.g. chrony
or ntp_time). For check plug-ins that require an item you must also
specify these. For example, this is necessary for the oracle_processes
plug-in, which requires the details of the data base SID to be monitored:

A manual service defined in this way will be installed on all hosts to which these rules apply. There will now be three possible conditions for the actual monitoring:
The host is correctly installed and the service is OK.
The agent notifies that the requested service does not run or has a problem. The service then flags CRIT or UNKNOWN.
The agent provides no information at all, e.g., because NTP is not even installed. The service then remains in PEND and the Checkmk service goes into WARN with the notice that the relevant section in the agent data is missing.
You won’t require most of the rule sets in the Enforced services module, they are only present for the sake of completeness. The most common cases of manual checks are:
Monitoring of Windows services (Rule set: Windows Services)
Monitoring of processes (Rule set: State and count of processes)
7. The discovery check
In the introduction we promised that Checkmk not only detects the list of services automatically, it can also keep it up to date. It would also be natural to have the possibility of manually running a bulk discovery for all hosts from time to time.
7.1. Automatic check for unmonitored services
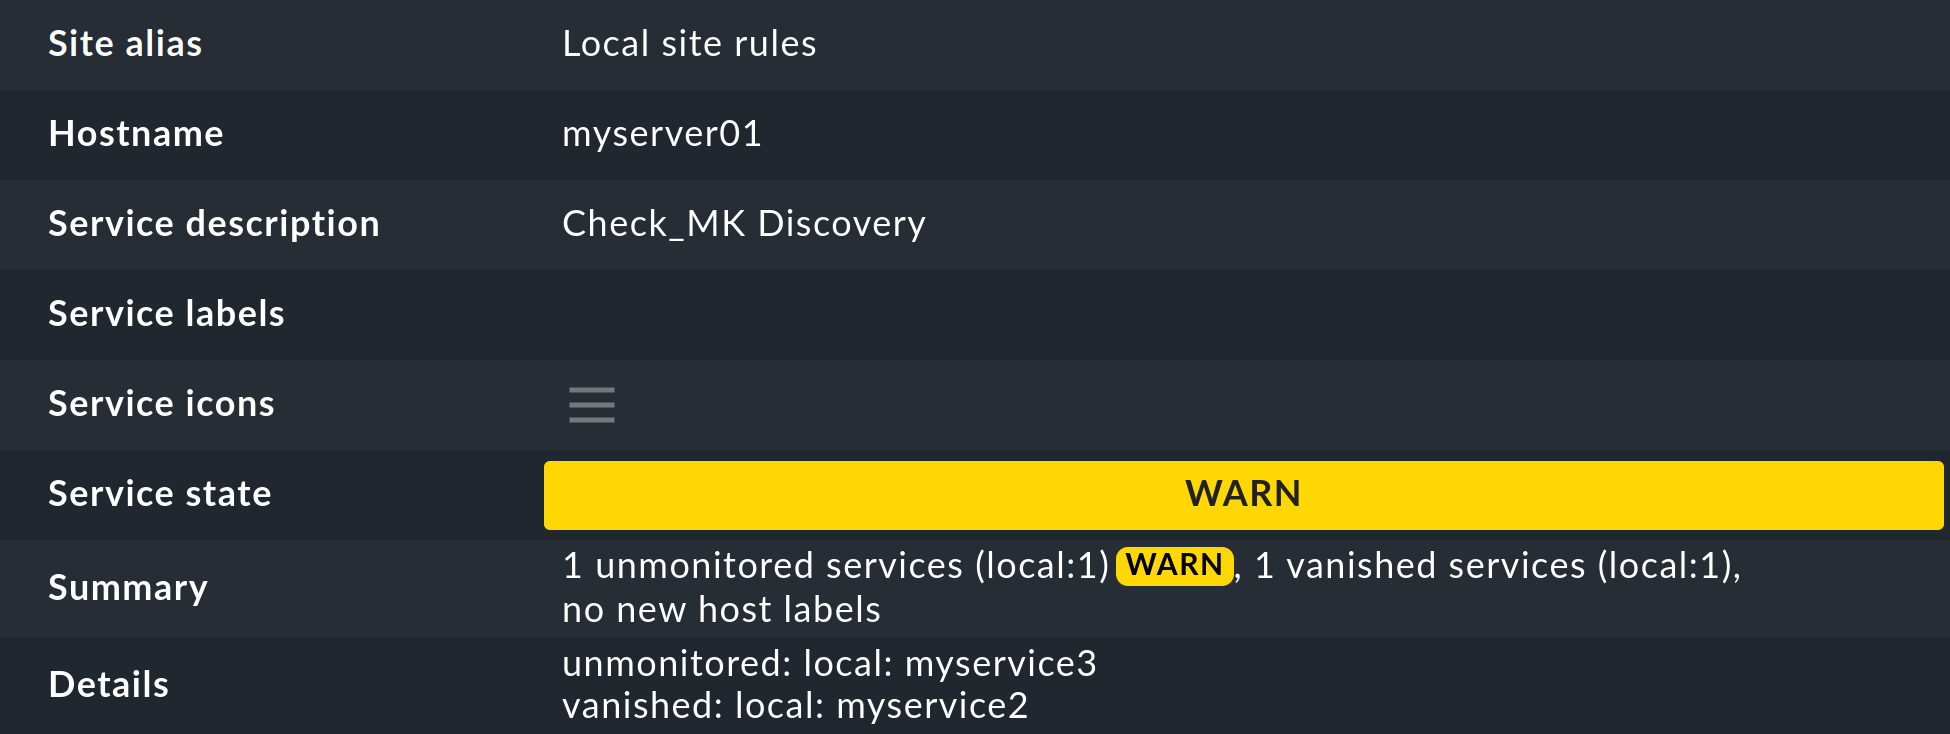
Much better for this however is a regular Discovery Check, which is set up automatically on new instances. This service exists for every host and will log a warning whenever it finds unmonitored items:

The details of unmonitored or vanished services can be found in the Long output of check plugin in the details of the service:
The host’s server list in the setup can be easily accessed via the discovery
check’s ![]() context menu using the
context menu using the ![]() Edit services entry.
Edit services entry.
The parameterizing of the discovery check is very simply done using the Periodic service discovery rule set. In a site which is fresh out the box, you will already find one rule which has been defined to apply to all hosts:
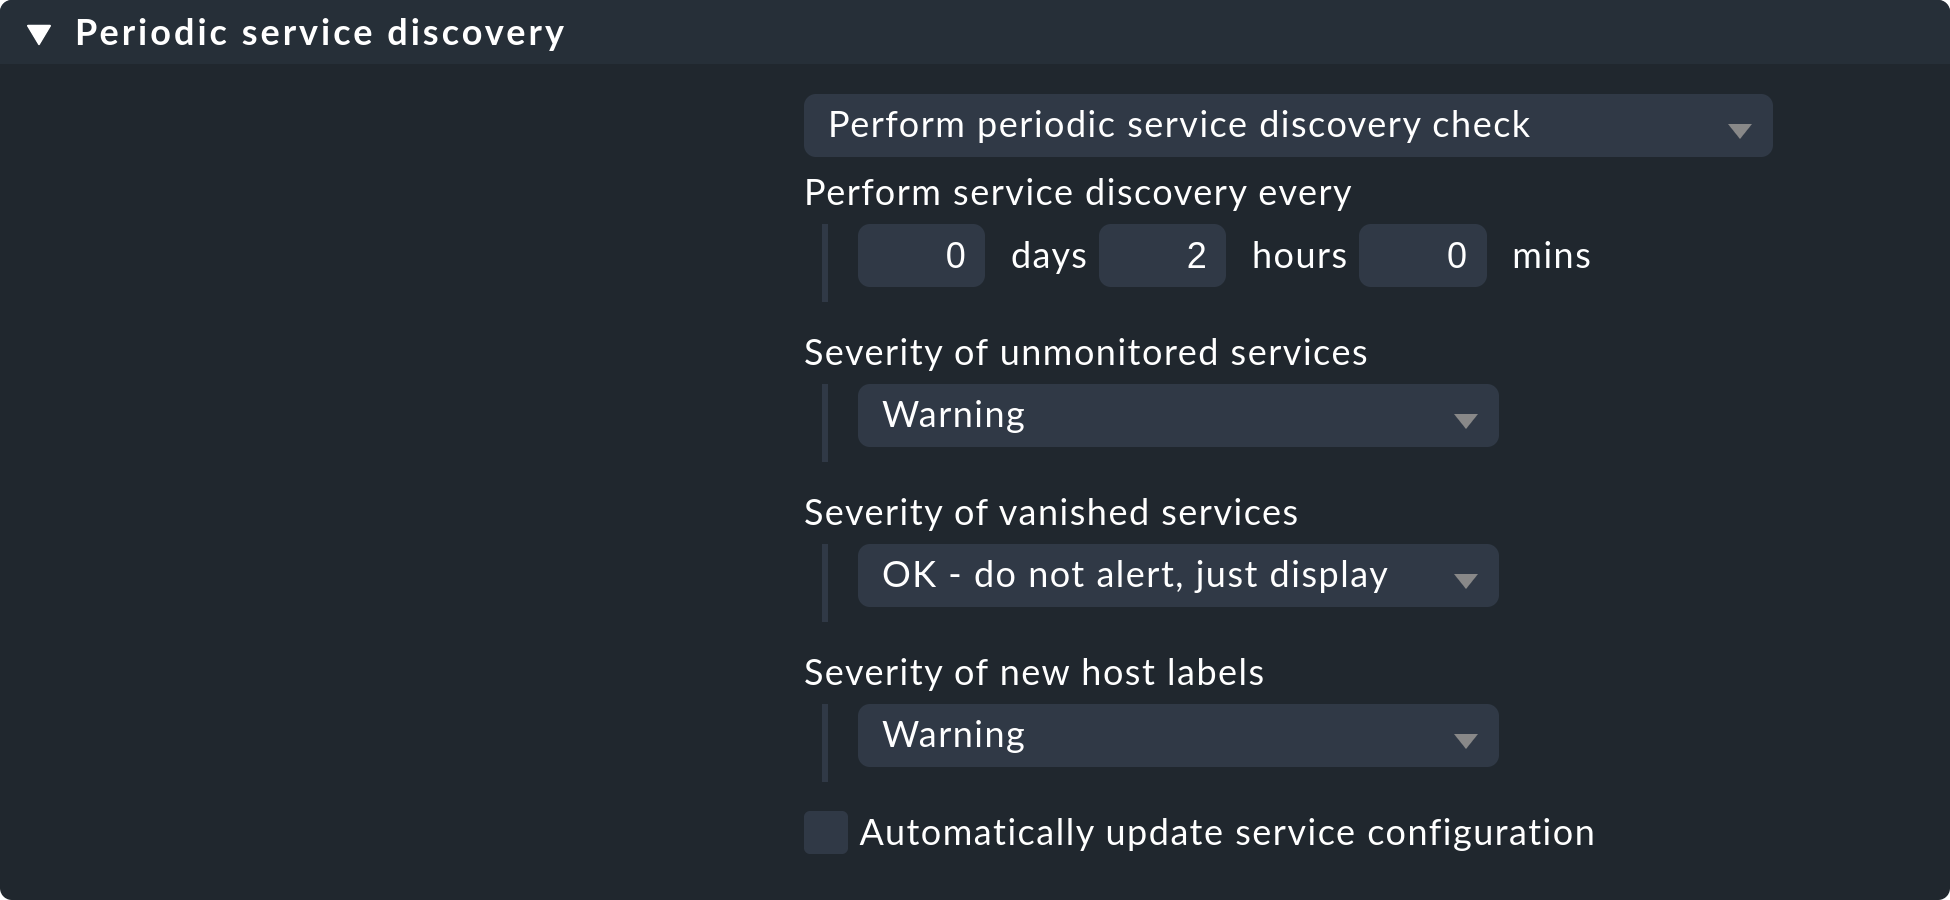
Alongside the interval in which the check is to be run, you can set monitoring state for cases of unmonitored or vanished services and also host labels.
7.2. Adding services automatically
Missing services can be added automatically to the discovery check. To this end activate the Automatically update service configuration option, which will make further options available.
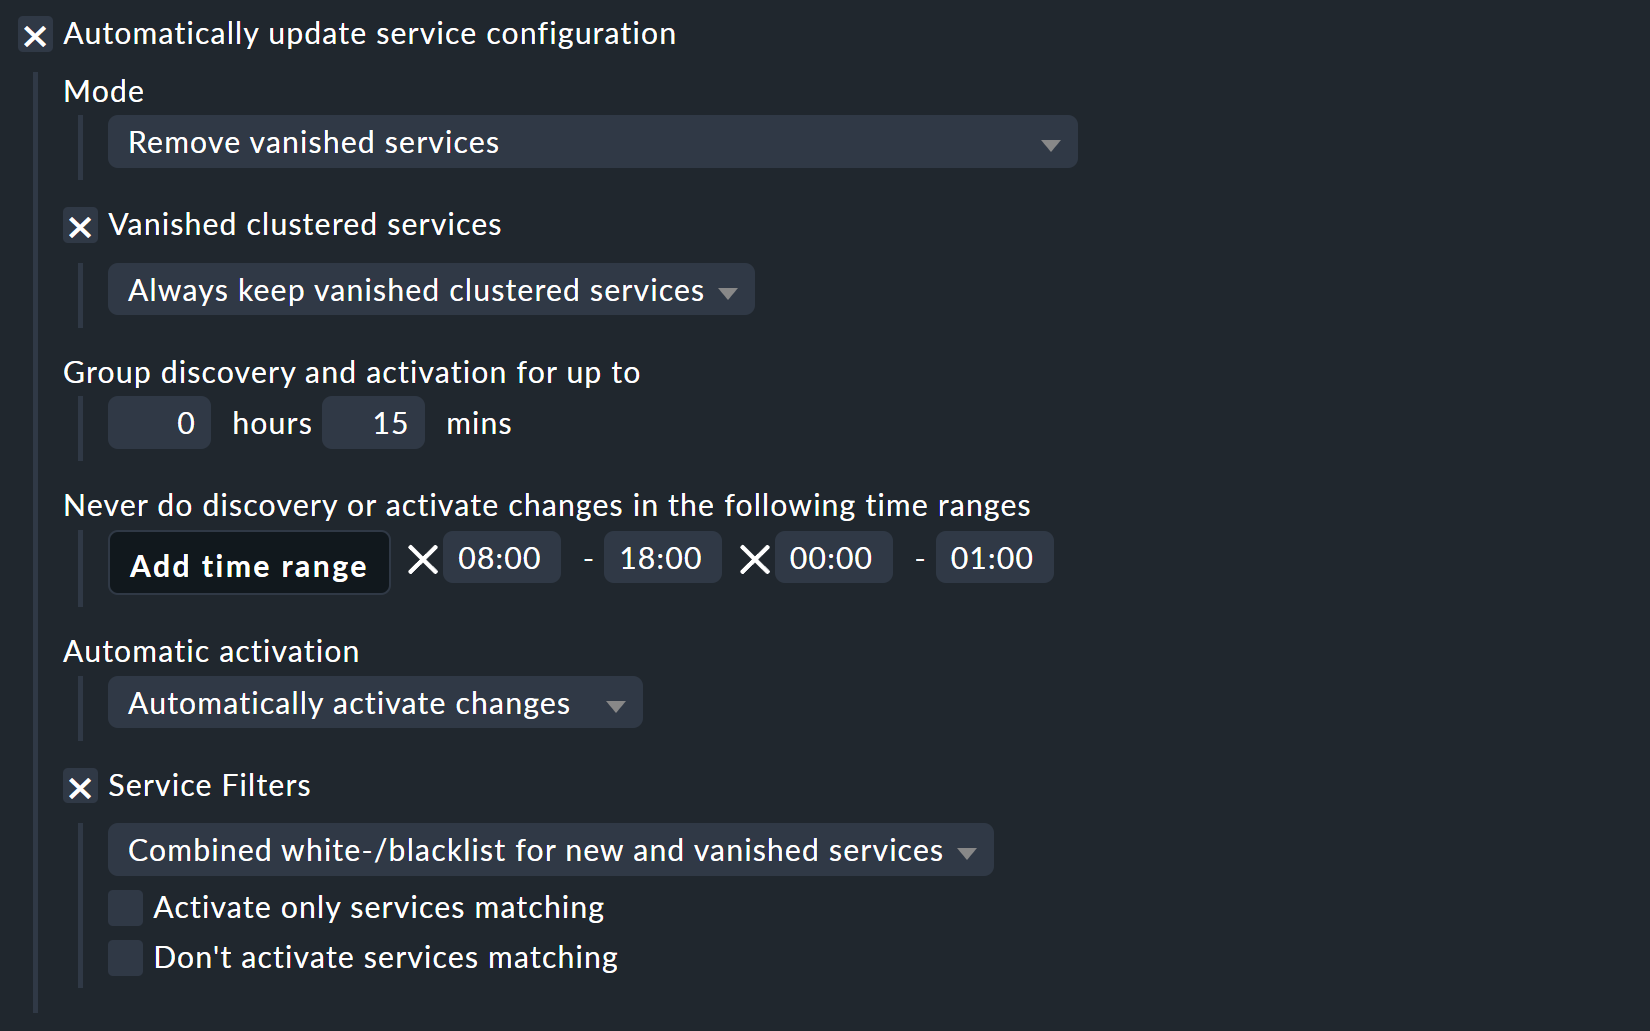
Alongside the additions, in Mode you can also choose to delete superfluous services, or even to delete all existing services and perform a complete new discovery (Refresh). Both options should be used carefully! A vanished service can indicate a problem! The discovery check will simply delete such a service and lull you into thinking everything is in order. The refresh is especially risky. For example, the check for switchports will only take ports that are ‘up’ into the monitoring. Ports with a status of ‘down’ will be perceived as vanished and quickly deleted from the discovery check!
A further problem needs to be considered: adding services or even the automatic Activate Changes can distract you — the admin — when you are performing a configuration. It can theoretically occur that while you are working on rules and settings, in that moment a discovery check activates your changes. In Checkmk only all changes can be activated at once! In order to preclude such situations you can reschedule the time for this function, to overnight for example. The above image shows an example of this.
Under Vanished clustered services you can handle clustered services separately. The special feature here: If a clustered service moves from one node to another, it could be briefly considered as vanished and accordingly deleted unintentionally. If you waive this option, in turn, services that have actually disappeared would never be deleted.
The Group discovery and activation for up to setting ensures that not every single service that has been newly-found immediately triggers an Activate Changes — rather there will be a specified waiting time so that multiple changes can be activated in a single action. Even if the discovery check is set to an interval of two hours or more, this only applies to each host separately. The checks don’t run simultaneously for every host — which is a good thing, as a discovery check requires significantly more resources than a normal check.
8. Passive services
Passive services are those that are not actively initiated by Checkmk, rather by check results regularly channeled from external sources. This generally occurs via the core’s command pipe. Here is a step-by-step procedure for creating a passive service:
First, you need to notify the core of the service. This is done with the same rule set as in your own active checks, except that you omit the Command line:
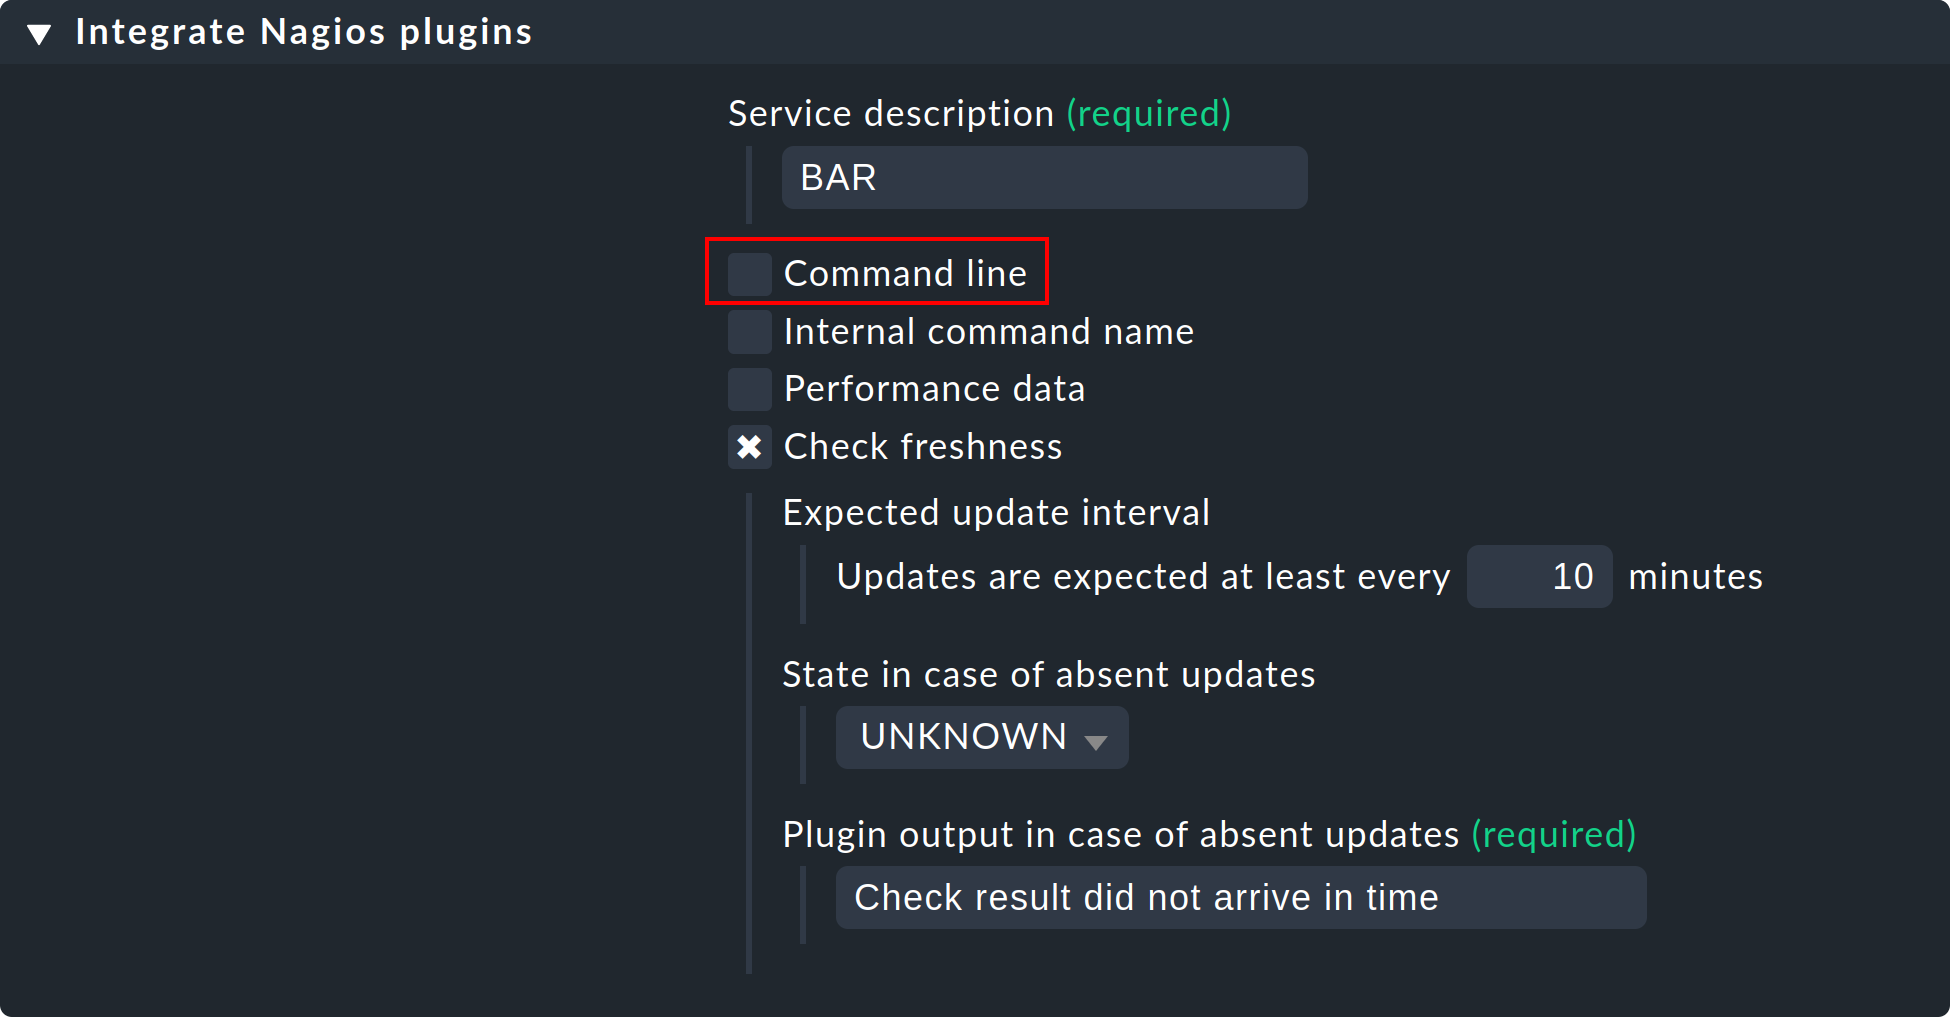
The image also shows how you can verify if check results are being regularly received. If these fail to appear for longer than ten minutes then the service will be automatically flagged as UNKNOWN.
After an Activate Changes the new service will start its life in the PEND state:

Sending the check result now takes place on the command line via an
echo of the PROCESS_SERVICE_CHECK_RESULT command in the
~/tmp/run/nagios.cmd command pipe.
The syntax conforms to the usual Nagios conventions — including a current
time stamp in square brackets. As the argument with the command you need
the host name (e.g., myhost) and the selected service name
(e.g., BAR). The two subsequent arguments are again the status
(0 … 3) and the plug-in’s output. The time stamp is
created with $(date +%s):
OMD[mysite]:~$ echo "[$(date +%s)] PROCESS_SERVICE_CHECK_RESULT;myhost;BAR;2;Something bad has happened" > ~/tmp/run/nagios.cmdThe service now immediately shows its new status:

9. Service discovery on the command line
A GUI is fine, but the good old command line is sometimes still
practical — whether it is for automation or it simply enables an experienced user
to work quickly. A service discovery can be triggered with the cmk
-I command on the command line. There are a couple of variables in
this process. For all of these the -v option is recommended, so that
you can see what happens. Without -v Checkmk behaves like the good
old traditional Unix — as long as everything is OK it says nothing.
With a simple ‘-I’ search for all hosts by new services:
OMD[mysite]:~$ cmk -vI
Discovering services and host labels on all hosts
myserver01:
+ FETCHING DATA
Using data from cache file /omd/sites/mysite/tmp/check_mk/cache/myserver01
[TCPFetcher] Use cached data
No piggyback files for 'myserver01'. Skip processing.
[PiggybackFetcher] Execute data source
+ PARSE FETCHER RESULTS
Received no piggyback data
+ EXECUTING HOST LABEL DISCOVERY
+ PERFORM HOST LABEL DISCOVERY
+ EXECUTING DISCOVERY PLUGINS (42)
SUCCESS - Found no new services, 2 host labels
myserver02:
+ FETCHING DATA
Using data from cache file /omd/sites/mysite/tmp/check_mk/cache/myserver02
[TCPFetcher] Use cached data
No piggyback files for 'myserver02'. Skip processing.
[PiggybackFetcher] Execute data source
+ PARSE FETCHER RESULTS
Received no piggyback data
+ EXECUTING HOST LABEL DISCOVERY
+ PERFORM HOST LABEL DISCOVERY
+ EXECUTING DISCOVERY PLUGINS (1900)
SUCCESS - Found no new services, 2 host labels
With the -I you can also enter one or more host names in order
to only discover these. This additionally has a second effect — whereas
an -I on all hosts basically works only with cached data,
Checkmk always works with fresh data from an explicitly-nominated host!
OMD[mysite]:~$ cmk -vI myserver01Alternatively, you can filter using tags:
OMD[mysite]:~$ cmk -vI @mytagThis would perform the discovery for all hosts with the host tag mytag.
Filtering with tags is available for all cmk options that accept multiple hosts.
With the --cache and respectively --no-cache options you
can explicitly determine the use of cache.
Additional outputs can be received with a second -v. With SNMP-based
devices you can even see every single OID retrieved from the device:
OMD[mysite]:~$ cmk -vvI myswitch01
Discovering services on myswitch01:
myswitch01:
 SNMP scan:
       Getting OID .1.3.6.1.2.1.1.1.0: Executing SNMP GET of .1.3.6.1.2.1.1.1.0 on switch
=> ['24G Managed Switch'] OCTETSTR
24G Managed Switch
       Getting OID .1.3.6.1.2.1.1.2.0: Executing SNMP GET of .1.3.6.1.2.1.1.2.0 on switch
=> ['.1.3.6.1.4.1.11863.1.1.3'] OBJECTID
.1.3.6.1.4.1.11863.1.1.3
       Getting OID .1.3.6.1.4.1.231.2.10.2.1.1.0: Executing SNMP GET of .1.3.6.1.4.1.231.2.10.2.1.1.0 on switch
=> [None] NOSUCHOBJECT
failed.
       Getting OID .1.3.6.1.4.1.232.2.2.4.2.0: Executing SNMP GET of .1.3.6.1.4.1.232.2.2.4.2.0 on switch
=> [None] NOSUCHOBJECT
failed.
A complete renewal of the services (tabula rasa) can be performed with a
double -II:
OMD[mysite]:~$ cmk -vII myserver01
Discovering services and host labels on: myserver01
myserver01:
+ FETCHING DATA
Using data from cache file /omd/sites/mysite/tmp/check_mk/cache/myserver01
[TCPFetcher] Use cached data
No piggyback files for 'myserver01'. Skip processing.
No piggyback files for '127.0.0.1'. Skip processing.
[PiggybackFetcher] Execute data source
+ PARSE FETCHER RESULTS
Received no piggyback data
+ EXECUTING HOST LABEL DISCOVERY
+ PERFORM HOST LABEL DISCOVERY
+ EXECUTING DISCOVERY PLUGINS (10)
    1 cpu.loads
    1 cpu.threads
    6 cups_queues
    3 df
    1 diskstat
    3 kernel
    1 kernel.util
    3 livestatus_status
    1 lnx_if
    1 lnx_thermal
SUCCESS - Found 21 services, 2 host labels
You can also restrict all of this to a single check plug-in. For this the
option is --detect-plugins=, and it must be placed before the host name:
cmk -vII --detect-plugins=df myserver01
Discovering services and host labels on: myserver01
myserver01:
+ FETCHING DATA
[TCPFetcher] Execute data source
No piggyback files for 'myserver01'. Skip processing.
No piggyback files for '127.0.0.1'. Skip processing.
[PiggybackFetcher] Execute data source
+ PARSE FETCHER RESULTS
Received no piggyback data
+ EXECUTING HOST LABEL DISCOVERY
+ PERFORM HOST LABEL DISCOVERY
+ EXECUTING DISCOVERY PLUGINS (1)
  3 df
SUCCESS - Found 3 services, no host labels
When you are finished you can activate the changes with cmk -O
(cmk -R with Nagios Core):
OMD[mysite]:~$ cmk -O
Generating configuration for core (type cmc)...OK
Creating helper config...OK
Reloading monitoring core...OK
And when you encounter an error during a discovery…
OMD[mysite]:~$ cmk -vII --detect-plugins=df myserver01
  WARNING: Exception in discovery function of check type 'df': global name 'bar' is not defined
  nothing
… with an additional --debug you can produce a detailed Python
stack trace of the fault location:
OMD[mysite]:~$ cmk --debug -vII --detect-plugins=df myserver01
Discovering services and host labels on myserver01:
myserver01:
Traceback (most recent call last):
  File "/omd/sites/heute/share/check_mk/modules/check_mk.py", line 5252, in <module>
    do_discovery(hostnames, check_types, seen_I == 1)
  File "/omd/sites/heute/share/check_mk/modules/discovery.py", line 76, in do_discovery
    do_discovery_for(hostname, check_types, only_new, use_caches, on_error)
  File "/omd/sites/heute/share/check_mk/modules/discovery.py", line 96, in do_discovery_for
    new_items = discover_services(hostname, check_types, use_caches, do_snmp_scan, on_error)
  File "/omd/sites/heute/share/check_mk/modules/discovery.py", line 677, in discover_services
    for item, paramstring in discover_check_type(hostname, ipaddress, check_type, use_caches, on_error):
  File "/omd/sites/heute/share/check_mk/modules/discovery.py", line 833, in discover_check_type
    discovered_items = discovery_function(info)
  File "/omd/sites/heute/share/check_mk/checks/df", line 91, in inventory_df
    foo = bar
NameError: global name 'bar' is not defined
9.1. Overview of options
To recap — all options at a glance:
|
Discover new services |
|
Delete and rediscover all services (tabula rasa) |
|
Verbose: display hosts and detected services |
|
Very verbose: display a precise protocol of all operations |
|
Execute a discovery (and also a tabula rasa) only for the specified check plug-in |
|
Execute a discovery (and also a tabula rasa) only for hosts with the specified tag |
|
Force the use of cache data (normally the default only when no host is specified) |
|
Fetch fresh data (normally the default only when a host name is specified) |
|
Cancel in an error situation, and display the complete Python stack trace |
|
Activate changes (commercial editions with CMC as core) |
|
Activate changes (Raw Edition with Nagios as core) |
9.2. Saving in files
The result of a service discovery — thus, as explained earlier, the
tables of host names, check plug-ins, items and identified parameters — can
be found in the var/check_mk/autochecks folder. Here, for every
host there is a data set that stores the automatically-discovered services.
As long as you don’t damage this data set’s Python syntax you can alter or
delete individual lines manually. Deleting the data set removes all services
and flags them as quasi ‘unmonitored’ again.
[
  {'check_plugin_name': 'cpu_loads', 'item': None, 'parameters': (5.0, 10.0), 'service_labels': {}},
  {'check_plugin_name': 'cpu_threads', 'item': None, 'parameters': {}, 'service_labels': {}},
  {'check_plugin_name': 'diskstat', 'item': 'SUMMARY', 'parameters': {}, 'service_labels': {}},
  {'check_plugin_name': 'kernel_performance', 'item': None, 'parameters': {}, 'service_labels': {}},
  {'check_plugin_name': 'kernel_util', 'item': None, 'parameters': {}, 'service_labels': {}},
  {'check_plugin_name': 'livestatus_status', 'item': 'myremotesite', 'parameters': {}, 'service_labels': {}},
  {'check_plugin_name': 'lnx_thermal', 'item': 'Zone 0', 'parameters': {}, 'service_labels': {}},
  {'check_plugin_name': 'mem_linux', 'item': None, 'parameters': {}, 'service_labels': {}},
  {'check_plugin_name': 'mknotifyd', 'item': 'mysite', 'parameters': {}, 'service_labels': {}},
  {'check_plugin_name': 'mknotifyd', 'item': 'myremotesite', 'parameters': {}, 'service_labels': {}},
  {'check_plugin_name': 'mounts', 'item': '/', 'parameters': ['errors=remount-ro', 'relatime', 'rw'], 'service_labels': {}},
  {'check_plugin_name': 'omd_apache', 'item': 'mysite', 'parameters': {}, 'service_labels': {}},
  {'check_plugin_name': 'omd_apache', 'item': 'myremotesite', 'parameters': {}, 'service_labels': {}},
  {'check_plugin_name': 'tcp_conn_stats', 'item': None, 'parameters': {}, 'service_labels': {}},
  {'check_plugin_name': 'timesyncd', 'item': None, 'parameters': {}, 'service_labels': {}},
  {'check_plugin_name': 'uptime', 'item': None, 'parameters': {}, 'service_labels': {}},
]
10. Service groups
10.1. Why have service groups?
So far you have learned how to include services in monitoring. Now it makes little sense to have to look at lists of thousands of services and/or always have to go through host views. For example, if you want to view all file system or update services together, you can simply assemble groups in a similar way as you can with host groups.
Service groups make it easy for you to bring a lot more order to monitoring via views and NagVis maps, and to switch targeted notifications and alert handlers. By the way – you could almost always construct corresponding views purely using the view filters – but service groups are more clearly arranged and easier to work with.
10.2. Creating service groups
You find the service groups via Setup > Services > Service groups.
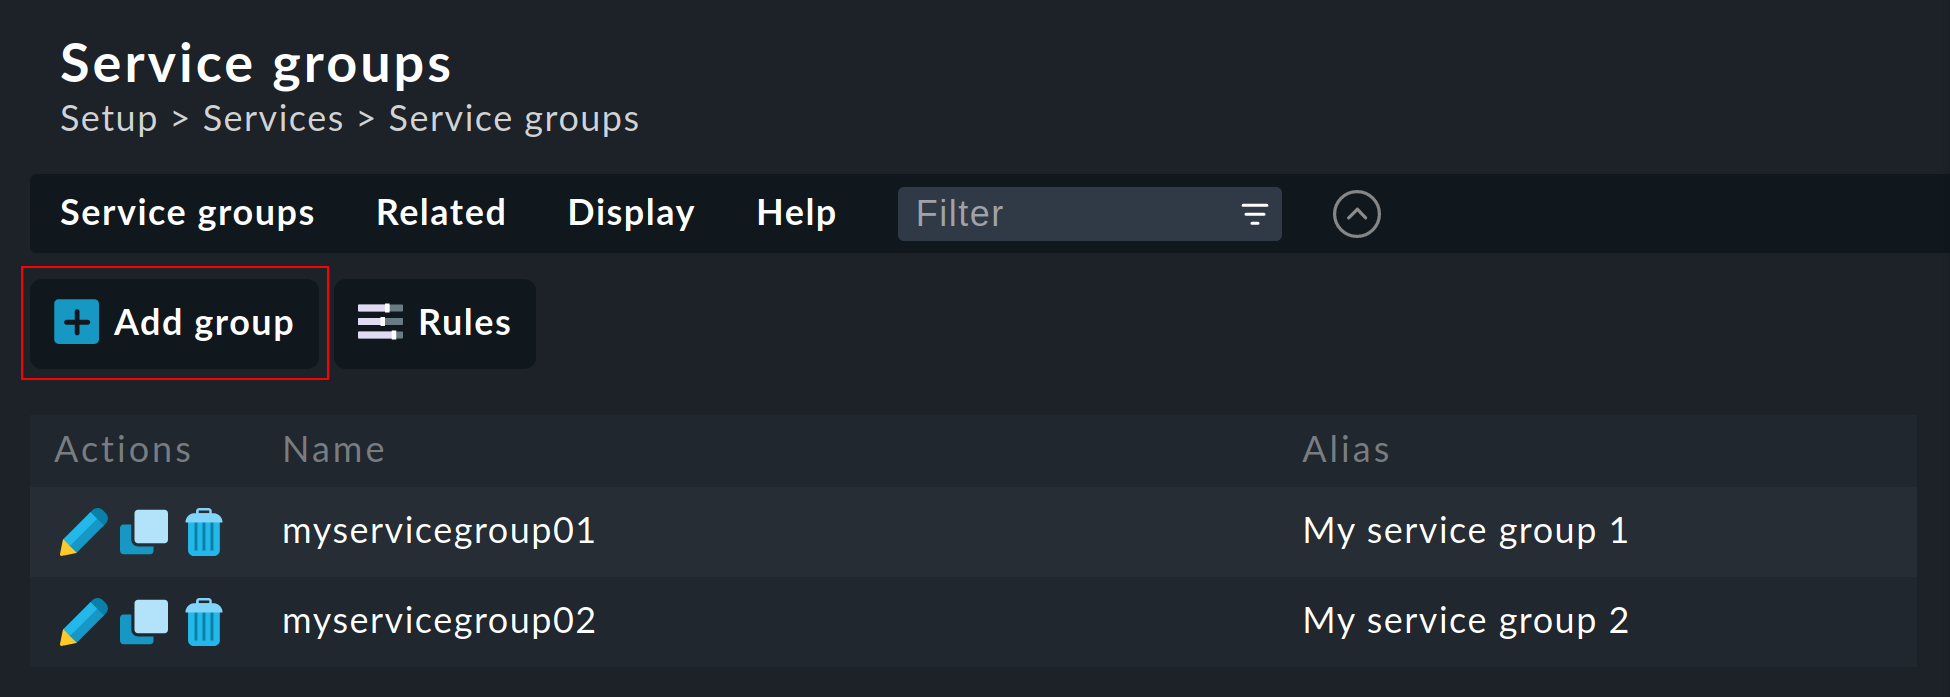
Creating a service group is simple:
Create a group via ![]() Add group and assign a name that cannot be subsequently changed, and likewise a meaningful alias:
Add group and assign a name that cannot be subsequently changed, and likewise a meaningful alias:

10.3. Adding services to a service group
To assign services to service groups you need the rule set Assignment of services to service groups. The fastest way to go there is via the overview of the service groups (Setup > Services > Service Groups). Here you simply click Service Groups > Assign to group > Rules in the menu bar. Alternatively, you can, of course, find the rule via the rule search in the Setup menu, or dig through Setup > Services > Service monitoring rules > Various > Assignment of services to service groups. Now use Create rule in folder to do just that. First you specify which service group to assign services to, for example myservicegroup or its alias My service group 1.

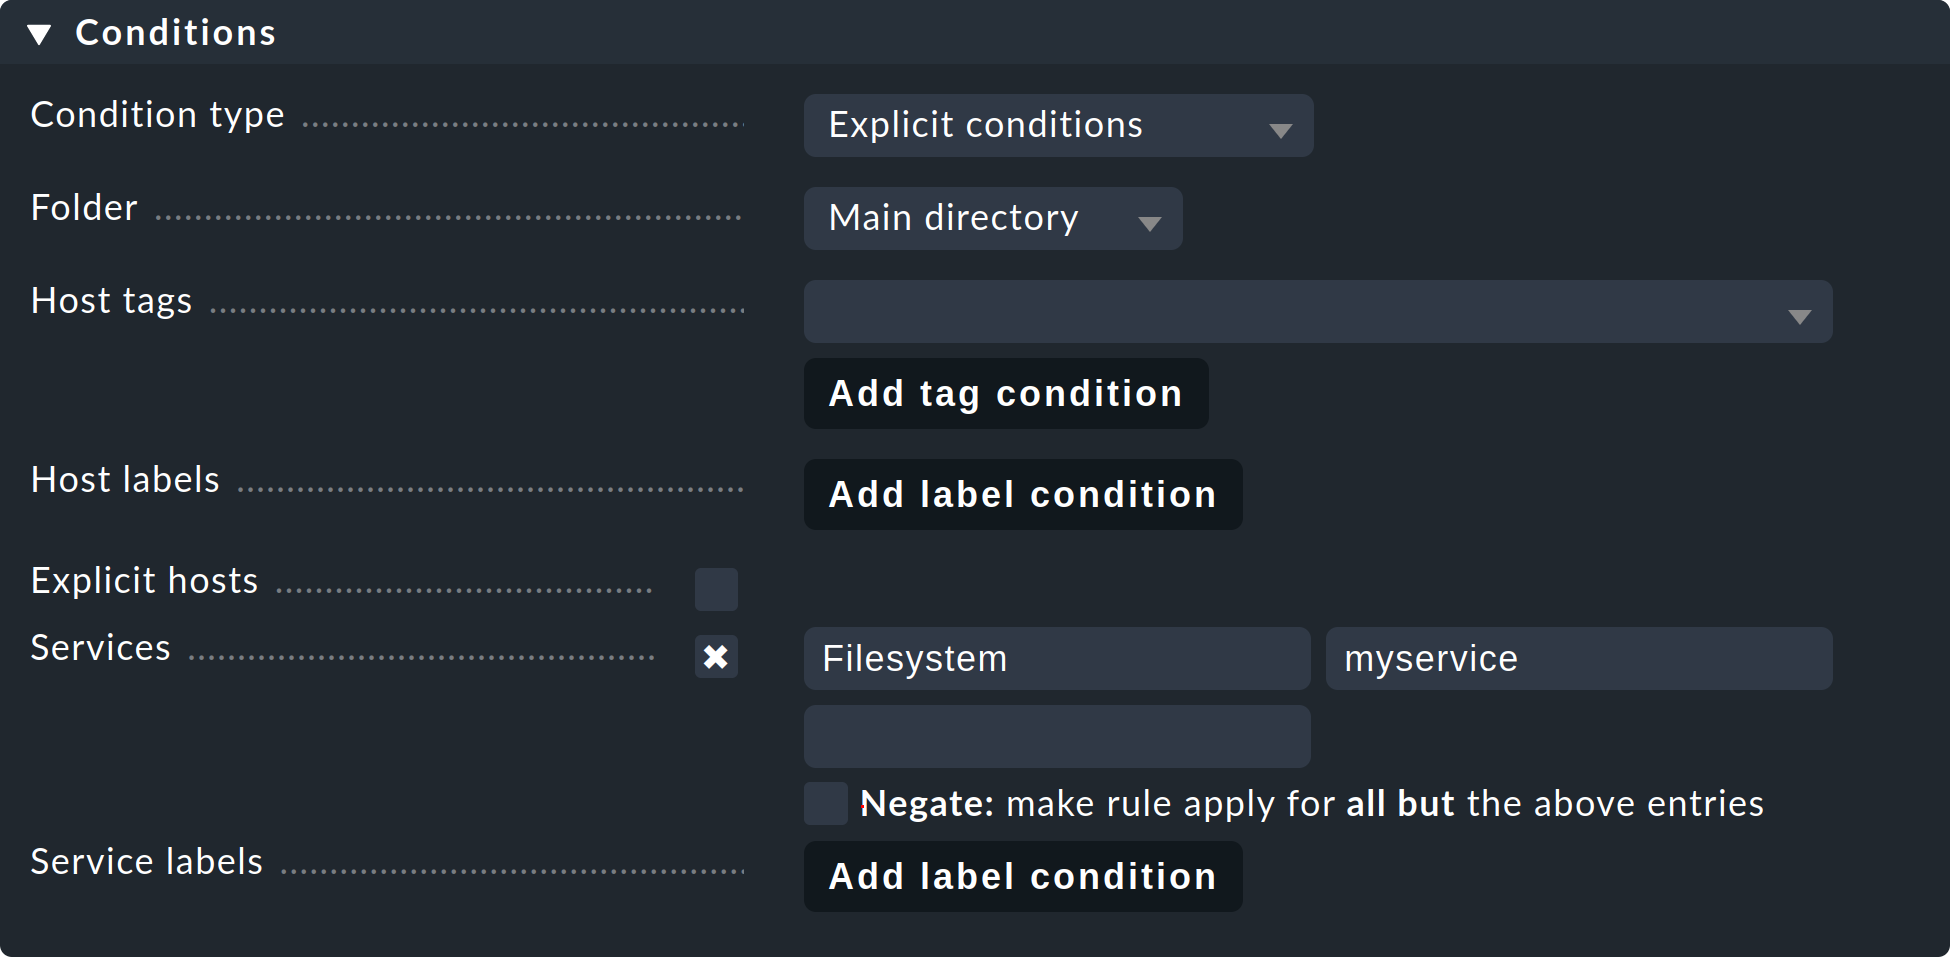
The exciting part now follows in the Conditions section.
On the one hand, you can use folders, host tags, and explicit host names to make restrictions outside of the services.
Secondly, you name the services you would like to group, such as Filesystem and myservice to create a set of file systems.
The specification of the services takes place here in the form of regular expressions. This allows you to define groups exactly.
10.4. Checking the service groups for a service
You can check the assignment of services on the detail page of a particular service. Below, by default, is the Service groups the service is member of line.

10.5. Using service groups
As already mentioned, the service groups are used in several places: views, NagVis maps, notifications and alert handlers. For new views it is important that you use the Service groups as the data source. Of course, the Views widget also contains predefined views for service groups, for example a clear summary:

With a click on the service group names you will receive a complete view of all of the services of the respective group.
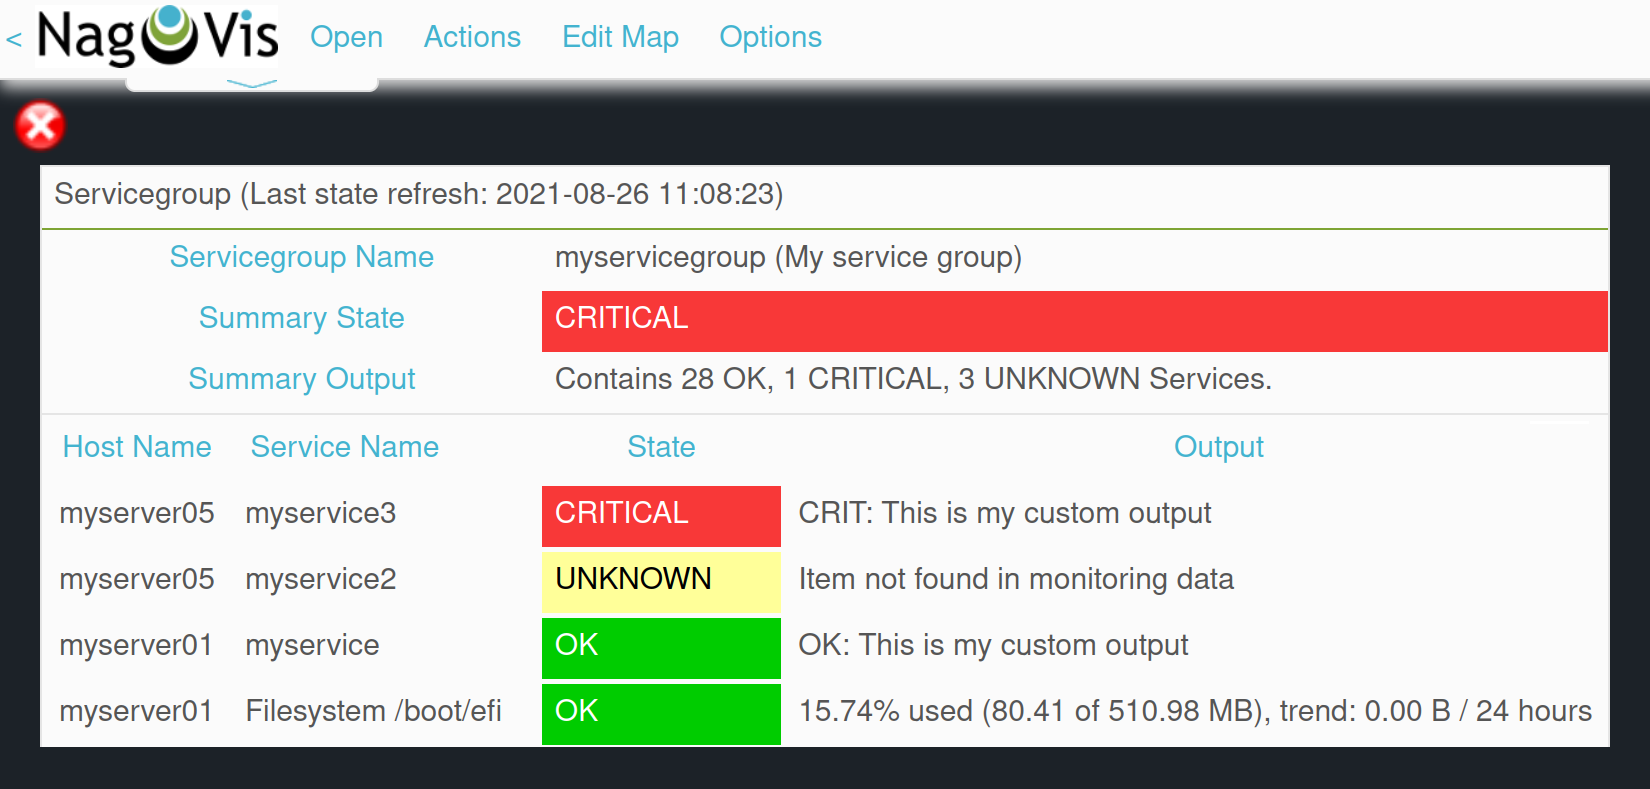
If you use service groups in NagVis maps, you will receive a summary of service groups opened in a menu by hovering over a single icon:
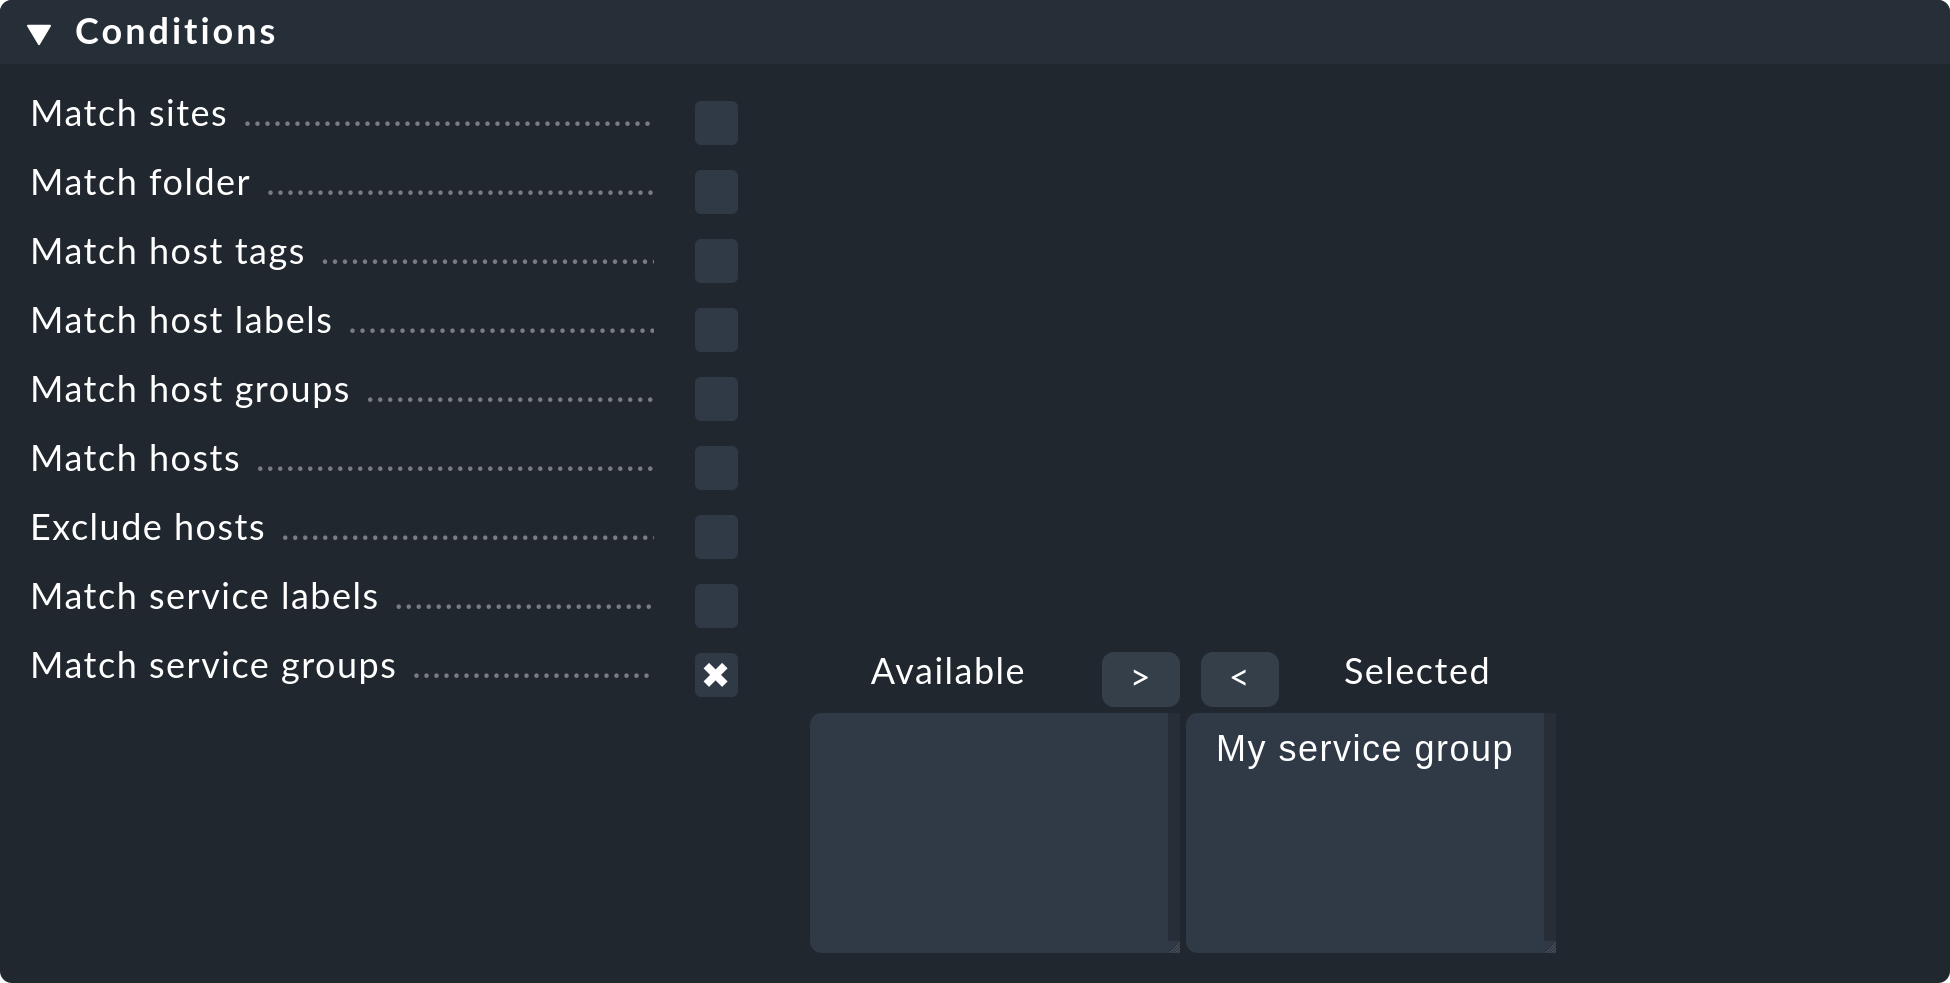
When you use service groups in notifications and alert handlers, they are available as conditions/filters, of which you can use one or more:
11. More on Check plug-ins
11.1. A short description of their functionality
Check plug-ins are required to generate services in Checkmk.
Each service uses a check plug-in to determine its status, create/maintain metrics, etc.
When doing so such a plug-in can create one or more services per host.
So that multiple services from the same plug-in can be distinguished, an Item is needed.
For example, for the service Filesystem /var the Item is the text /var.
In the case of plug-ins that can only generate a maximum of one service per host,
CPU utilization) for example, the Item is empty and not shown.
11.2. Available check plug-ins
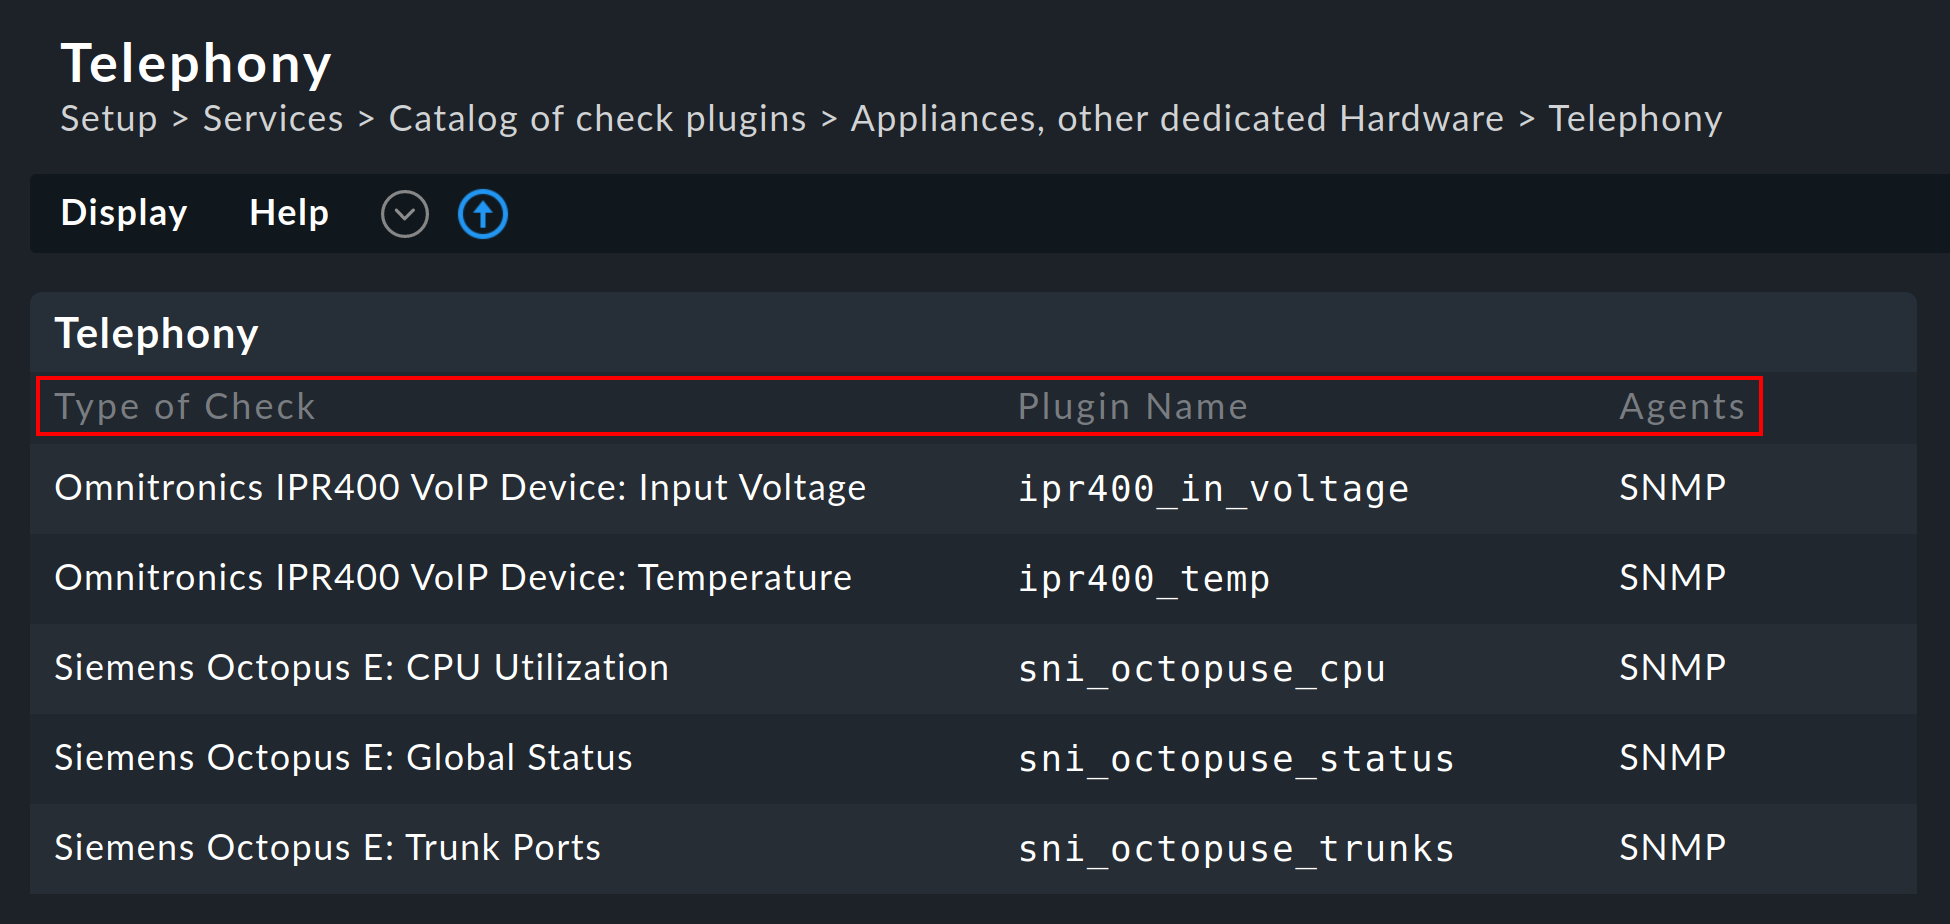
A list of all available check plug-ins can be found under Setup > Services > Catalog of check plugins. Here the individual plug-ins can be searched for, filtered in various categories:
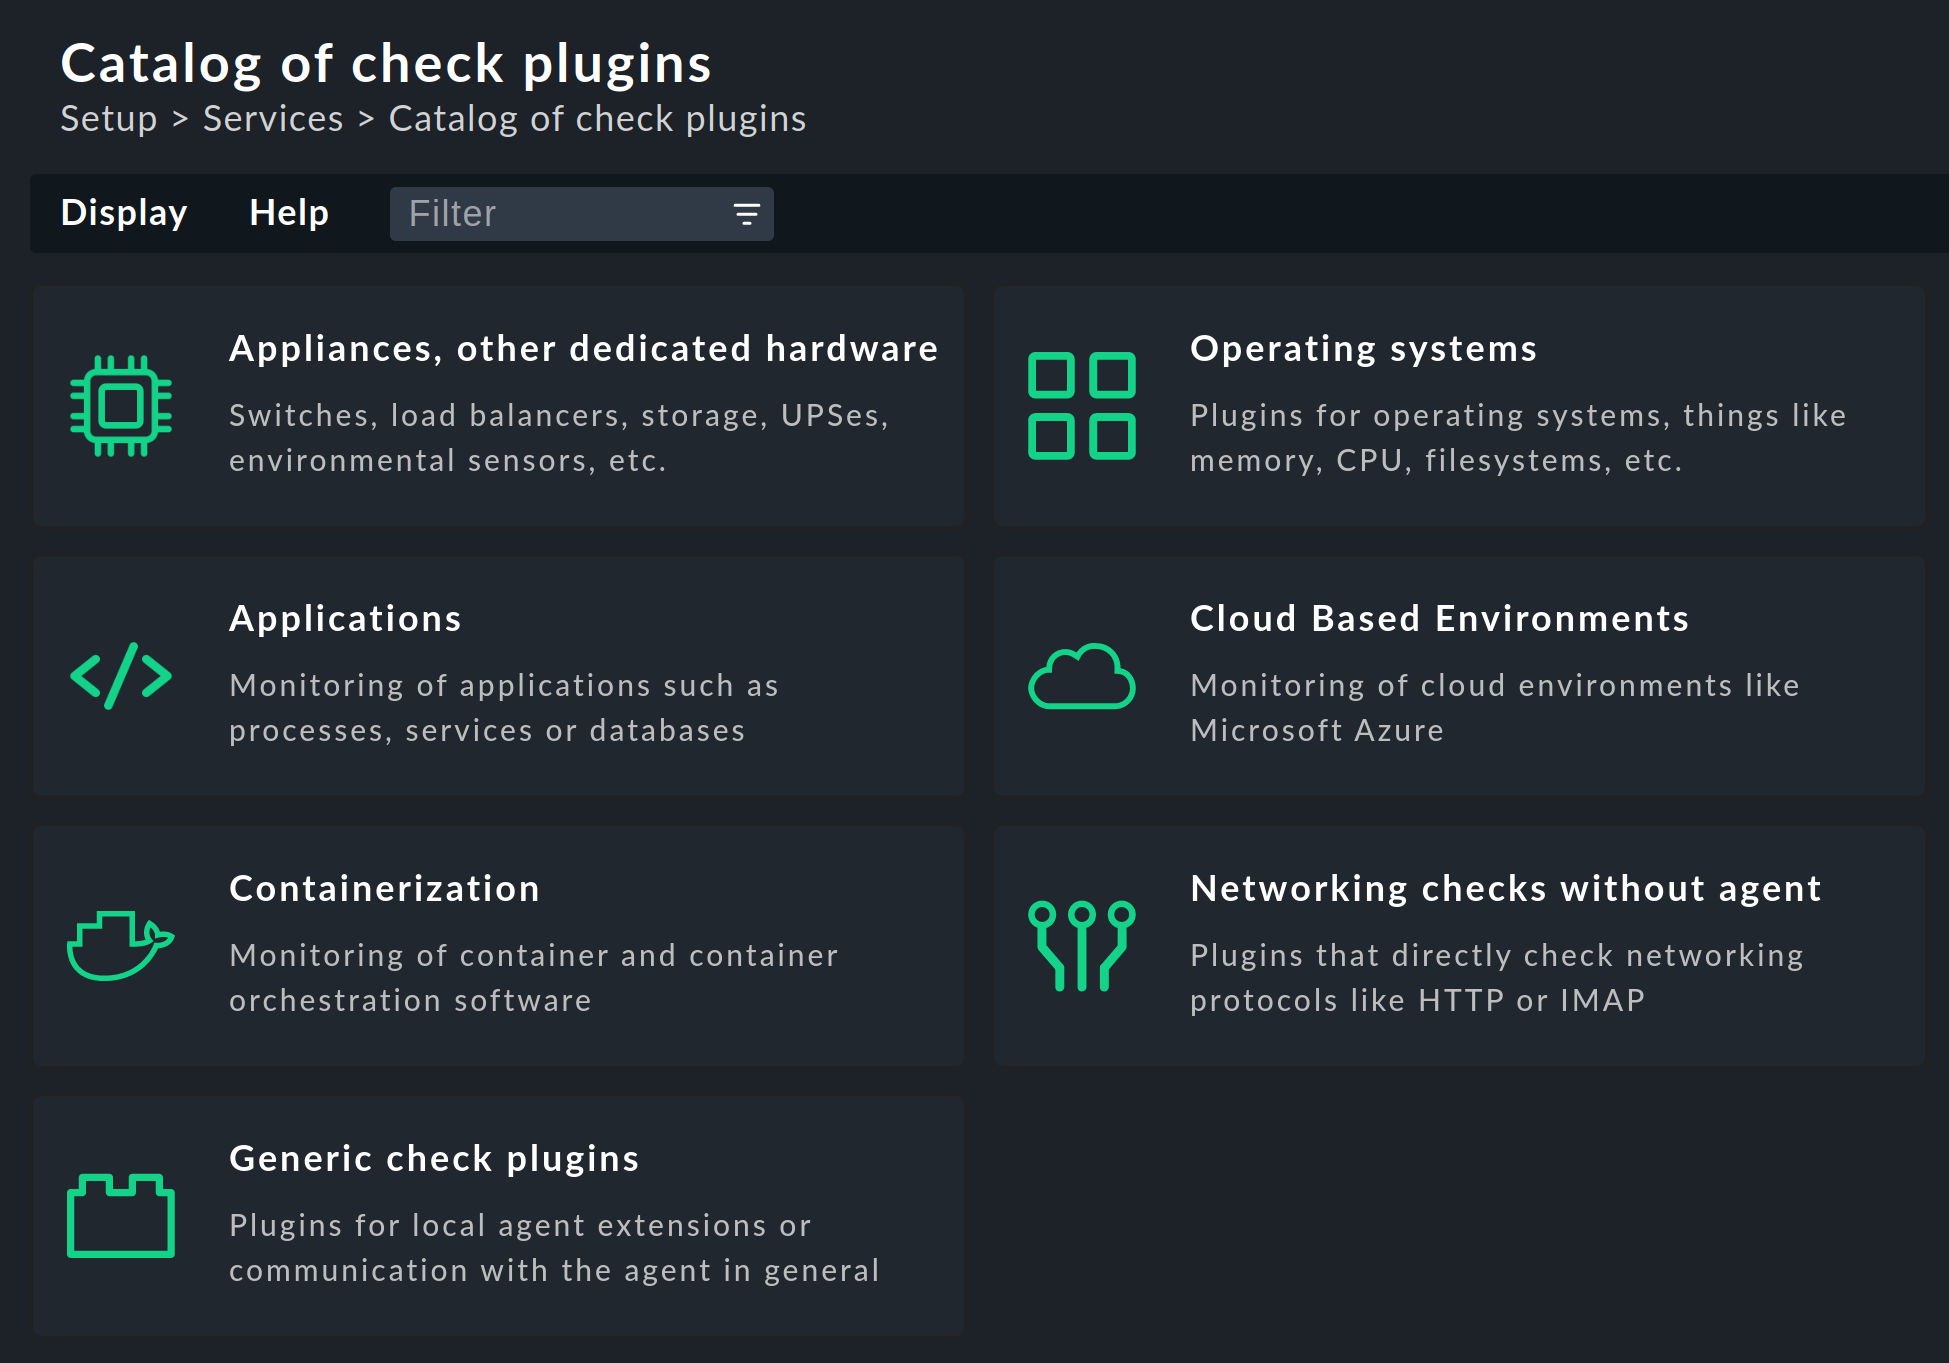
For each plug-in three columns of information will be shown: a description of the service (Type of Check), the name of the check plug-in (Plug-in Name) and its compatible data sources (Agents):
