1. Introduction
In addition to the conventional monitoring — i.e. the monitoring of status, log and measurement data — Checkmk includes another completely different function virtually free of charge: the Hardware/Software Inventory (or HW/SW Inventory for short). This can automatically identify elements on your hosts, such as, for example:
Which software packages — and which versions of these — are installed on a server?
What kind of RAM components does a server have?
Which BIOS version is installed on the motherboard?
The serial numbers of the installed hard disks.
Whether any ports on a switch not been used for a while (and which are thus probably free)?
… and much more
The data obtained in this way are displayed per host in a structured tree, and in various other views, and are also available via an API. Here is a small example with CPU data:
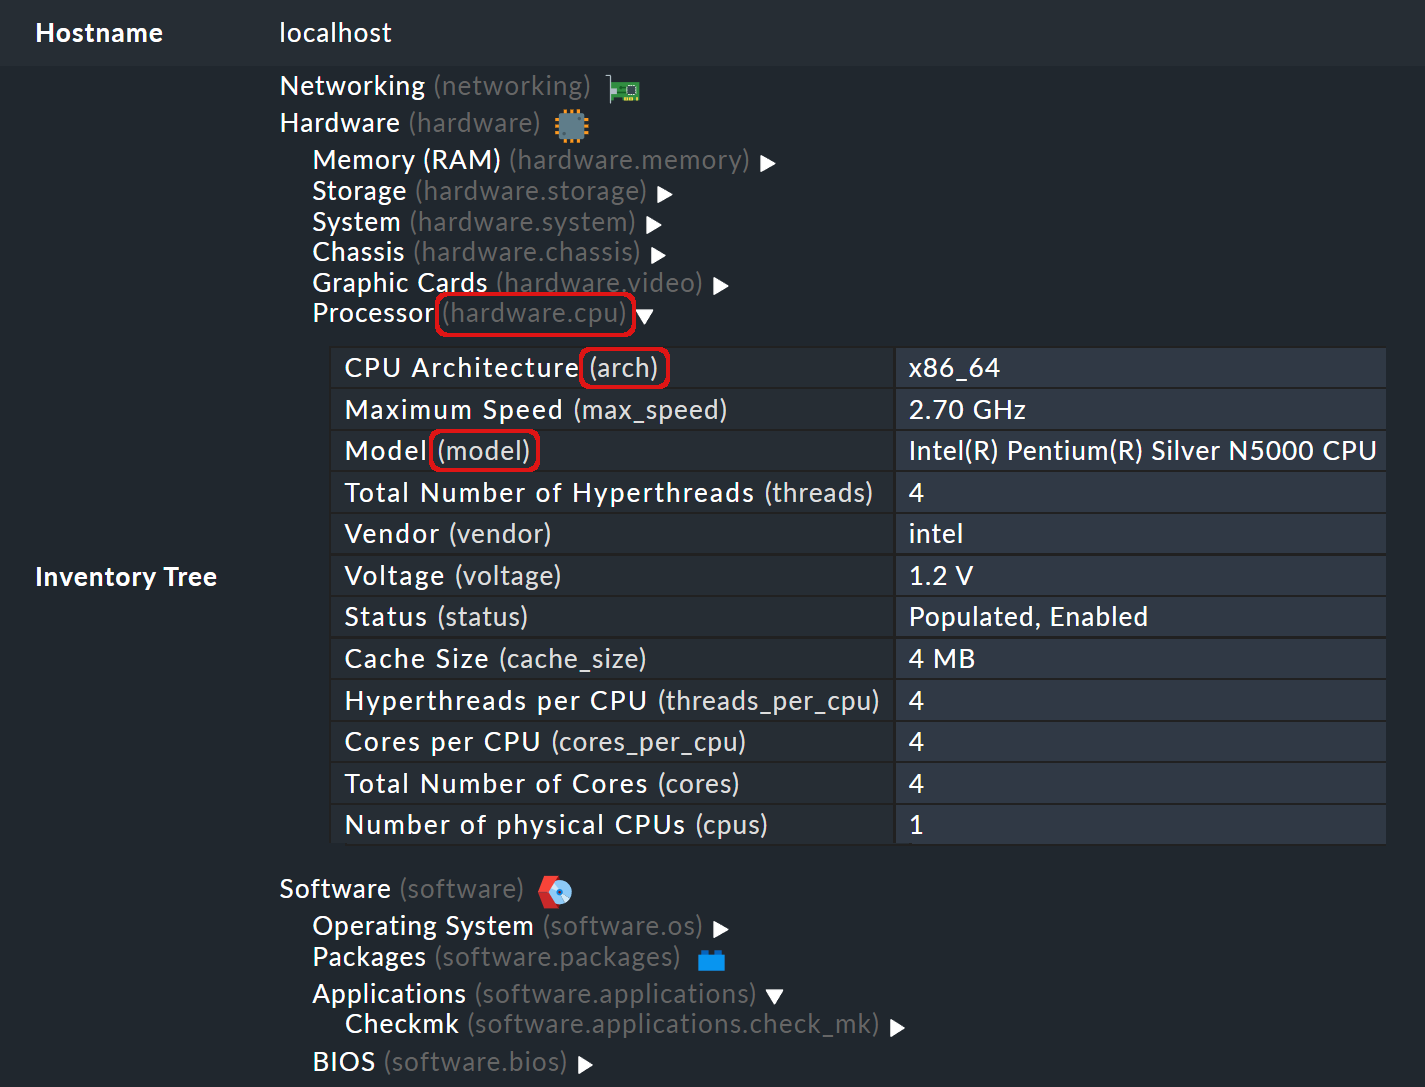
hardware.cpu
With the Hardware/Software Inventory you can perform a variety of tasks, such as:
Provide data on installed software for a license management system
Determine type designations for spare parts orders (RAM, hard disks, fans)
Provide general hardware and software data for regular import into CMDBs, so that these are based on current data
Track changes to hardware or software, e.g., to determine when a specific BIOS update was performed
Be informed if something has changed in the hardware or software
To identify servers that have not yet had a specific service pack installed
The most important advantage over other comparable systems is obvious — you can simply utilize Checkmk’s existing infrastructure and save yourself the effort of rolling out and administering another software environment. You just roll out a single additional agent plug-in. This is not even necessary with SNMP devices because the inventory scanner also supports SNMP and simply fetches the data over this route.
And besides, Checkmk does not need to hide behind other inventory scanners. As with our check plug-ins, we are constantly working to expand the data scanning. Each Checkmk version brings new plug-ins for the inventory scanner, and the information that can be collected is becoming more detailed and extensive.
2. Installation
Installing the HW/SW Inventory is performed in two steps. The prerequisite is that the Checkmk agent has already been installed on the hosts (if these are not being monitored via SNMP):
Switch on inventory for the desired hosts
Roll out the inventory agent plug-in on these hosts
2.1. Activating the inventory for the desired hosts
Creating the rule
As always, if you want to configure something for specific hosts this is also possible with the help of a rule.
This rule set can be found under Setup > Hosts > HW/SW inventory rules > Do hardware/software inventory.
Of course it is even easier using the rule search with the word inventory.
Do not confuse this with the Hardware/Software-Inventory (Linux, Windows, Solaris, AIX) rule set which is for the agent plug-in, as we’ll see later.
In the Do hardware/software inventory rule set, some rules that refer to host labels are already active by default. If the hosts you want have such a label, the service for HW/SW inventory is already set up. If not, you need to create a new rule.
Use ![]() Add rule to create a new rule for the hosts for which you want to activate the inventory.
There you will find several settings:
Add rule to create a new rule for the hosts for which you want to activate the inventory.
There you will find several settings:

For now simply leave everything as preset. The various options that you will see here are discussed below.
At the next activation of changes the rule you have just created will, for each host, generate an active check that collects all of the inventory data for that host — be it from the data that is received from a normal Checkmk agent, or through additional SNMP queries. The new service Check_MK HW/SW Inventory can be found on the hosts in the service list, and it will look something like this:

Please do not be concerned that the check found only a few items — this is because we have not rolled out the plug-in yet.
Defining the interval
Inventory data is something that rarely changes, and recognizing a change is usually not time-critical anyway. Because of this it makes sense to use an adjusted interval during which the inventory check is performed rather than simply using the usual one-minute interval — mainly because the processing of the inventory data in the active check requires significantly more computing time than that for a normal service.
Checkmk sites as standard have a rule in the Setup > Service monitoring rules > Service Checks > Normal check interval for service checks rule set which sets the interval to one day for all services with the name Check_MK HW/SW Inventory:

Of course if you find once a day insufficient, you can also customize this rule — e.g., to four or eight hours. Naturally there is also always the option of setting it differently using multiple rules for different hosts.
2.2. Rolling out the inventory agent plug-in on these hosts
The most important step is to install the agent plug-in for the inventory on the relevant hosts. You can do this either manually or with the Agent Bakery (only commercial editions).
Manual installation
For a manual installation you first need the plug-in. This can be found in the commercial editions via Setup > Agents > Windows, Linux, Solaris, AIX > Related page, and in the Raw Edition directly under Setup > Agents. In all editions, there you will find menu entries for the various operating systems. Depending on the operating system, use the following plug-in in the Plugins box:
| Operating system | Plug-in |
|---|---|
Windows |
|
Linux |
|
AIX |
|
Solaris |
|
You can also find these files on the command line in the Checkmk site in the
share/check_mk/agents/plugins (Linux/Unix) subdirectory, or in share/check_mk/agents/windows/plugins (Windows).
Copy the plug-in to the destination hosts in the correct directory for plug-ins.
For the Windows agent it is C:\ProgramData\checkmk\agent\plugins.
For details see the Windows agent article.
For Linux and Unix the directory is /usr/lib/check_mk_agent/plugins.
Please make sure that the file is executable (chmod +x).
For details see the Linux agent articles.
The important thing is that the agent is called by Checkmk, usually once a minute. The inventory agent plug-in, however, requires more processing time than normal plug-ins because, for example, it must search for installed software in many directories. It also generates significantly larger amounts of data. This is why it has been designed to only generate and deliver new data every four hours (14400 seconds).
So if for some important reason you have specified a shorter interval than four hours for your inventory check, you will only actually get new data every four hours. If you really want to collect more data, in such a case you will need to alter the default calculation interval.
For Windows replace the number directly in the plug-in file.
Search for the number 14400 and replace it with a different number of seconds.
The location where this is found looks like this (detail):
Dim delay
Dim exePaths
Dim regPaths

'These three lines are set in the agent bakery
delay = 14400
exePaths = Array("")
regPaths =
Array("Software\Microsoft\Windows\CurrentVersion\Uninstall","Software\Wow6432Node\Microsoft\Windows\CurrentVersion\Uninstall")
With Linux and Unix this works a bit differently.
For this purpose create a configuration file /etc/check_mk/mk_inventory.cfg with the following line (here in the example with 7200 seconds):
INVENTORY_INTERVAL=7200One more note: The inventory agent plug-in itself dictates that it runs only every four hours. Therefore do not use the mechanism from the agent for asynchronously running plug-ins at longer intervals. Install the plug-in in the simple, usual way for direct execution.
Configuration using the Agent Bakery
Of course if you use the Agent Bakery in the commercial editions to configure your agents, things are much more straightforward.
There is only one rule set named Hardware/Software-Inventory (Linux, Windows, Solaris, AIX) independent of the operating system.
This rule set controls the rolling-out of the necessary plug-in as well as its configuration.
It can be found at Setup > Agents > Windows, Linux, Solaris, AIX > Agents > Agent rules:
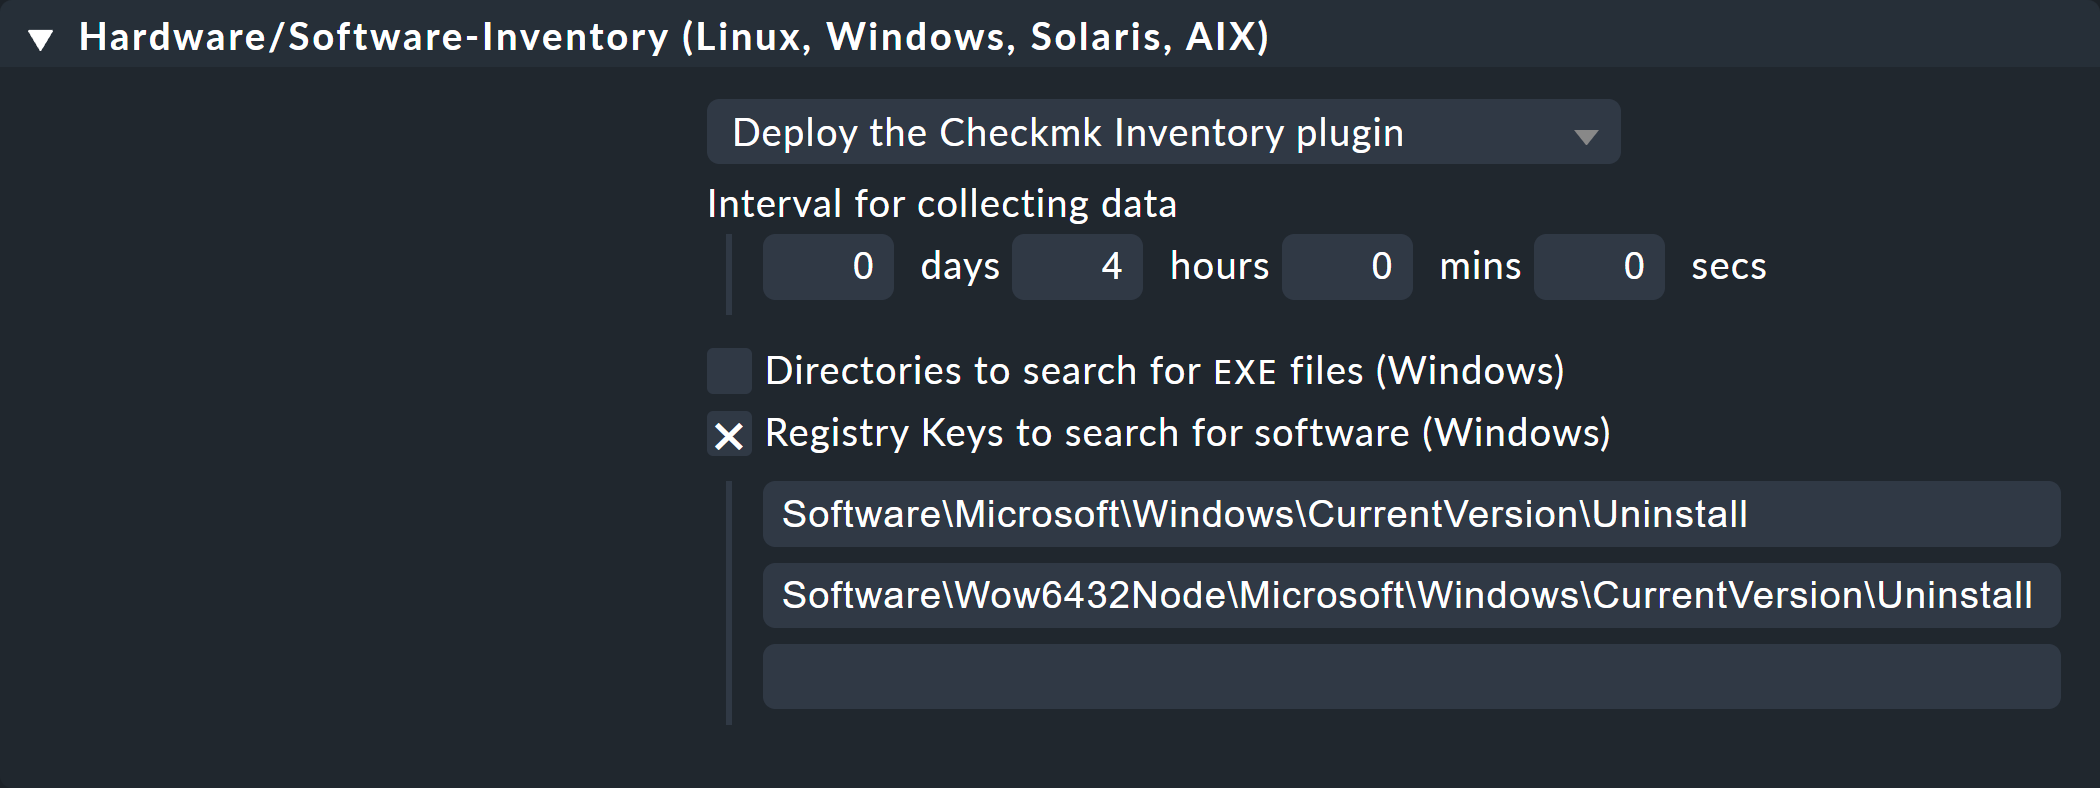
For Windows, in addition to the interval you can also specify paths in which to search for executable .EXE files when it comes to finding the software installed on the system.
You can also configure the paths in the Windows registry, which should be taken into account as an indicator for installed software.
2.3. Testing
If you have rolled out the plug-in correctly, you should find significantly more records the next time you run the host’s inventory check. The result will then look like this:

3. Working with the inventory data
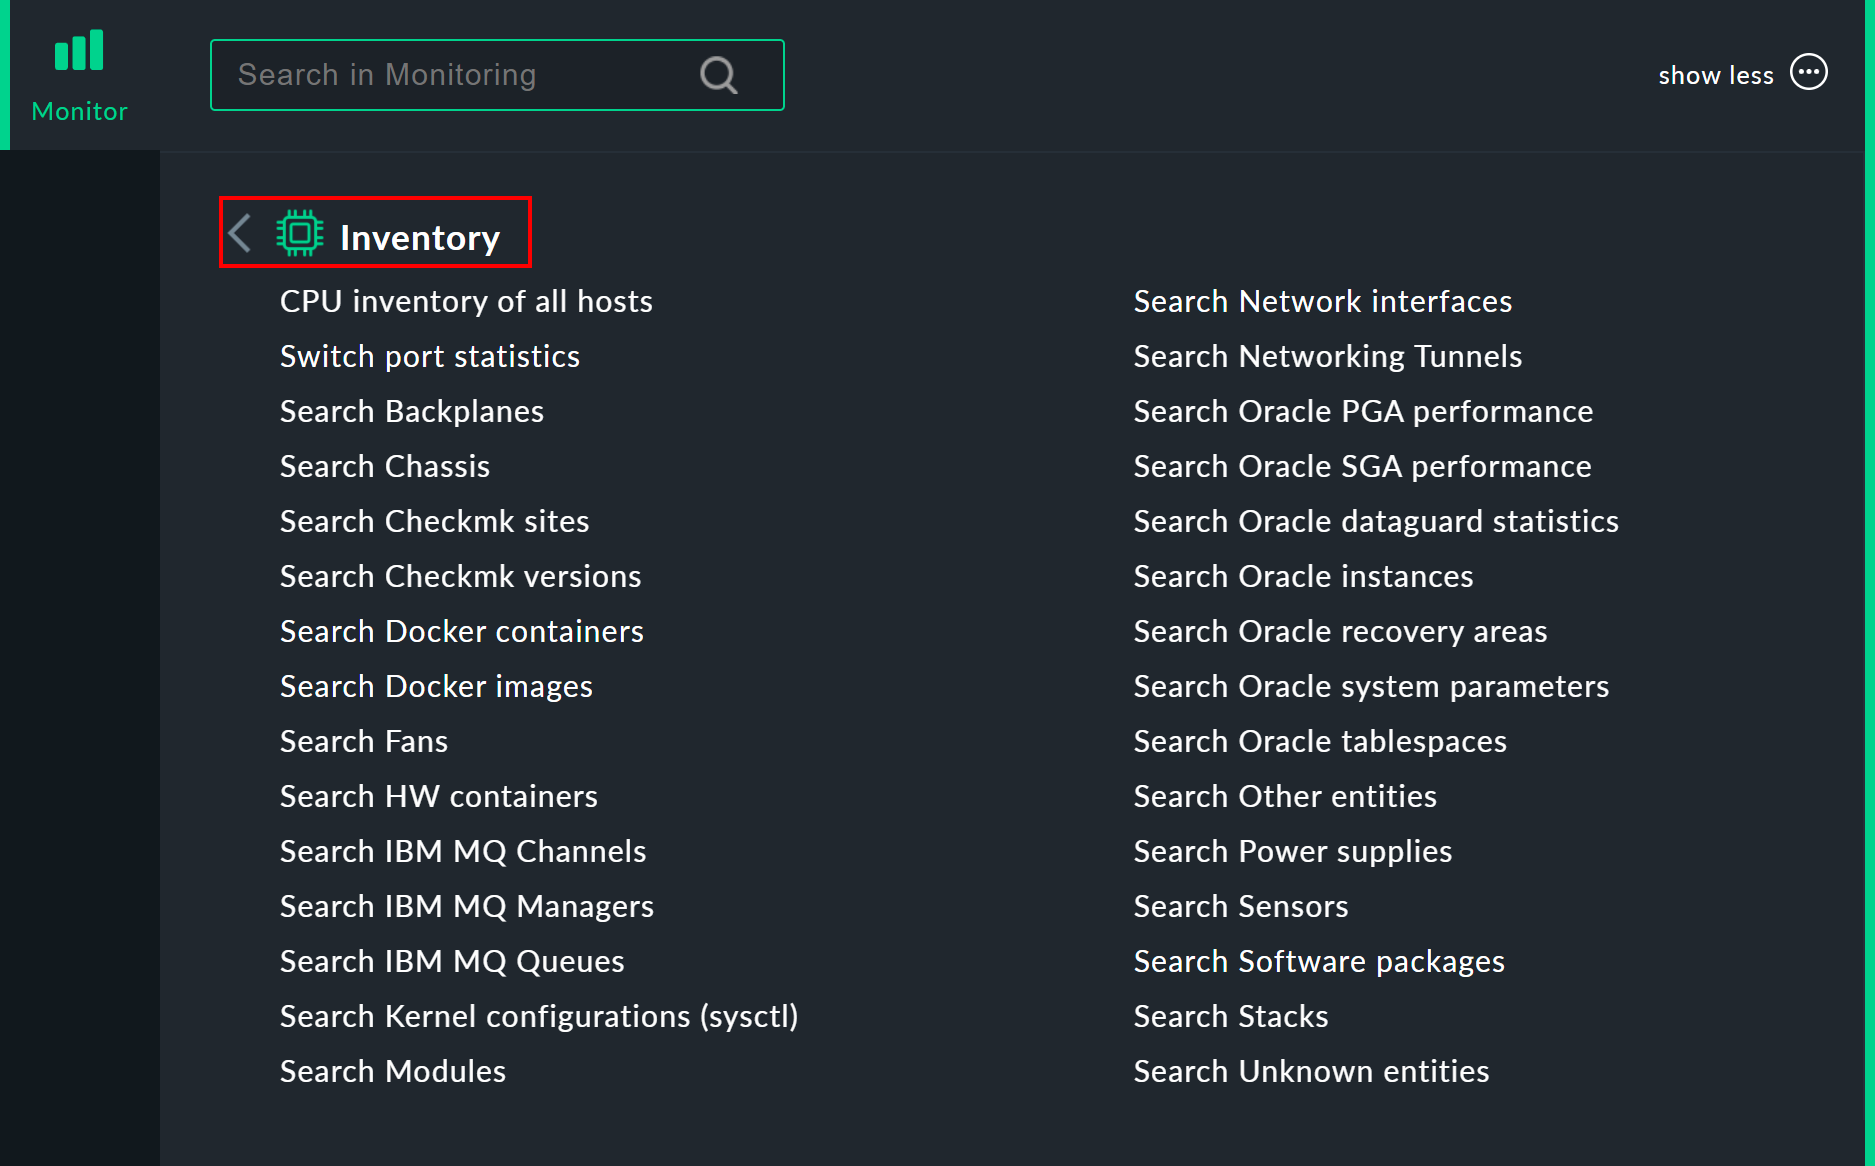
Inventory data is of course available for each individual host, partly as a tree and partly as a table representation. How exactly these work and how you can access them is shown below. However, there are also views, especially searches, that affect your entire host landscape. You can access these via the Inventory entry in the Monitor menu:
3.1. Tree-structured display
The hosts’ inventory data is displayed on the one hand in a tree-structured display per host, and on the other hand in table-form. You can open the tree diagram, for example, in a host view via the menu item Host > Inventory > Inventory of host.
Alternatively, in views that list hosts, you can invoke the ![]() menu of a host and in turn invoke the
menu of a host and in turn invoke the ![]() inventory from it:
inventory from it:

In both cases you end up with the tree view of the host’s inventory data.
Starting from the three basic categories ![]() Hardware,
Hardware, ![]() Networking and
Networking and ![]() Software, you can expand and collapse the tree’s sub-branches:
Software, you can expand and collapse the tree’s sub-branches:

In the image above you can see behind the individual entries the inventory paths in brackets, which you can display using Display > Modify display options and the Show internal tree paths option:

You will then see the internal designations in the inventory, so for example the internal path for the Processor section is called hardware.cpu.
The designations for the CPU model and architecture — model and arch — can be found below in the CPU data.
You can use these internal designations to enable only individual paths for contact groups.
Users of a contact group assigned only the hardware.cpu, model and arch entries shown above will then see only a trimmed-down inventory:

3.2. Tabular displays
Many of the inventory data are individual values under very specific paths in the tree, e.g. the Hardware > System > Manufacturer > Apple Inc. entry.
But there are also places in the tree with tables of similar objects.
A very important one is, for instance, the ![]() Software >
Software > ![]() Packages table:
Packages table:
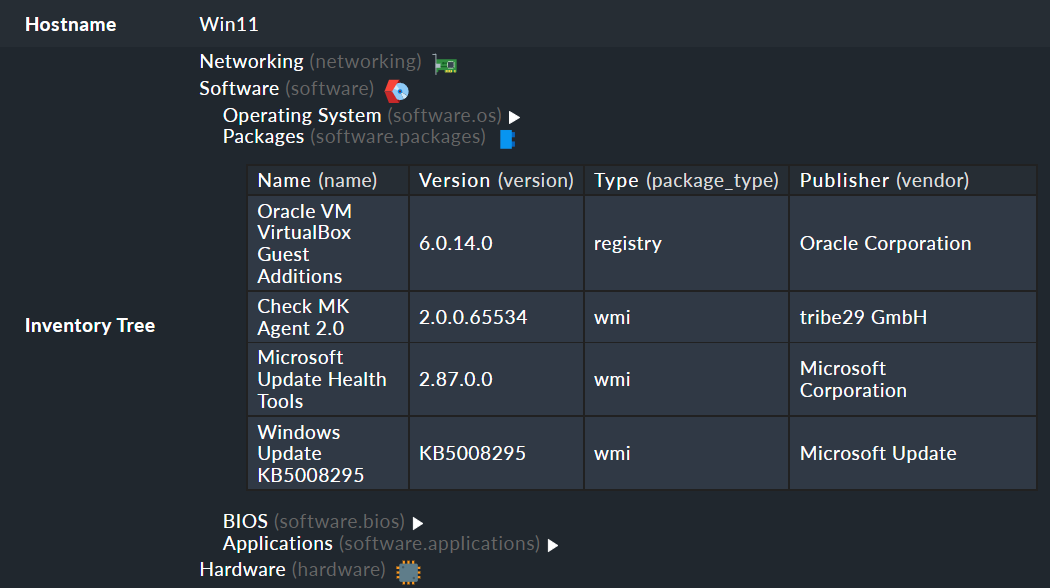
The special thing about this part of the inventory data is that you can call the packages in a separate view via Host > Inventory > Software packages.
There you will then find ![]() filters specifically for searching in packages (heavily shortened in the image):
filters specifically for searching in packages (heavily shortened in the image):
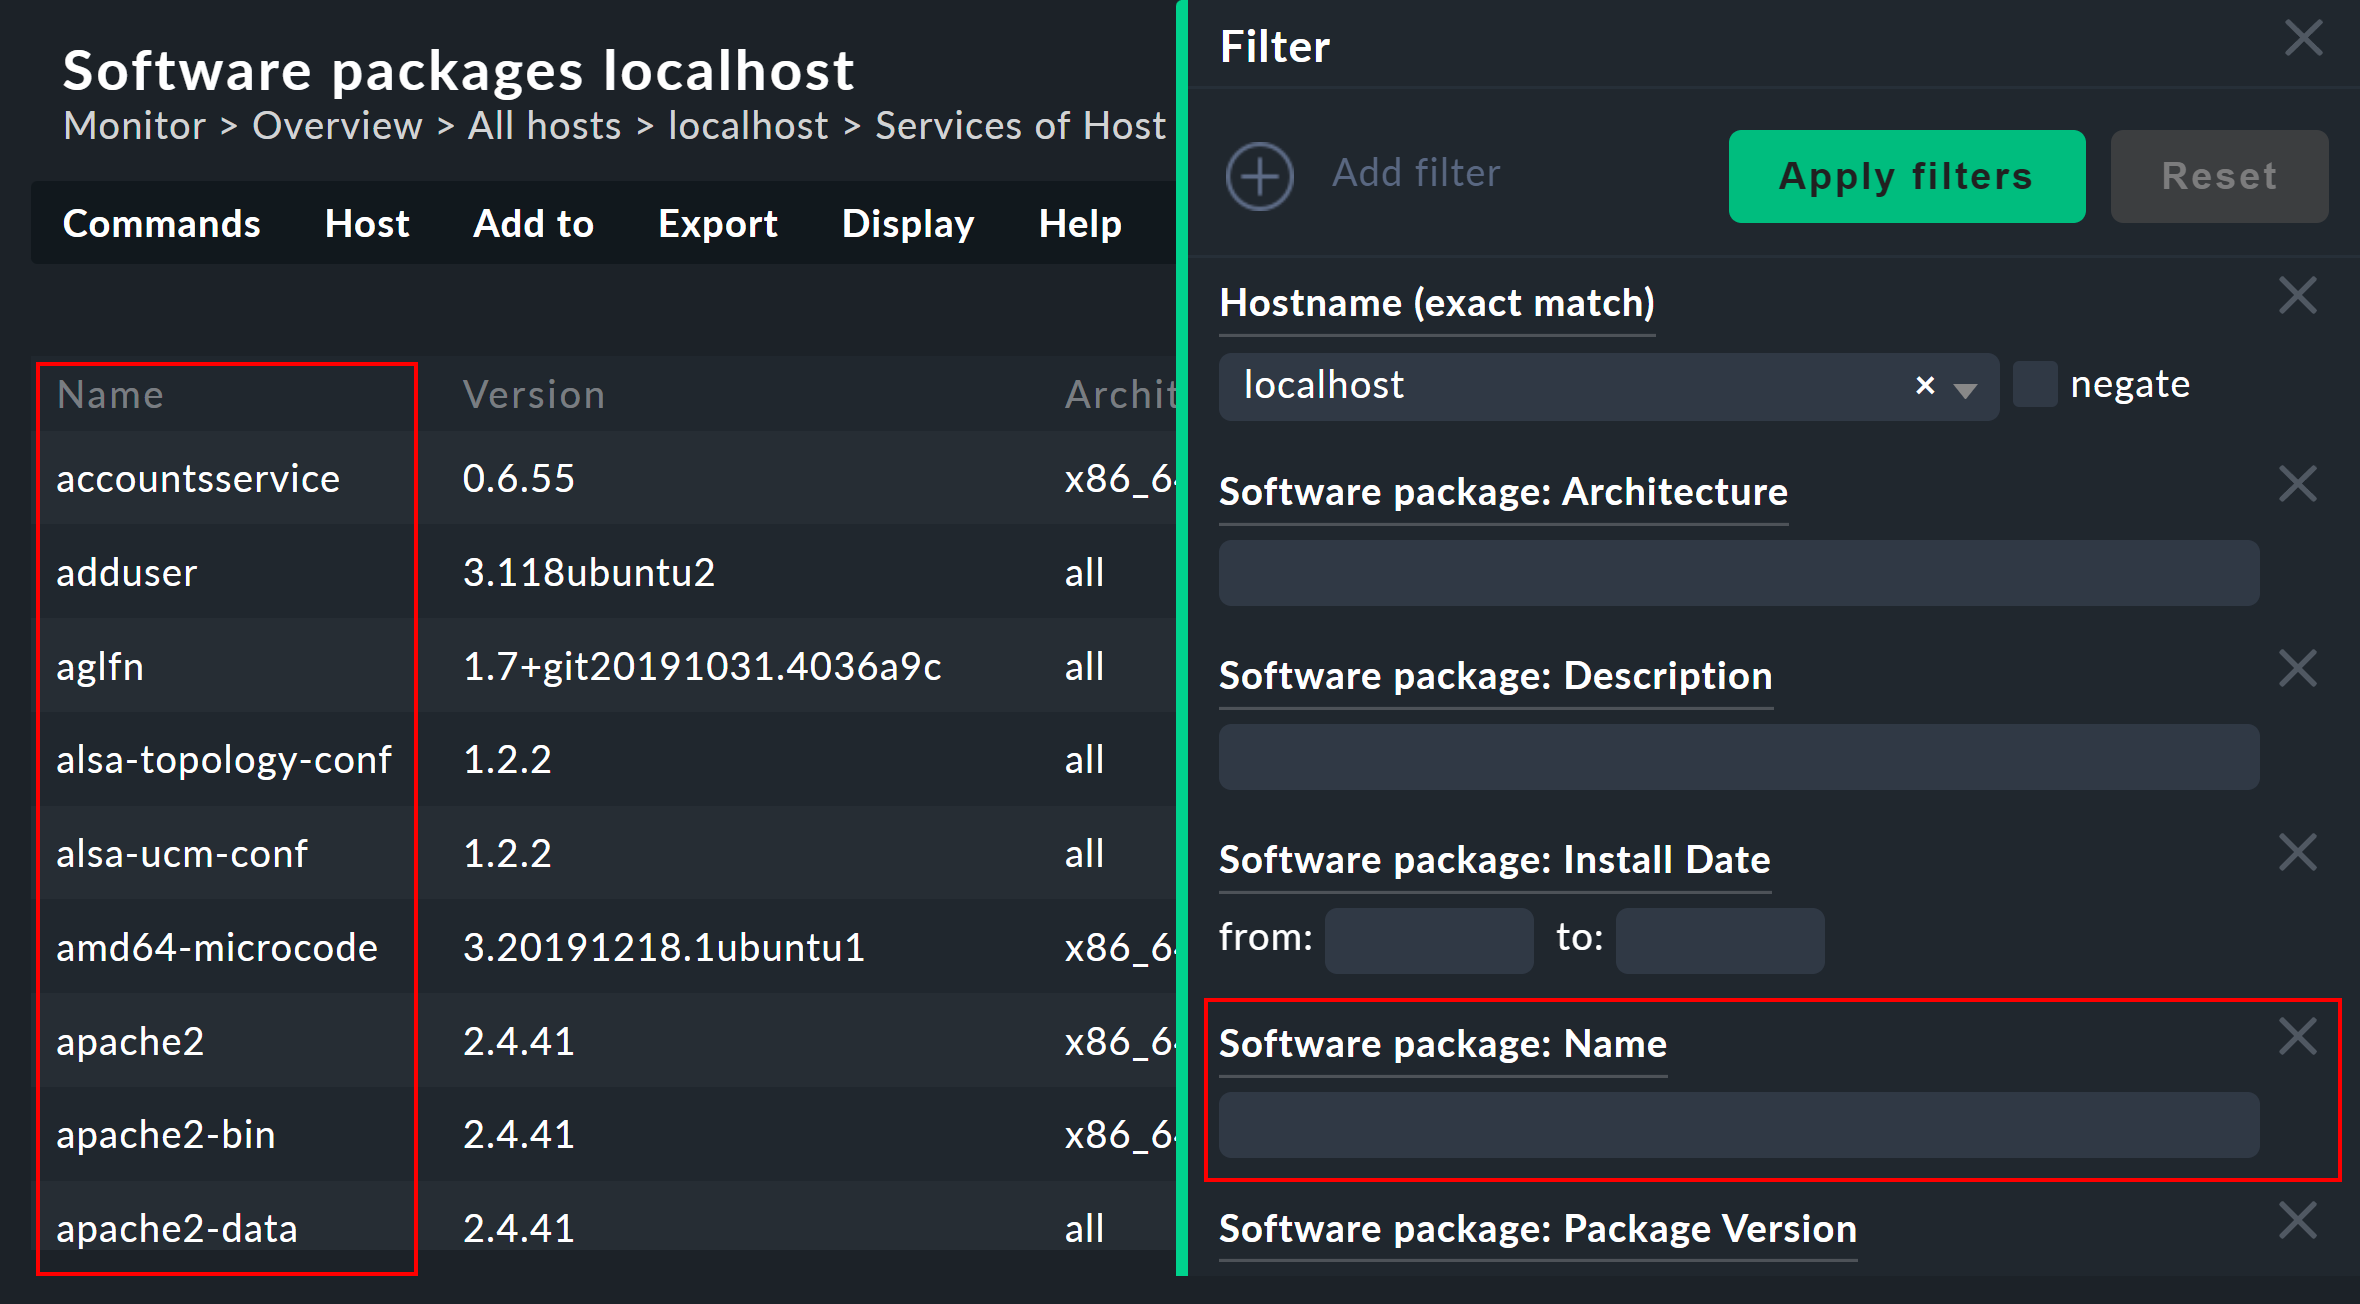
You can also search in software packages on multiple hosts. The corresponding view can be found in the Monitor menu under Monitor > Inventory > Search Software packages or in the Views snap-in of the sidebar under Inventory. All other table views for the inventory are also listed there, including further searches, for example for specific Oracle data.
Please note that many general filters to the hosts are not available by default in the views. These are obtained when you edit the view and add additional host filters.
Further things you can do with the views:
Include them in reports
Export them as PDF or as CSV
Integrate them with dashboards
Incidentally, you can also include such inventory data in views that are not table-like. There is a column type for each well-known path in the inventory tree, which you can add to views of hosts. An example of this is the predefined example view CPU inventory of all hosts. This is a table of hosts that displays additional data from the inventory per host. Here is an example of one of the column definitions that adds a column to the table of the number of physical CPUs in the host:

4. Inventory data history
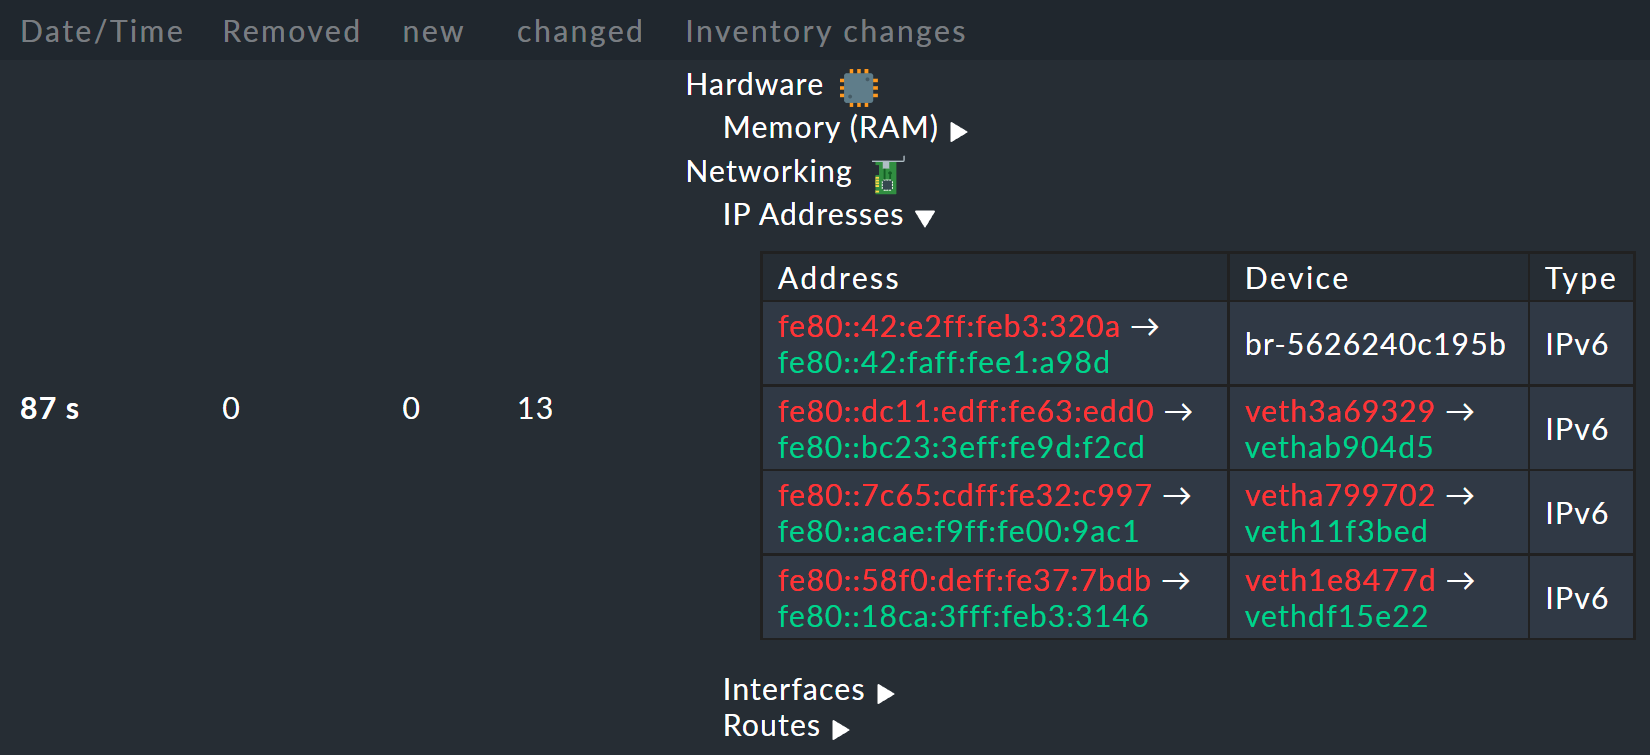
Once you have set up the HW/SW inventory for a host, Checkmk will record every change in the inventory data and also store its history. You can find these in views with inventory data via Host > Inventory > Inventory history of host.
Here is an excerpt from a history. In the table you can see some IP data that has changed since the last check:
If you wish, you can be informed whenever a change occurs in the software or hardware. This is done via the status of the service Check_MK HW/SW Inventory. To do this edit the rule that you created at the very beginning of this article (in the Do hardware/software inventory rule set). There, for the value of the rule you will find a number of settings that affect the history. The following example sets up the service WARN if changes occur in software or hardware:
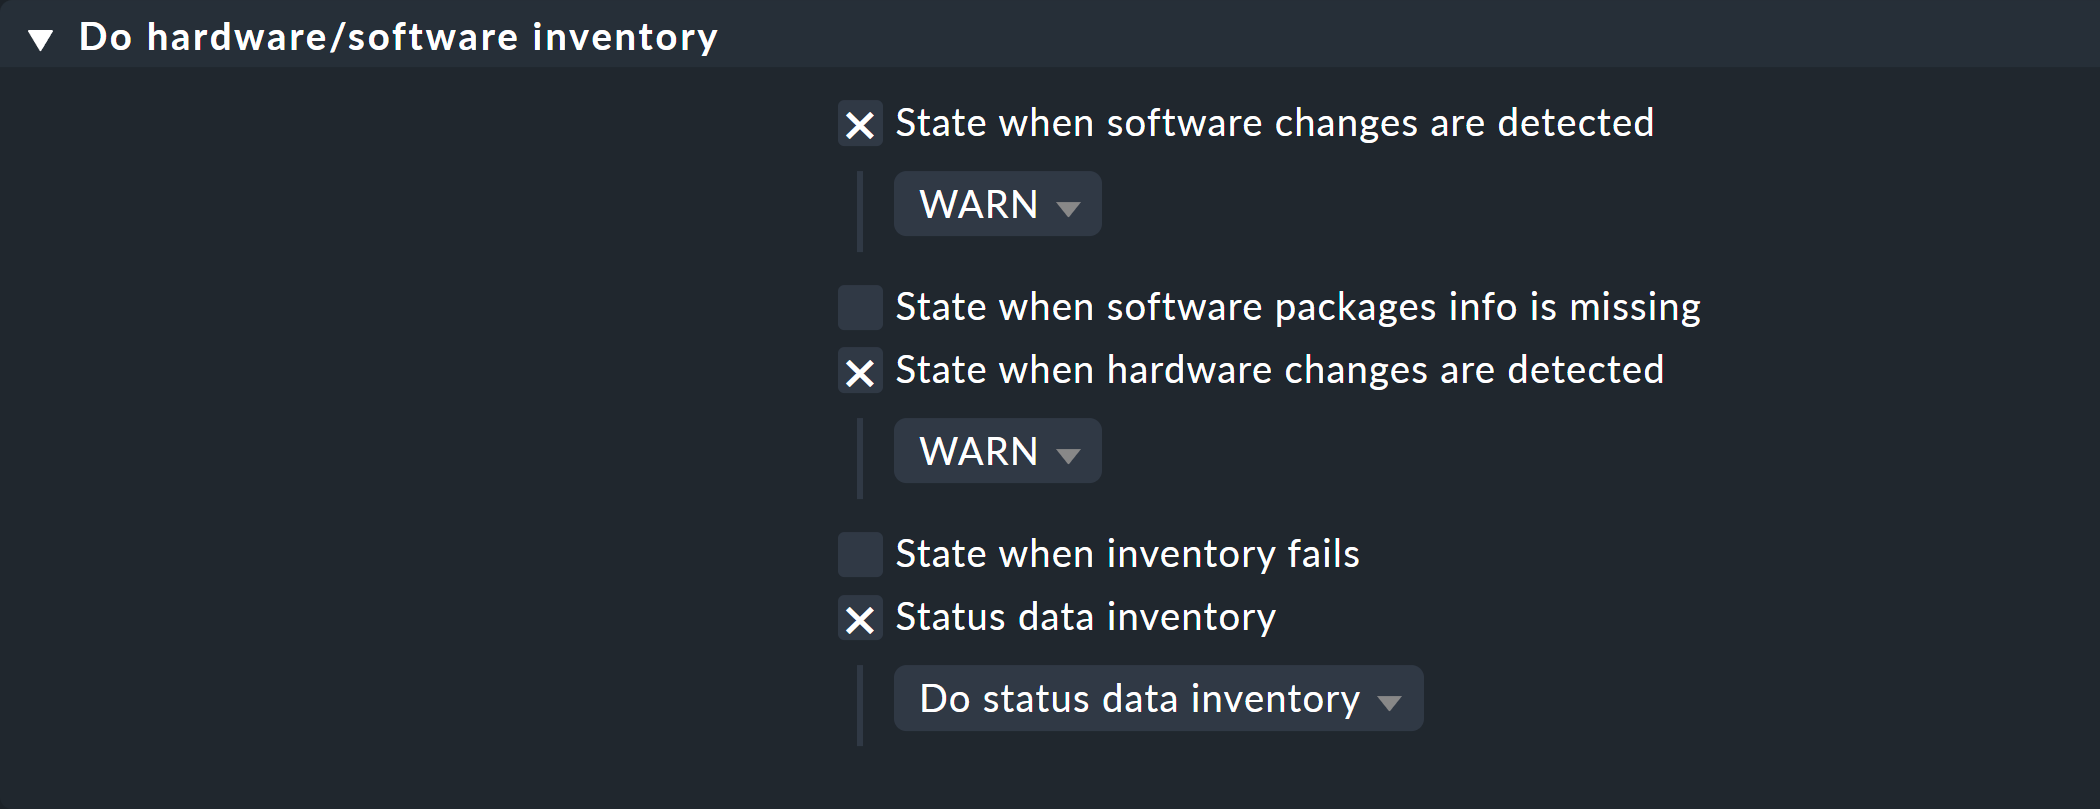
The next time the inventory check detects changes, it will go to WARN. It will then look like this:

At the next execution of the check, and if in the meantime nothing has changed, this resets automatically to OK. By manually triggering the execution you also have a way to manually reset the service to OK if you do not want to wait for the next normal periodic execution.
5. Status data
The tree of inventory data can be automatically updated with the latest suitable status data. This is very useful in some cases. An example of this is the Oracle tablespaces. The actual inventory data contains only relatively static info such as the SID, the name and the type. Current status data can supplement this with information on the current size, free space, etc.
If you want to see status data in your tree (and there’s nothing wrong with that), you only have to activate activate the corresponding option in the rule that you created at the beginning under Do hardware/software inventory:

By the way, a change in the status data will not precipitate changes in the history! This would almost always lead to constant changes and render this function useless. Status data are not stored in files, but like the results of checks are held directly in the main memory of the monitoring kernel.
6. External access to data
6.1. Access via own Web API
You can export a host’s HW/SW inventory data via an inventory’s own web API.
Note: The inventory own web API mentioned here is not the web API that was removed from Checkmk in version 2.2.0.
Its URL is:
http://myserver/mysite/check_mk/host_inv_api.py?host=myhost
The output format in this case is Python source code.
If you prefer JSON, then append a &output_format=json to the URL:
http://myserver/mysite/check_mk/host_inv_api.py?host=myhost&output_format=json
The result looks something like this in an abbreviated form:
result:
    Attributes: {}
    Nodes:
        hardware:
            Attributes: {}
            Nodes:
                memory:
                    Attributes:
                        Pairs:
                            total_ram_usable: 16495783936
                            total_swap: 1027600384
                            total_vmalloc: 35184372087808
                        Nodes: {}
                        Table: {}
                Table: {}
 ... usw. ...
result_code: 0
Similarly, you can also request the output in XML:
http://myserver/mysite/check_mk/host_inv_api.py?host=myhost&output_format=xml.
If you enter the respective URL in your browser’s address bar, you will immediately see a result since you are already logged in to Checkmk. The HW/SW inventory data can be found in the output file in the section after the result key. From a script, it is best to authenticate as automation user.
In the event of an error, e.g. if the specified host was not found, the result code is set to 1 and an appropriate error message is printed:
{"result": "Found no inventory data for this host.", "result_code": 1}
Querying multiple hosts
You can also query the HW/SW inventory data from multiple hosts in a single output. To do this, extend the query to all of the required hosts:
http://myserver/mysite/check_mk/host_inv_api.py?request={"hosts":["myhost","myhost2"]}&output_format=json
The result of this query will look almost exactly like the output above. However, at the top level, the hosts' names are used as keys. The information for the hosts then follows below in the directory trees:
result:
    myhost:
        Attributes: {}
        Nodes:
            hardware:
                Attributes: {}
                Nodes:
                    memory:
                        Attributes:
                            Pairs:
                                total_ram_usable: 16495783936
                                total_swap: 1027600384
                                total_vmalloc: 35184372087808
                            Nodes: {}
                            Table: {}
                    Table:
            networking:
                Attributes:
                    Pairs:
                        available_ethernet_ports: 1
                        hostname: "MyServer"
                        total_ethernet_ports: 3
                        total_interfaces: 4
... etc. ...
    myhost2:
        Attributes: {}
        Nodes: {}
        Table: {}
result_code: 0
If no inventory data is found for a host, that host will have an empty inventory entry instead of the error message.
Restricting the query to specific data
You may not want to query all inventory data, but only search for specific information. If that is the case, specify so-called inventory paths to target the information you want. You will then only receive information from those hosts that have these paths / information.
For example, to see only the total storage and swap space information for the host myhost, use this URL:
http://myserver/mysite/check_mk/host_inv_api.py?host=myhost&request={"paths":[".hardware.memory.total_ram_usable",".hardware.memory.total_swap"]}&output_format=json
You will receive the requested information back:
result:
    Attributes: {}
    Nodes:
        hardware:
            Attributes: {}
            Nodes:
                memory:
                    Attributes:
                        Pairs:
                            total_ram_usable: 16495783936
                            total_swap: 1027600384
                        Nodes: {}
                        Table: {}
                Table: {}
        Table: {}
result_code: 0
6.2. Access via a file
Alternatively, you can simply read the files that Checkmk generates itself.
These are in Python format in the ~/var/check_mk/inventory directory.
For each host there is one file in an uncompressed (e.g. myhost) and one in a compressed variant (e.g. myhost.gz).
7. Inventory in distributed environments
In the commercial editions HW/SW Inventory also works in distributed environments.
Here the inventory data are first determined by the local sites and stored locally under
~/var/check_mk/inventory.
The Livestatus proxy daemon will periodically transfer all updated inventory data from the remote site to the central site, and also store it under ~/var/check_mk/inventory.
This is important because this data is too large to pick up live when queried at this moment.
As soon as the central site makes queries about inventory data, these files are read and then merged with current status data, which is then retrieved from the remote sites via Livestatus.
In short — you do not have to worry about anything.
There is no Livestatus proxy in the Raw Edition — therefore the HW/SW inventory is incomplete in the central site’s GUI and shows only the status data.
You can aid yourself by transferring the files in the
~/var/check_mk/inventory directory to the central site regularly with a script or similar.
It is sufficient to copy the files without the .gz file extension.
For efficient data transmission rsync, for example, is suitable.
8. Files and directories
8.1. Directories on the Checkmk server
| Path | Description |
|---|---|
|
Agent plug-ins for Linux and Unix |
|
Agent plug-ins for Windows |
|
Inventory data from individual hosts as Python files (compressed and uncompressed) |
8.2. Directories on the monitored hosts
| Path | Description |
|---|---|
|
Storage location for the Windows agent’s inventory plug-in |
|
Storage location for the inventory plug-in for the Linux/Unix agent |
|
Configuration for the inventory plug-in for the Linux/Unix agent |
