1. The basics of file monitoring
With Checkmk you can monitor files for number, size and age, individually or in groups. This function can be used in many different ways, such as monitoring the success of backup strategies for example: Are any of the backups older than X days? Is one of the backups suspiciously large or small? You can also check company-wide file servers to see if users are misusing them as private storage for movies, or keep an eye on classic swap files or volatile files like containers.
The basic procedure is in accordance with the Checkmk standard: A plug-in/configuration is installed in the agent which brings the desired information on files or file groups into the monitoring. There, corresponding rule sets are used to determine which properties lead to which statuses.
The actual filtering, i.e. determining which data actually ends up in the monitoring, takes place in the agent.
You can use globbing patterns to recursively include files from entire directories, for example, or only certain file types or even individual files.
Using globbing patterns such as /myfiles/*.*, you may end up with enormously large file lists, even though you may only be interested in particularly old or large files.
Due to this fact, there are currently two agent and associated monitoring rule sets:
The older fileinfo is already built into the agent and filters only by globbing pattern/path, the newer mk_filestats must be installed separately as a plug-in and filters by other properties.
There are other differences between mk_filestats and fileinfo, which we will explain below. The most important difference, however, is that mk_filestats can only monitor Linux hosts, while fileinfo can also monitor Windows hosts. For Linux hosts, you should usually use the more up-to-date mk_filestats.
2. The differences between mk_filestats and fileinfo
If you want to see the rule sets for the two variants side by side for the sake of clarity, simply type size age in the Setup menu.
The rules for individual files and groups are named (largely) identically, but the mk_filestats rules are explicitly identified as such.
Both variants of service rules are additionally available as enforced services.
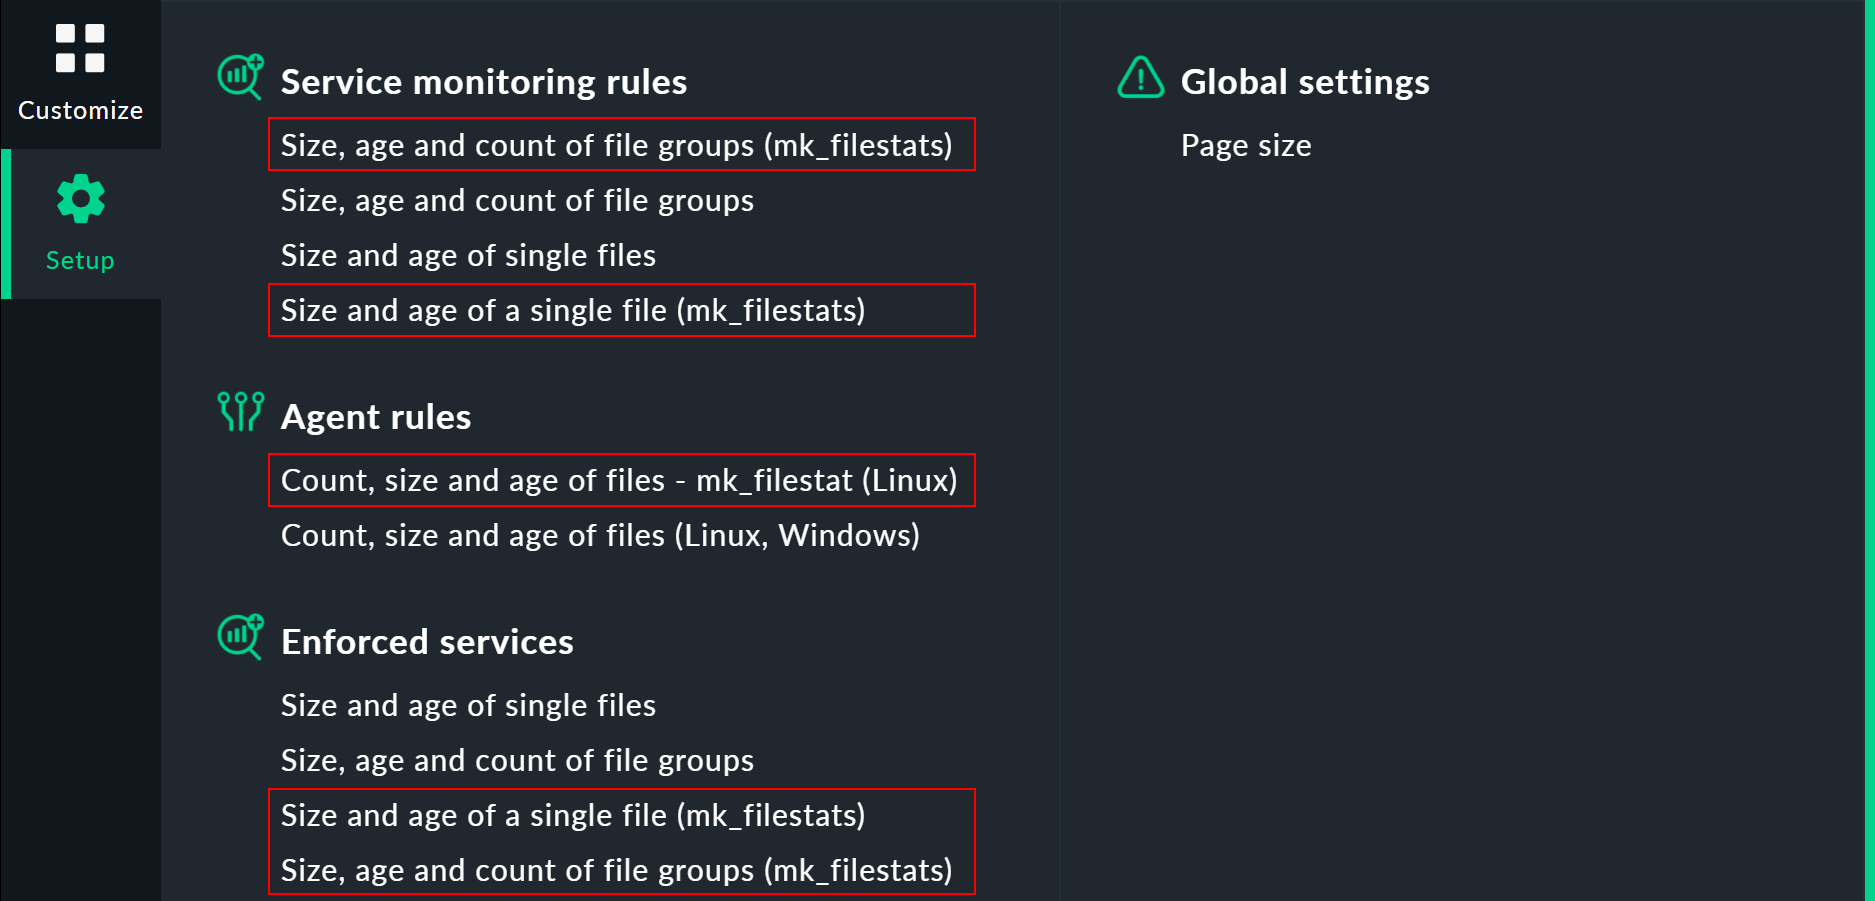
Differences between the two variants exist at the agent and service levels. To begin with, here are the basic theoretical differences. You will find specific details later in the instructions for the mk_filestats agent plug-in as well as for the agent’s fileinfo.
In the case of the agent, mk_filestats is distinguished by two options that fileinfo lacks:
Firstly, mk_filestats offers the additional filtering options already mentioned, namely by file size, number and name, the latter in the form regular expressions.
For example, with a /myfiles/* globbing pattern, you could bring only those files into monitoring that are larger than 1 KB and contain backup somewhere in the filename.
On the other hand, with mk_filestats, file groups are also specified directly in the plug-in configuration, simply by creating multiple filters, each of which then ends up as its own section in the agent output and which can later be addressed by rules via the section header.
For service monitoring rules, the approaches used by mk_filestats and fileinfo differ more in their details. Both can restrict evaluations to specific time periods, but only fileinfo allows explicit specification of time windows per day directly in the rule. Also exclusively, fileinfo can configure so-called conjunctions for file groups. This associates a set of conditions for each status, so for example: "The status goes to CRIT as soon as the oldest file in the group is exactly 5 hours old and the smallest file is exactly 8 megabytes." In turn, for file groups, mk_filestats provides the option to define outliers: Suppose a file group is supposed to go to CRIT as soon as the group size exceeds 2 gigabytes. However, if the group should not go to CRIT when a certain single file alone exceeds 1 gigabyte (such as a temporary file), you can define this as a special case, overriding the group rule on a case-by-case basis.
An overview of the differences:
| Feature | mk_filestats | fileinfo |
|---|---|---|
Supported operating systems |
Linux |
Linux and Windows |
Agent |
Agent plug-in |
Included in agent |
Filter |
Filters directly in the agent for globbing patterns and properties |
Filters in the agent only for globbing patterns |
File lists |
Delivers lean file lists |
Delivers sometimes verbose file lists |
File grouping |
Groups directly in the agent |
Groups via a separate monitoring rule set |
Display files |
Show files in service details optionally |
Always show files in service details |
File evaluation |
Can consider outliers in files |
Can consider relationships between files |
In the following chapters you will see the two functions individually in practical examples — the differences and features described should then become clearer.
mk_filestats itself also provides detailed information via the call filestats.py --help.
3. Monitoring files with mk_filestats (Linux)
The following example shows the procedure for groups of files.
For individual files the procedure is identical, there are simply fewer options.
Suppose you want to monitor a group of a certain number of backup files (mybackup_01.zip etc.) and these files should not fall below a minimum size, then you can proceed as follows:
3.1. Configuring the rule for the agent plug-in
Configuration via the Agent Bakery
In the commercial editions, first call the rule for the agent plug-in Setup > Agents > Windows, Linux, Solaris, AIX > Agent rules > Count, size and age of files - mk_filestats (Linux).
Under Section name you assign an arbitrary name, which appears later in the agent output as an independent section.
Under Globbing pattern for input files you then specify which files are to be monitored. You can use globbing patterns, i.e. ultimately file path specifications with placeholders. At this point, we want to use an absolute path specification that includes all files in the specified folder.
Further filtering is done by the next two options: Filter files by matching regular expression includes files according to a specified template, in this example files with my somewhere in their names, and
Filter files by not matching regular expression which then excludes files, here those ending in tmp.
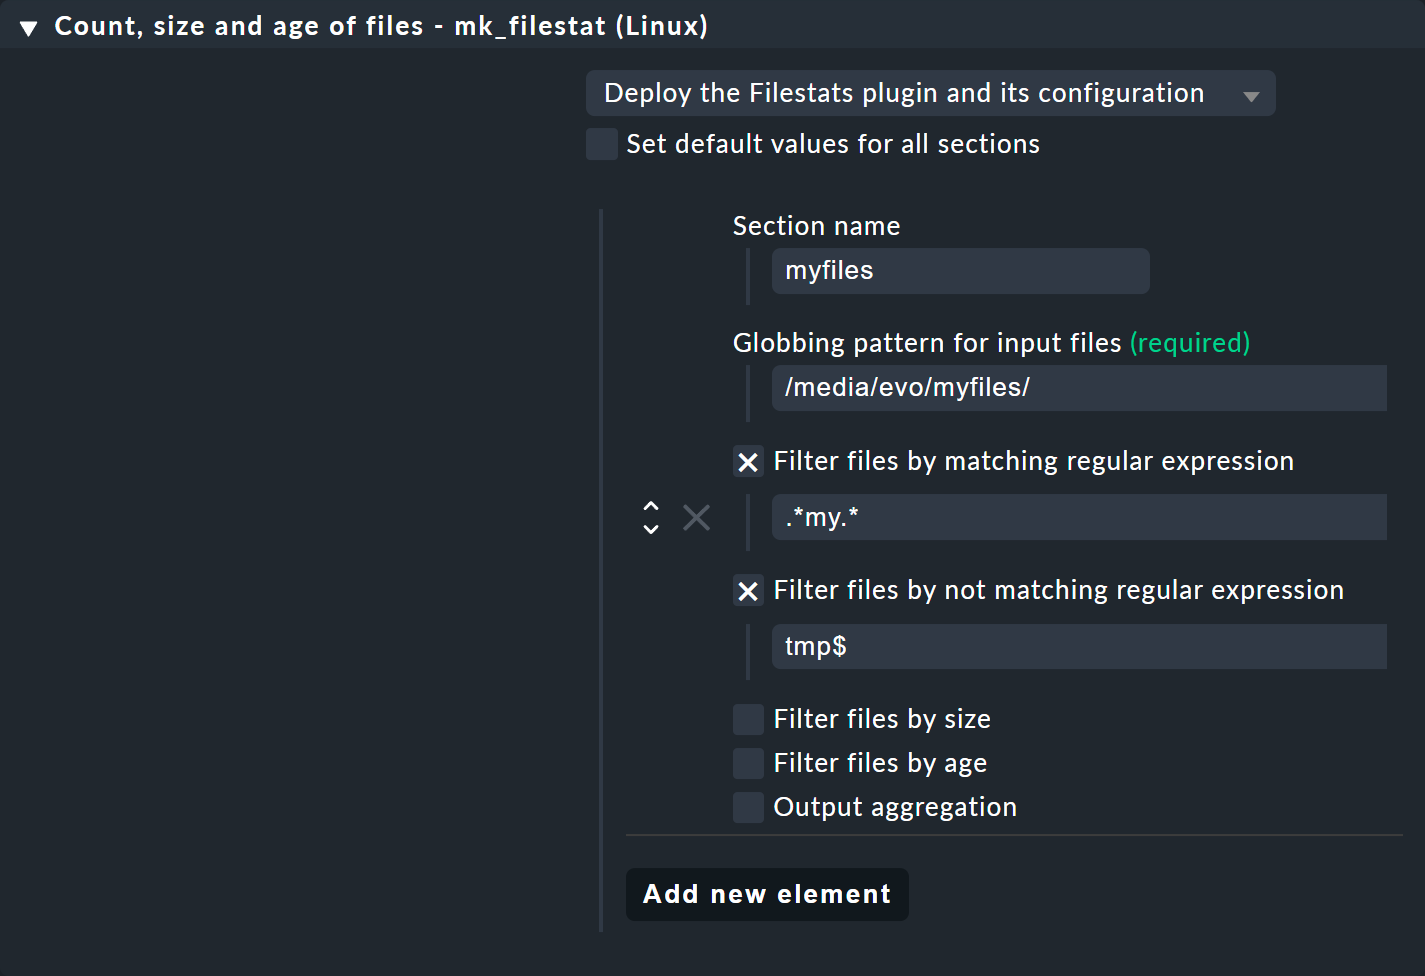
This completes the configuration and you can distribute the plug-in including its configuration via the Agent Bakery.
Manual configuration
In the
![]() Checkmk Raw Edition you configure the plug-in as usual using a text file:
as the site user you can find an sample configuration in the
Checkmk Raw Edition you configure the plug-in as usual using a text file:
as the site user you can find an sample configuration in the share/check_mk/agents/cfg_examples/filestats.cfg file.
A configuration according to the above specifications then looks like this:
[myfiles]
input_patterns: /media/evo/myfiles/
filter_regex: .*my.*
filter_regex_inverse: tmp$
This completes the configuration and you can install the agent plug-in manually.
Data in the agent output
You will then find the result from your configuration in the form of raw data in the agent output:
<<<filestats:sep(0)>>>
[[[file_stats myfiles]]]
{'type': 'file', 'path': '/media/evo/myfiles/mybackup_01.zip', 'stat_status': 'ok', 'size': 13146562, 'age': 339080, 'mtime': 1633966263}
{'type': 'file', 'path': '/media/evo/myfiles/mybackup_02.zip', 'stat_status': 'ok', 'size': 13145766, 'age': 325141, 'mtime': 1633980202}
{'type': 'file', 'path': '/media/evo/myfiles/mybackup_03.zip', 'stat_status': 'ok', 'size': 13151050, 'age': 325352, 'mtime': 1633979991}
...
3.2. Service rule configuration
The monitoring now has access to the file data via the agent. For evaluation, call the rule Setup > Services > Service monitoring rules > Size, age and count of file groups (mk_filestats). In our example, we want to be warned as soon as a specified number of files is exceeded or not reached. This is done by the options Minimal file count and Maximal file count, which are used to set upper and lower limits. All other minimum-maximum options work analogously.
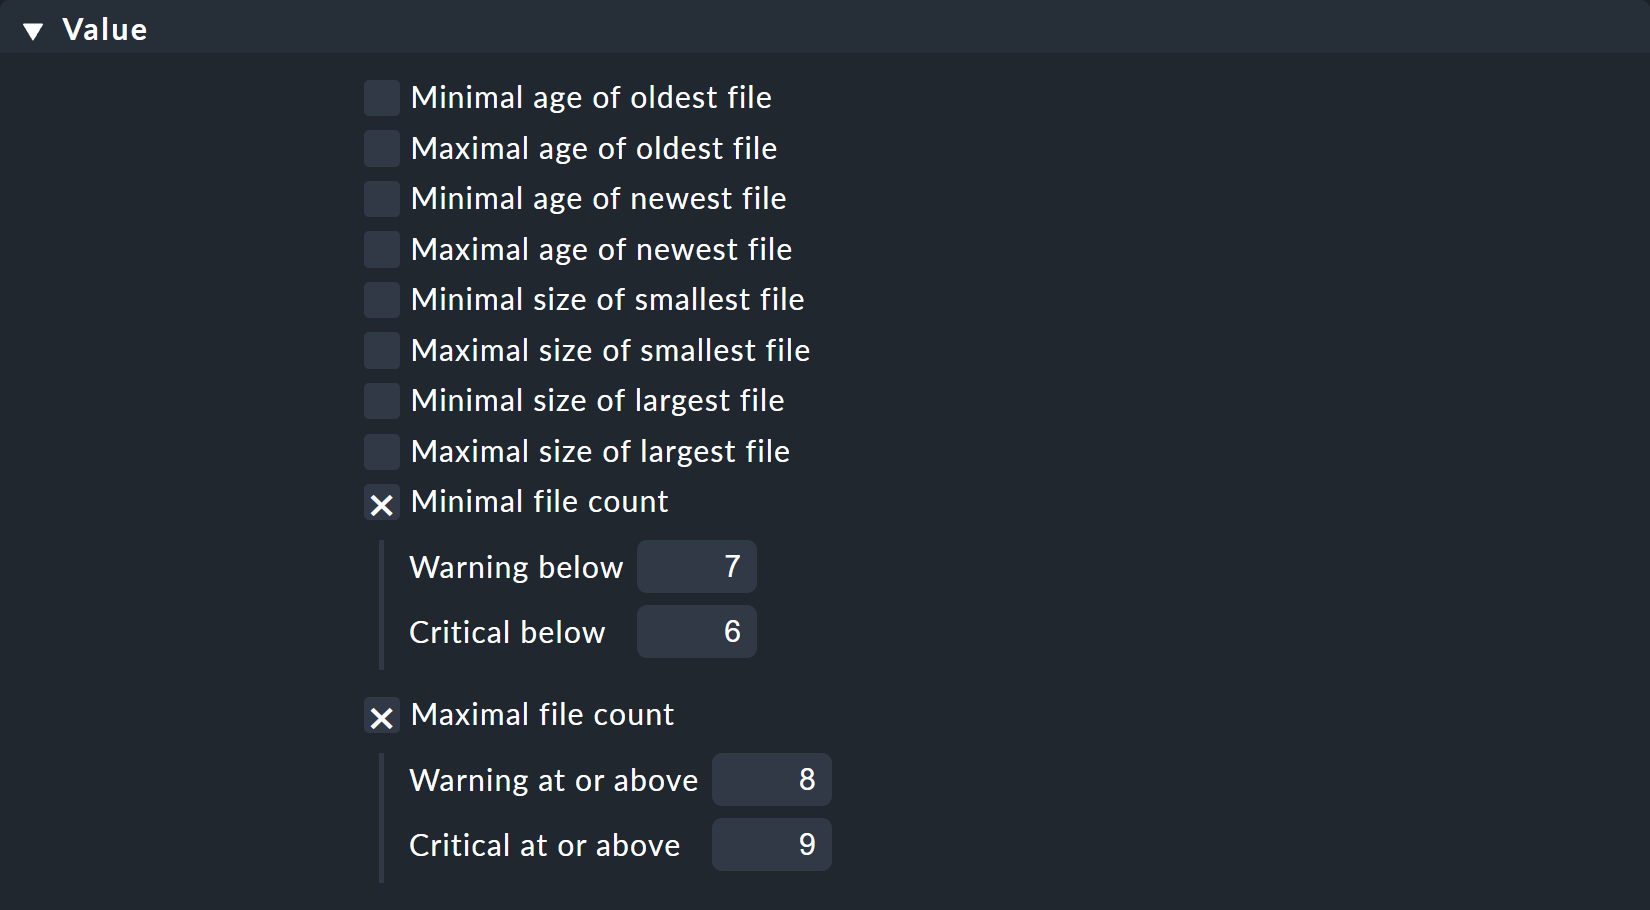
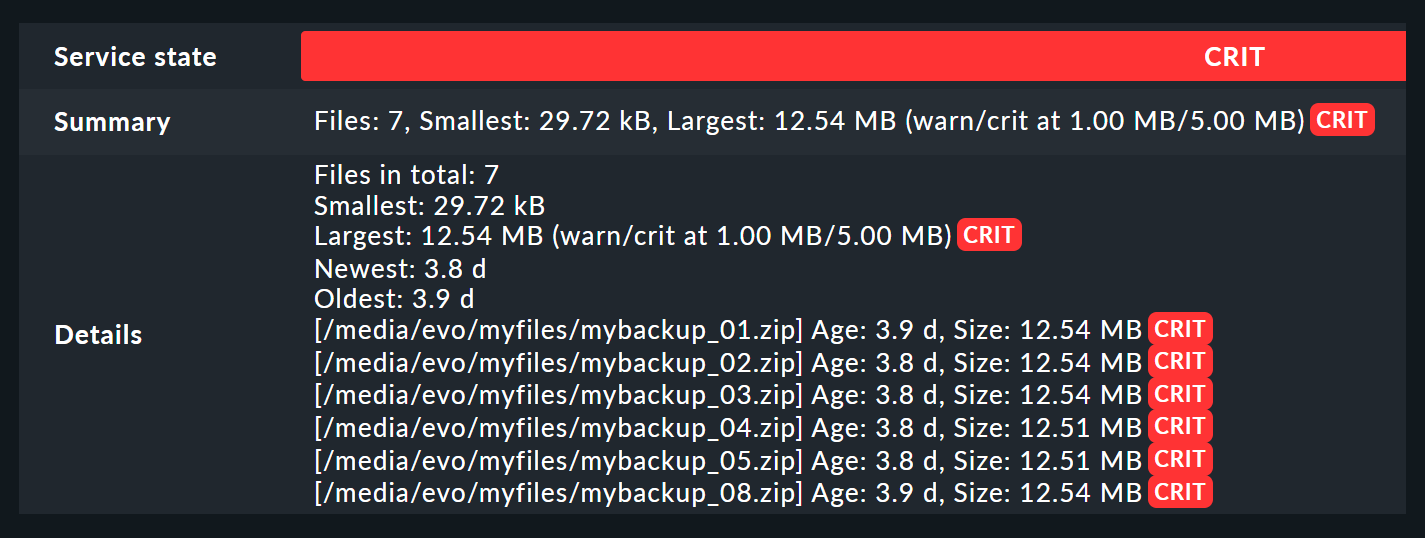
But which file then generates, for example, a CRIT status? The option Show files in service details helps here: If this is enabled, you will see all affected files listed in the service details view.

Now it could be that the correct number of files is present, but there are also outliers with respect to their sizes, for example. For such exceptions you can use the option Additional rules for outliers: This specifies, for example, that for files below 5 megabytes the status WARN is set, below 1 megabyte the service goes to CRIT. This can be useful for being notified of possibly defective backups for instance.
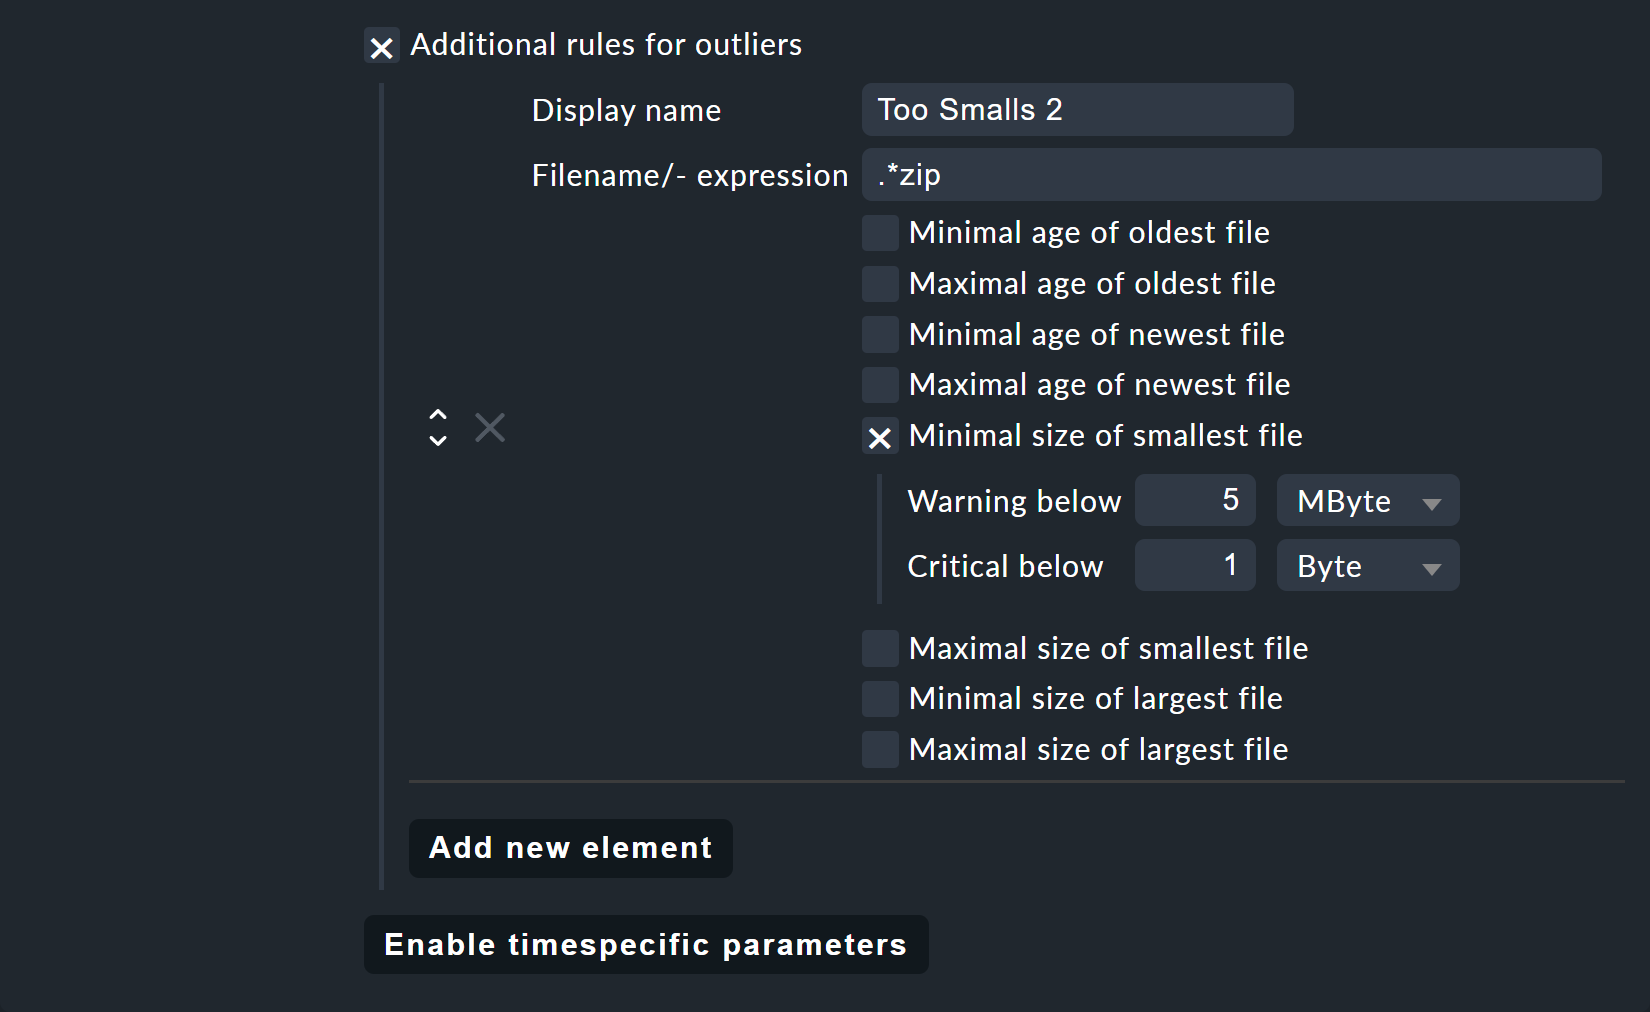
In the Conditions box, you can now specify that the rule should apply exclusively to the myfiles file group configured in the agent plug-in:
To do this, enter the name you assigned in the agent plug-in under Section name as File Group Name.
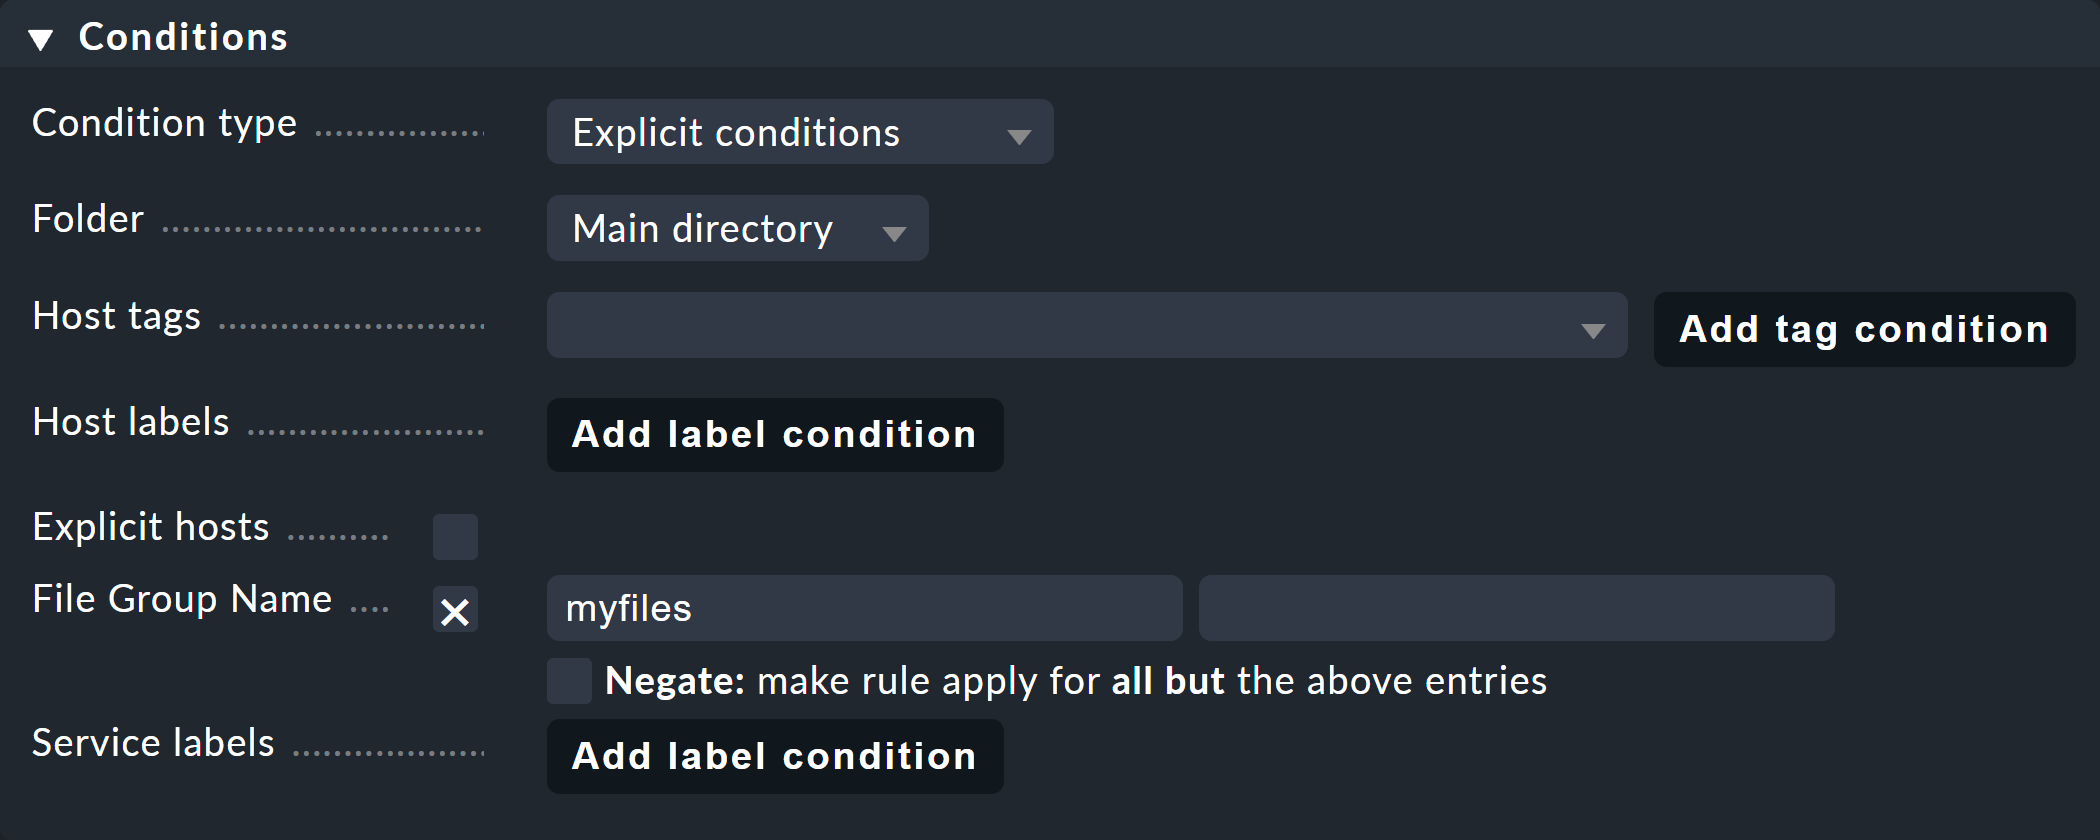
This also completes the service rule. You could also optionally limit the evaluation to a single time period. Once completed add the new service to the affected hosts and activate the changes as usual.
3.3. mk_filestats in monitoring
You can then see the evaluation from the monitoring in lists and, of course, in the details. In addition to the parameters for the service, you will now also be able to see the files that are responsible for the WARN or CRIT status.
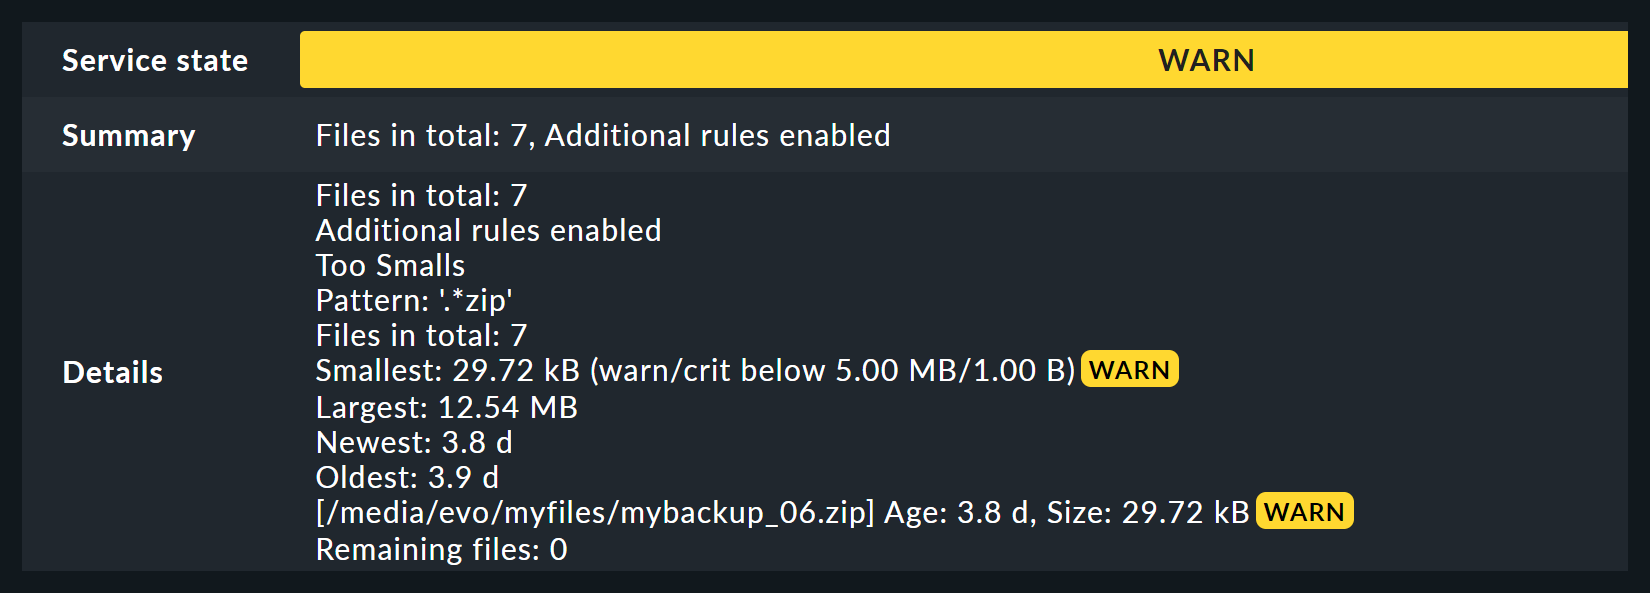
However, caution is advised with the Show files in service details option: If many files have been responsible for a status change, they will all be listed, which can lead to long lists and associated performance and view issues.
4. Monitoring files with fileinfo (Linux, Windows)
Monitoring files with fileinfo is basically the same as with mk_filestats, so the procedure here is a bit shortened, but is once again for file groups.
4.1. Configuring the rule for the agent
Agent Bakery configuration
The configuration of the agent in the commercial editions under Setup > Agents > Windows, Linux, Solaris, AIX > Agent rules > Count, size and age of files (Linux, Windows) is much simpler:
Here you only define the file path in the form of a globbing template.
This also raises the problem of transferring extremely long file lists, which can noticeably slow down monitoring. In addition, a separate service is created by default for each file found, which can only be avoided by forming groups.

Additional date: There is an additional, slightly-hidden filter option:
In the globbing pattern, you can use the $DATE variable to include only files whose names contain the current date.
The format of this variable is the same as that for the Linux program date.

A specification like /backups/mybackup_*_$DATE:%Y%m%d$ would — as of today, 10/22/2021 — consequently find files such as mybackup_01_20211022 and mybackup_foobar_20211022:

More information can be found directly on the rule’s page as well as in the related inline help.
This completes the configuration and you can deploy the plug-in including its configuration via the Agent Bakery.
Manual configuration
In the
![]() Checkmk Raw Edition with fileinfo you must also configure using files, which vary according to the operating system:
Checkmk Raw Edition with fileinfo you must also configure using files, which vary according to the operating system:
Linux: the configuration file is fileinfo.cfg:
C:\myfiles\*
/myfiles/*
/media/evo/test_$DATE:%Y%m%d$
Windows: the configuration file is check_mk.user.yml:
fileinfo:
  enabled: yes
  path:
  - 'c:\myfiles\*.*'
  - "c:\\myfiles\\*.*"
  - /media/evo/test_$DATE:%Y%m%d$
Note the different Windows file path notations here — in double quotes, the backslashes must be escaped.
Data in the agent output
You will then find the result from your configuration in the form of raw data in the agent output, starting with the section header fileinfo:
 <<fileinfo:sep(124)>>>
1634131485
C:\myfiles\myfile|12|1632490780
C:\myfiles\myfile2|12|1632490780
C:\myfiles\myfile3|12|1632490780
...
4.2. Service rule configuration
In the second step, the service rule Setup > Services > Service monitoring rules > Size, age and count of file groups is configured again. The minimum-maximum options correspond to those of mk_filestats, but the options for displaying the affected file names in the service details and for outliers are not present here. There are two additional options for this: First, you can directly enter a time period via Add time range — outside this time period the service will always have an OK status.
On the other hand, the powerful Level conjunctions feature is available: This allows you to set series of conditions for each of the four states OK, WARN, CRIT, and UNKNOWN. For example, you could specify that the service goes to CRIT if…
there are exactly 7 files
the smallest file is less than 10 megabytes,
the oldest file is less than 5 days old
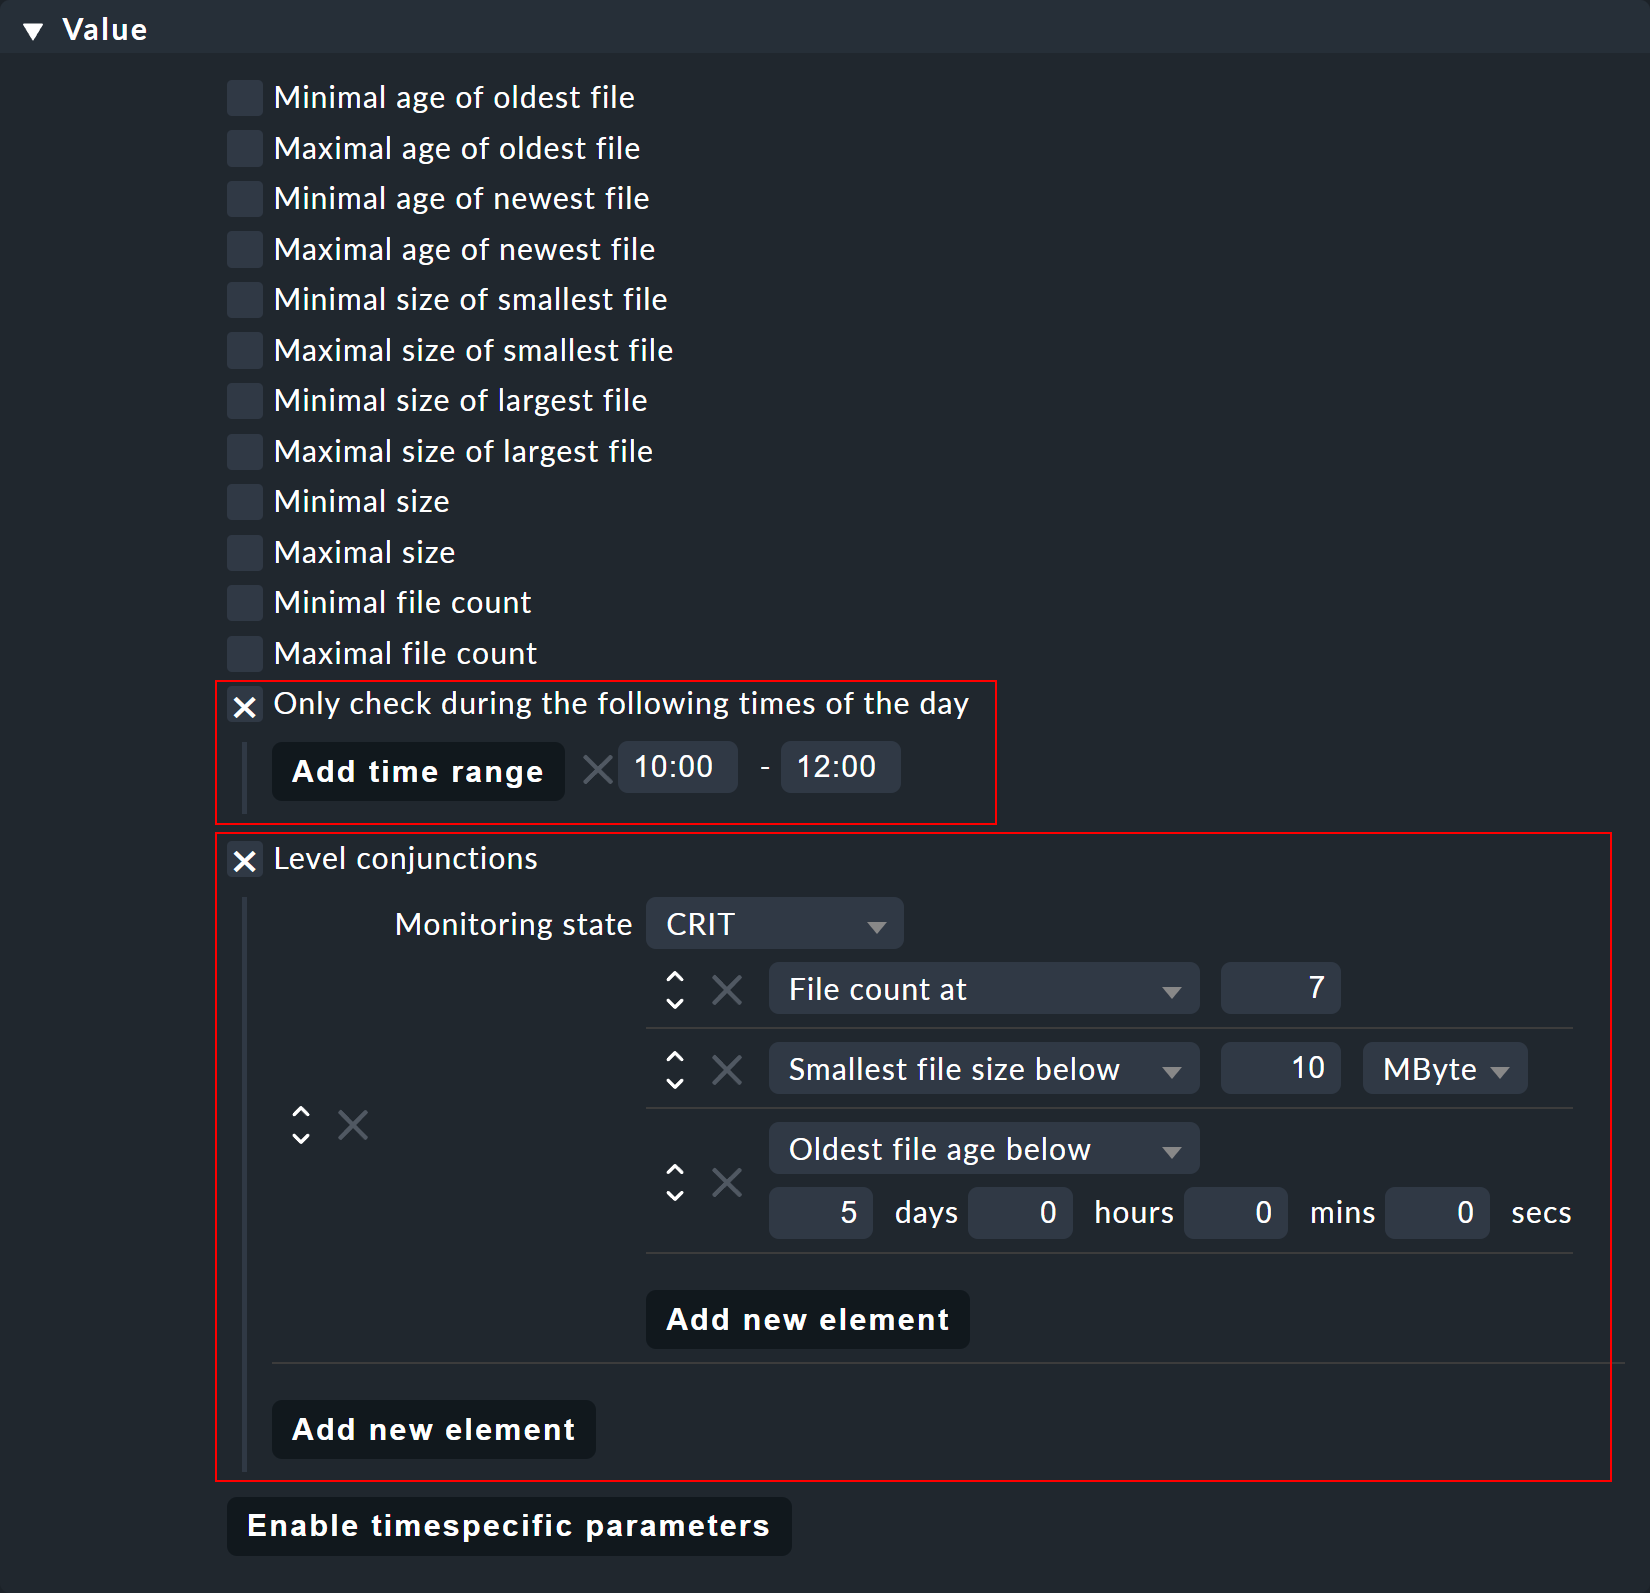
And again, you can restrict this rule to the desired myfiles group with File Group Name in the Conditions box.
In contrast to mk_filestats, the group formation only takes place in monitoring via the service rule Setup > Services > Service monitoring rules > File Grouping Patterns.
You ensure the assignment by also entering the group myfiles under Name of group.
The patterns for files to be included and excluded are not specified here by default via regular expressions, but only via globbing.
However, if you prepend a tilde (~), you can also use regular expressions here.

Additional date: Again the use of the $DATE variable is possible. As an alternative you can also use $YESTERDAY for filtering, which simply subtracts one day from $DATE.
As always, you can get more info on this in the inline help.
4.3. fileinfo in monitoring
In monitoring, the view of a fileinfo group is not very different from an mk_filestats group.
However, fileinfo always lists all affected files explicitly, regardless of whether they are responsible for a status change or not.
Here in the example you can see the two files yourfile with 0 megabytes which has no effect on the status, and yourfile_2.exe with its almost 11 megabytes which thus triggers the CRIT status:

yourfile is displayed by fileinfo, although it is not responsible for the status changeAll files delivered to the monitoring by fileinfo and which are not assigned to a group remain as individual services:

This very list shows why it is so important to be precise about filters in fileinfo:
For example, if C:\ were specified here without any restrictions, there would subsequently be several hundred thousand individual services in the monitoring.
5. Troubleshooting
5.1. No files or too many files in the monitoring
No matter whether you work with mk_filestats or fileinfo, missing files or even too many entries in the monitoring are often due to incorrect filters.
There are two main causes of this — a conflict between a globbing pattern and a regular expression, or an incorrect configuration.
For example, the asterisk behaves differently in the two variants:
In globbing, * stands as a placeholder for any number of arbitrary characters, and in a regular expression, it stands for one or more occurrences of the character preceding it. In order to match any characters in any quantity via regex, you would have to work with .* accordingly.
6. Files and directories
As always, all file paths for the Checkmk server are relative to the site directory (e.g. /omd/sites/mysite).
6.1. mk_filestats
| Location | File path | Content |
|---|---|---|
Checkmk-Server |
|
Sample configuration file |
Checkmk-Server |
|
Python 3 agent plug-in including explanations |
Checkmk-Server |
|
Python-2 agent plug-in including explanations |
Linux host |
|
Configuration file - created by the agent bakery or manually |
6.2. fileinfo
| Location | File path | Content |
|---|---|---|
Checkmk server |
|
Sample configuration file |
Linux host |
|
Configuration file - created by the agent bakery or manually |
Windows host |
|
Configuration file - created by the agent bakery |
Windows host |
|
Configuration file - created manually |
