1. Introduction
Checkmk usually accesses monitored hosts in the pull mode via a TCP connection to port 6556.
Starting with version 2.1.0, in most cases the Agent Controller listens on this port, which forwards the agent output over a TLS encrypted connection.
The ![]() Checkmk Cloud Edition 2.2.0 introduced the alternative option for selecting the transmission direction with the new push mode.
Checkmk Cloud Edition 2.2.0 introduced the alternative option for selecting the transmission direction with the new push mode.
There are environments however — for example, stripped-down containers, legacy or embedded systems — in which the Agent Controller cannot be used.
In such cases the legacy mode is applied in which (x)inetd executes the agent script after establishing a connection, the agent output is transferred as plain text and the connection is closed immediately after.
In many situations security policies could require that actions such as the transmission of data as plain text must be avoided. For example, the fill levels of file systems might be of little use to an attacker, but process tables or lists of missing updates could help in targeting an attack. Moreover the practice of opening additional ports should be avoided in favor of using existing communication channels.
The universal methods for connecting such transfer procedures to Checkmk are the datasource programs. The idea is very simple: one passes a command as text to Checkmk. Instead of connecting to port 6556, Checkmk executes this command. This produces the agent data on the standard output, which is then processed by Checkmk in exactly the same way as if it had come from a ‘normal’ agent. Since changes to data sources usually only affect transports, it is important that you leave the host to API integrations if configured, else Checkmk agent in the Setup GUI.
The modularity of Checkmk helps you to fulfill these requirements by transmitting the plain text agent output over arbitrary means of transport. Ultimately, the plain text output of the agent script can be transported by any means — direct or indirect, pull or push. Here are a few examples on how to get agent data to the Checkmk server:
via email
via HTTP-access from the server
via HTTP-upload from the host
via access to a file that has been copied to the server using
rsyncorscpvia a script that uses HTTP to retrieve the data from a web service
Another area of application for datasource programs are systems that do not allow agent installation but issue status data via REST API or a Telnet interface. In such cases, you can write a datasource program that queries the existing interface and generates agent output from the data obtained.
2. Writing datasource programs
2.1. The simplest possible program
The writing and installation of a datasource program is not difficult.
Any Linux-supported script and program language can be used.
The program is best stored in the ~/local/bin/ directory, where it will always be found automatically without the need to specify a data path.
The following first very basic example is called myds and it generates simple, fictional monitoring data.
Instead of integrating a new transport path, it generates the monitoring data itself.
These consist of one section <<<df>>>, which contains the
information for a single file system, and which has a size of 100 kB and the name My_Disk.
It is coded as a shell script of three lines:
#!/bin/sh
echo '<<<df>>>'
echo 'My_Disk  foobar  100 70 30  70% /my_disk'
Don’t forget to make the program executable:
OMD[mysite]:~$ chmod +x local/bin/mydsNow create a test host in the Setup – e.g., myserver125.
This does not require an IP address.
In order to avoid Checkmk attempting to resolve myserver125 via DNS, enter this name as an explicit ‘IP address’.
Next add a rule in the Setup > Agents > Other integrations > Individual program call instead of agent access rule set which applies to this host, and enter myds as an executable program:

When you now go to the host’s service configuration in the Setup GUI, exactly one service ready to start monitoring should be listed:

Add this service into the monitoring, activate the changes, and your first datasource program will be running.
For a test, as soon as you alter the data being generated by the program the My_Disk file system’s next check will immediately show this.
2.2. Error diagnosis
If something is not functioning correctly, the host’s configuration can be checked by entering cmk -D in the command line and see if your rule takes effect:
OMD[mysite]:~$ cmk -D myserver125

myserver125
Addresses:              myserver125
Tags:                   [address_family:ip-v4-only], [agent:cmk-agent], [criticality:prod], [ip-v4:ip-v4], [networking:lan], [piggyback:auto-piggyback], [site:mysite], [snmp_ds:no-snmp], [tcp:tcp]
Host groups:            check_mk
Agent mode:             Normal Checkmk agent, or special agent if configured
Type of agent:
Program: myds
With a cmk -d you can trigger the retrieval of the agent data as well as the execution of your program:
OMD[mysite]:~$ cmk -d myserver125
<<<df>>>
My_Disk  foobar  100 70 30  70% /my_disk
A duplicated -v should generate a message that your program will be invoked:
OMD[mysite]:~$ cmk -vvd myserver125
Calling: myds
<<<df>>>
My_Disk  foobar  100 70 30  70% /my_disk
2.3. Transferring a host’s name
The program in our example actually works, but is not very useful as it always produces the same data, regardless of which host it is invoked for.
A real program that, for example, retrieves data via HTTP from somewhere, requires at least the name of the host from where it should retrieve the data.
By coding $HOSTNAME$ as a placeholder in the command line you can allow this to be transferred:

In this example the program myds receives the host name as its first argument.
The following program example produces this for testing in the form of a local check.
Via $1 it takes the first argument and saves it for use as an overview in the $HOST_NAME variable.
This will then be inserted into the local check’s plug-in output:
#!/bin/sh
HOST_NAME="$1"

echo '<<<local>>>'
echo "0 Hostname - My name is ${HOST_NAME}"
The service discovery will then find a new service of the local type, in the output from which the host name will be seen:

From here it is only a small step to a real datasource program that, for example, retrieves data over HTTP using the curl command.
The following placeholders are permitted in a datasource program’s command line:
|
The host name as configured in the Setup. |
|
The IP address of the host over which it will be monitored. |
|
The list of all host tags, separated by blank characters – enclose this argument in quotes to prevent it being split by the shell. |
If you have a dual-monitoring using IPv4 and IPv6, the following macros may be interesting for you:
|
The host’s IPv4-address |
|
The host’s IPv6-address |
|
The numeral |
2.4. Error handling
Regardless of your actual occupation in IT — much of your time will be spent dealing with errors and problems. Datasource programs are not spared these. Especially for programs that provide data over networks it is unrealistic to expect them to be error-free.
In order that Checkmk can communicate an error to your program in an orderly way, the following apply:
Any exit code other than
0will be treated as an error.Error messages are expected on the standard error channel (
stderr).
If a datasource program fails,
Checkmk discards the output’s complete user data,
Checkmk sets the Checkmk service to CRIT and identifies the data from
stderras an error,and the actual services remain in their old state (and will become stale over time).
We can modify the above example so that it simulates an error.
With the redirection >&2 the text will be diverted to stderr, and exit 1 sets the program’s exit code to 1:
#!/bin/sh
HOST_NAME=$1

echo "<<<local>>>"
echo "0 Hostname - My name is $HOST_NAME"

echo "This didn't work out" >&2
exit 1
As a Checkmk service it will look like this:

Should you be writing your program as a shell script, right at the beginning you can code the set -e option:
#!/bin/sh
set -e
As soon as an instruction produces an error (i.e., exit code not 0), the shell immediately stops and issues the exit code 1.
You have thus a generic error handling and must not check every single instruction for success.
3. Special agents
A number of often-required datasource programs are delivered with Checkmk. These generate agent outputs not just by calling a normal Checkmk agent in a roundabout way, rather they have been specially conceived for the querying of particular hardware or software.
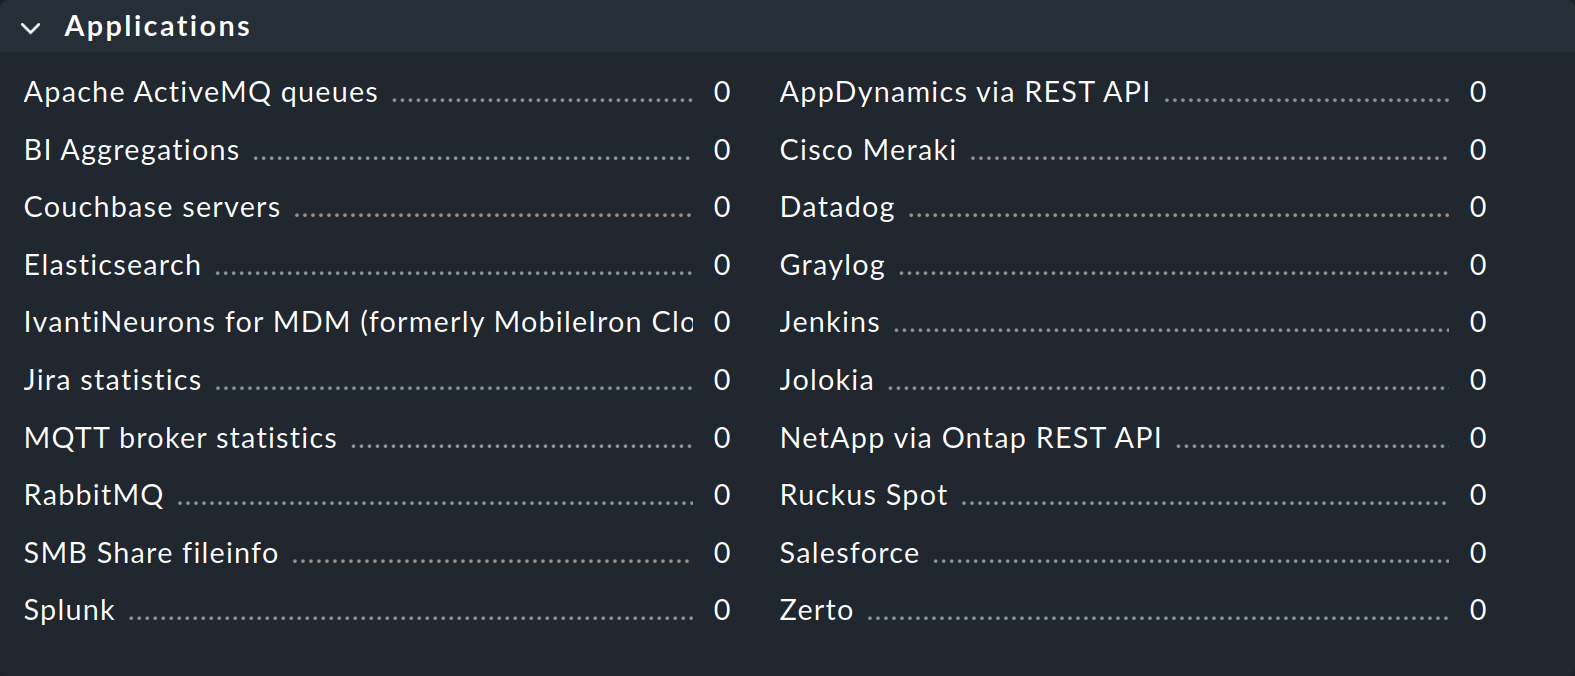
Because these programs sometimes require quite complex parameters, we have defined special rule sets in the Setup GUI that allow you to configure them directly. You can find these rule sets grouped by use cases under Setup > Agents > VM, cloud, container and Setup > Agents > Other integrations.

Those who have switched from older Checkmk versions may be surprised by the new grouping: Checkmk 2.0.0 no longer groups according to access technique, but by type of monitored object. This is particularly useful because in many cases the user is not interested in which technique is used to retrieve data and, moreover, data sources and piggyback are often combined, so no clear delimitation is possible here. |
These programs are also known as special agents, because they are a special alternative to the normal Checkmk agents. As an example, let us take the monitoring of NetApp Filers. These do not allow the installation of Checkmk agents. The SNMP interface is slow, flawed and incomplete. There is however a special HTTP interface which provides access to the NetApp Ontap operating system and all of the monitoring data.
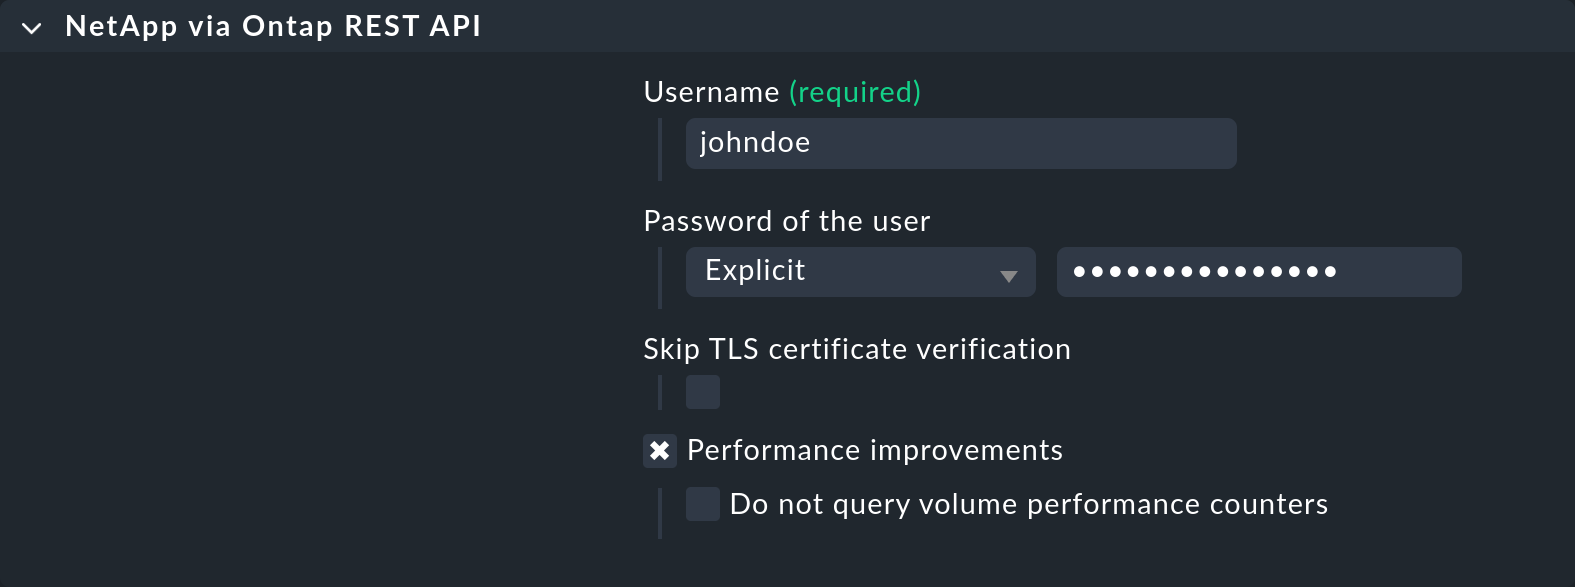
The agent_netapp_ontap special agent accesses this interface via a REST API and is set up as a data source program using the NetApp via Ontap REST API rule set.
The data required by the special agent can then be entered into the rule’s content.
This is almost always some sort of access data.
With the NetApp special agent there is also an additional check box for the recording of metrics (which here can be quite comprehensive):

It is important that you leave the host set to API integrations if configured, else Checkmk agent in the Setup GUI.
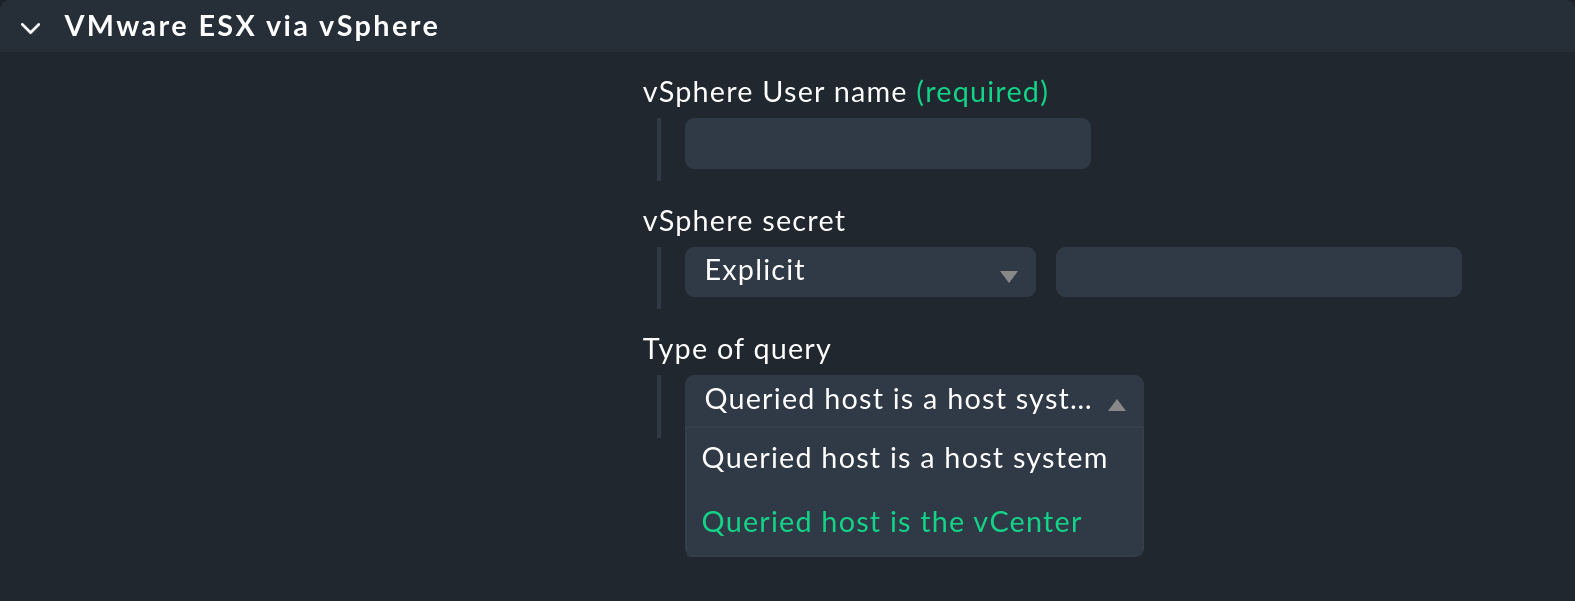
There are rare occasions in which it is desired that both a special agent, as well as the normal agent are to be queried. An example for this is the monitoring of VMware ESXi over the vCenter. This latter is installed on a (usually virtual) Windows machine, on which reasonably enough a Checkmk agent is also running.

The special agents are installed under ~/share/check_mk/agents/special/.
If you wish to modify such an agent, first copy the file with the same name to ~/local/share/check_mk/agents/special/ and make your changes in that new version.
4. Files and directories
| Path | Function |
|---|---|
|
The repository for own programs and scripts that should be in a search path, and which can be directly executed without specifying the path. If a program is in |
|
The special agents provided with Checkmk are installed here. |
|
The repository for your own modified special agents. |
