1. Start page
In the Checkmk graphical user interface (GUI) you will see some elements that we do not need at this stage. Many of these are empty, or show zeros, which is because we have not yet included any objects in the monitoring:
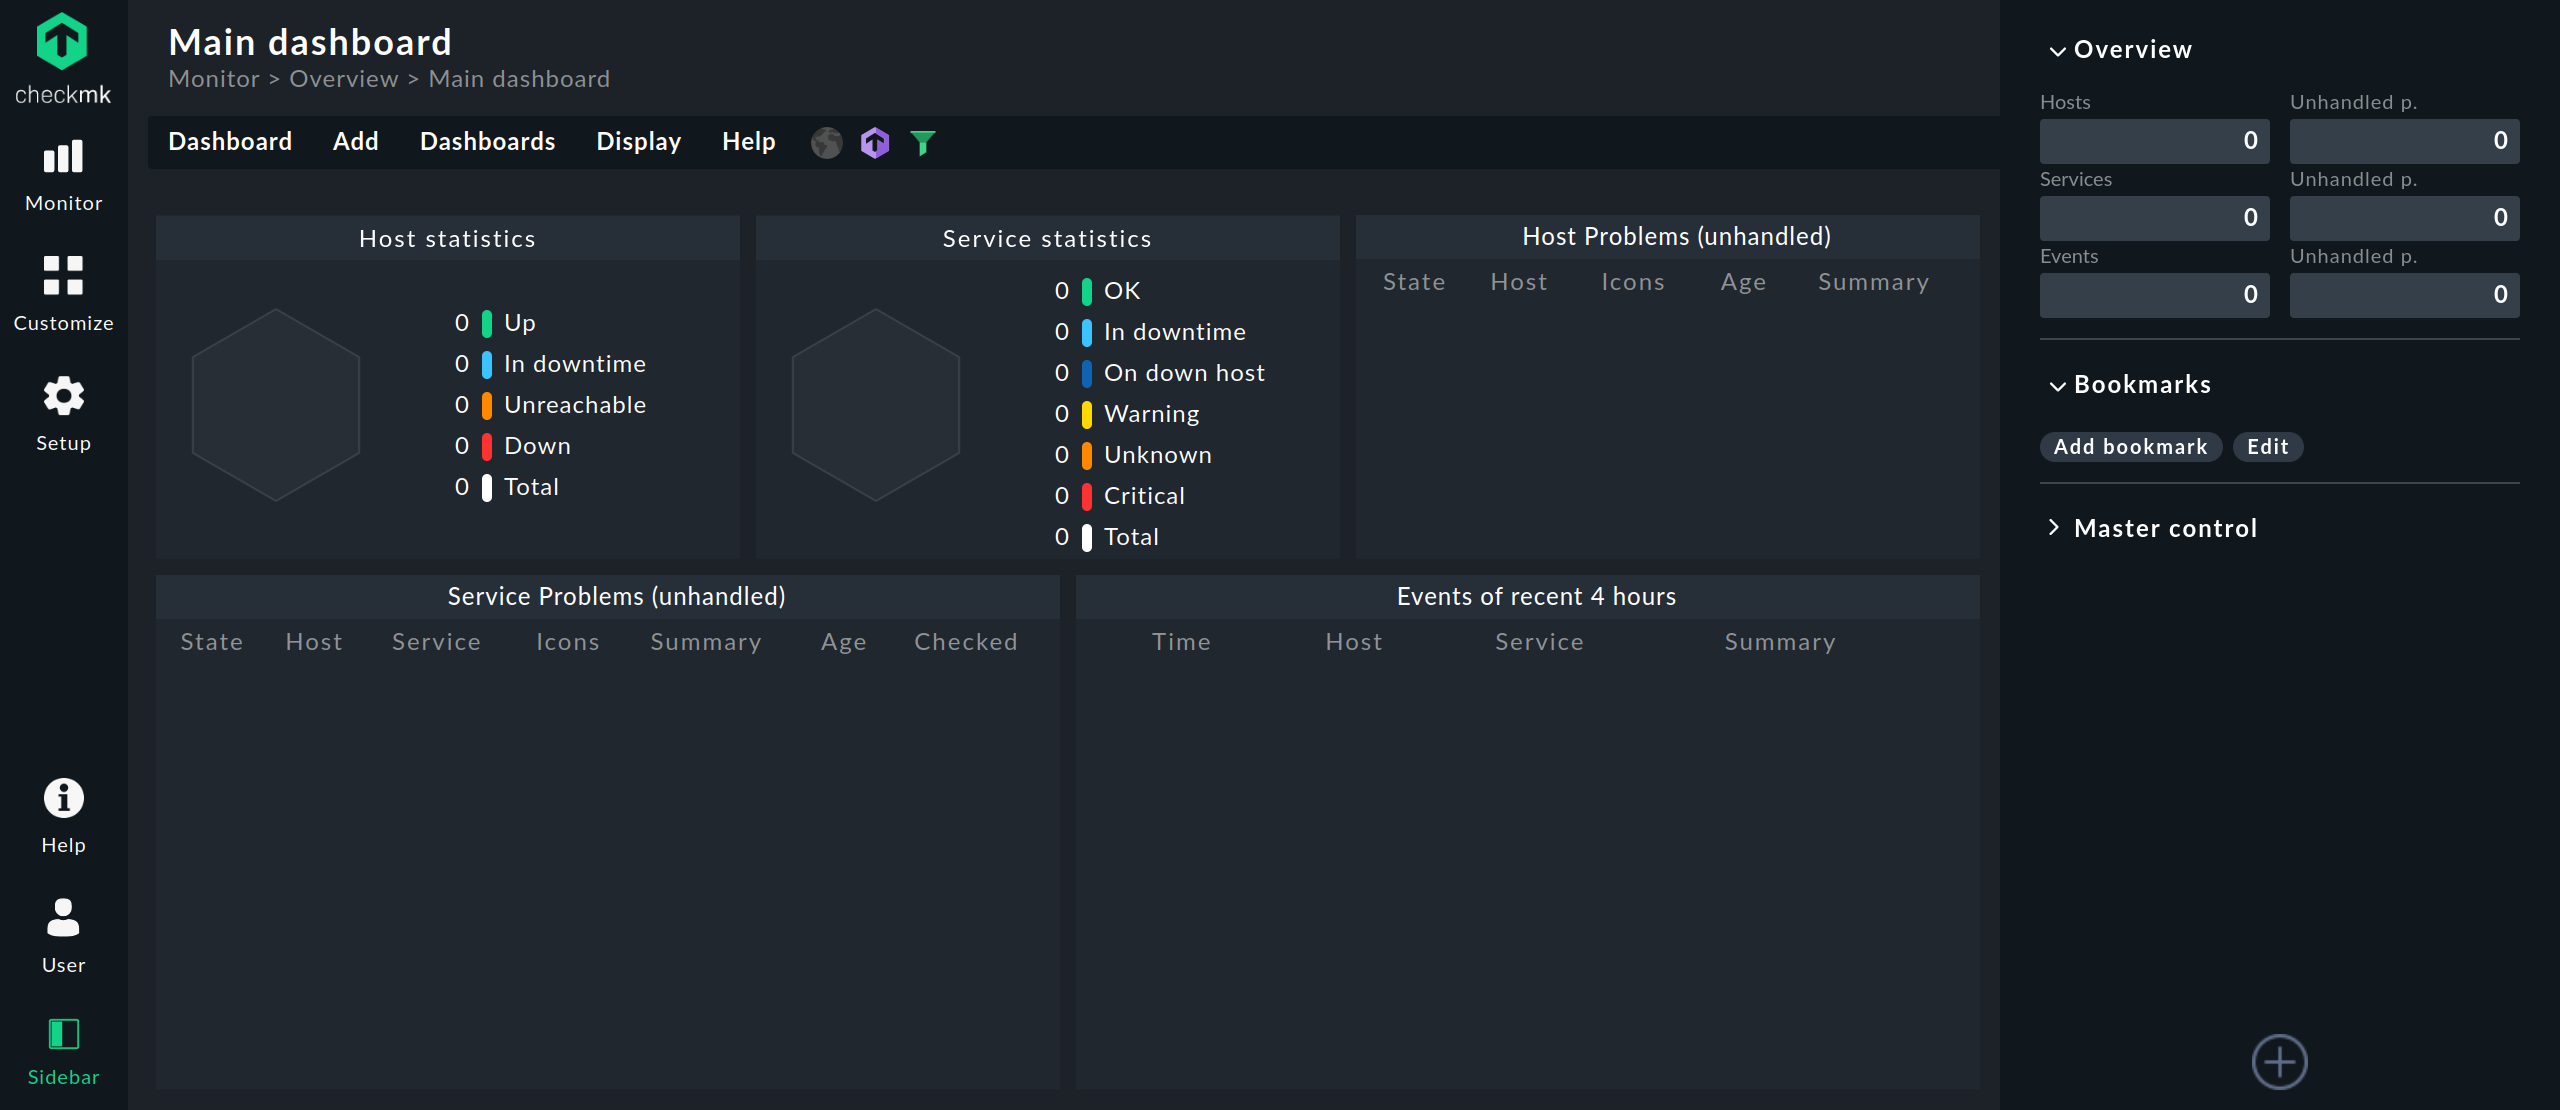
Nevertheless, you should familiarize yourself with the basic elements of the interface. Most important is the division into the navigation bar on the left, the main page in the middle, and the sidebar on the right.
Note: The Main dashboard shown above with problems and statistics of all hosts and services is that of the Raw Edition. The commercial editions offer by default a different graph-enhanced Main dashboard.
2. Navigation bar

With the navigation bar on the left and the icons it contains, you make the basic decisions about what Checkmk should do for you:
Monitor — The monitoring itself
Customize — For the customization of interface elements useful for the monitoring (such as bookmarks, views, dashboards, and graphs)
Setup — For the setting up of the objects to be monitored (such as hosts and services)
Behind these three symbols are more or less extensive menus, the so-called 'mega menus' or icon menus, whose entries are divided into several topics — for example, in the Setup menu under the Hosts topic you will find entries for configuring hosts, host groups, host tags and host-specific rules.
At the bottom of the navigation bar, in the User menu, you will find entries that apply to your user account.
At the top right of the menu you will see the current user name (currently cmkadmin) and the role (admin) assigned to this user.
In this menu you can change the password, log out of the Checkmk interface and personalize your profile.
An overview of the available personal settings can be found in the chapter on the User menu.
In the Help menu you will find the edition and version of Checkmk currently in use and some entries with which you can call up documentation and information — inside Checkmk or outside. Among other things, you can also open this User guide. If there are incompatible changes after an update, you will see the number in the Help menu icon. In the Help menu itself, a link in red background color is then displayed with which you can open the list of Werks of these incompatible changes.
The navigation bar is completed at the very bottom by Sidebar (which allows you to hide or show the sidebar by simply clicking on it) and at the very top by the Checkmk logo. Clicking on the logo always takes you back to the default dashboard displayed on the main page.
3. Main page
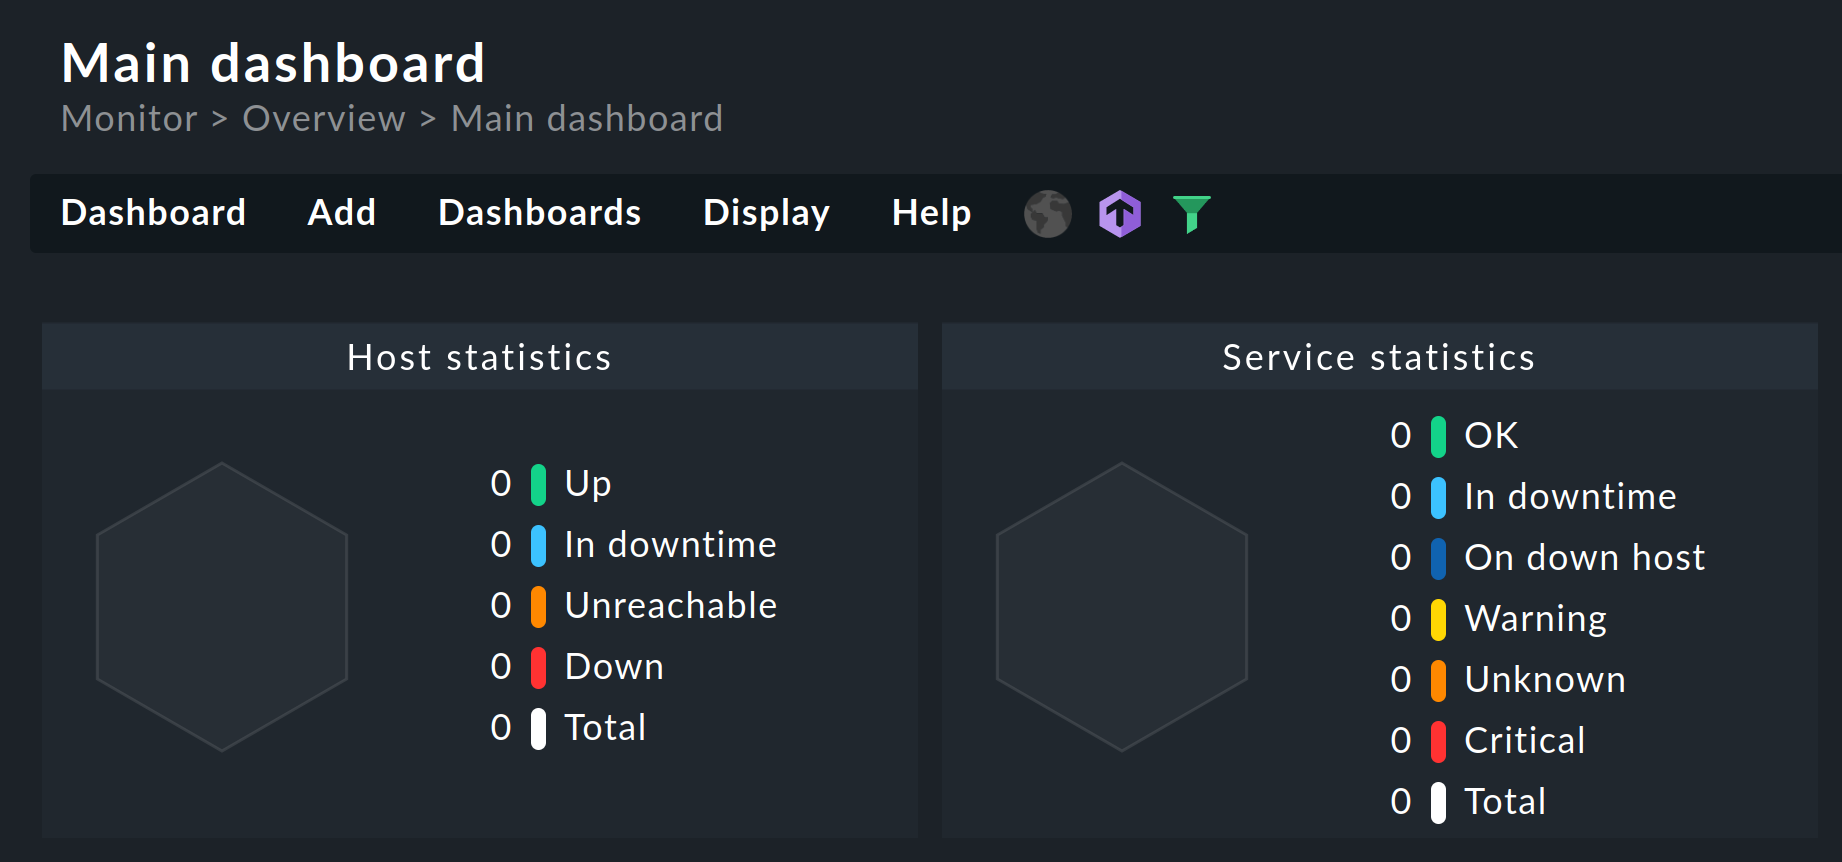
What you see on the main page depends on where you are in Checkmk. After logging in, you will first see the standard or main dashboard, which shows an overview of the current status and recent events on the monitored objects:
The content of the main page changes depending on your selection in the navigation bar and also in the sidebar. For example, if you select to change your profile in the User menu, all profile settings will be displayed on the main page.
Below the current page’s title you can see the path to that page, always starting with the name of the menu from the navigation bar. With the help of this 'breadcrumb navigation' you will always know where you are in Checkmk, even after complex actions, i.e. currently on the Main dashboard page in monitoring.
4. Sidebar
The sidebar is your Checkmk cockpit. It is the place where you have a continuous overview of the most important monitoring information, as well as quick access to the functions that you need most frequently in Checkmk.
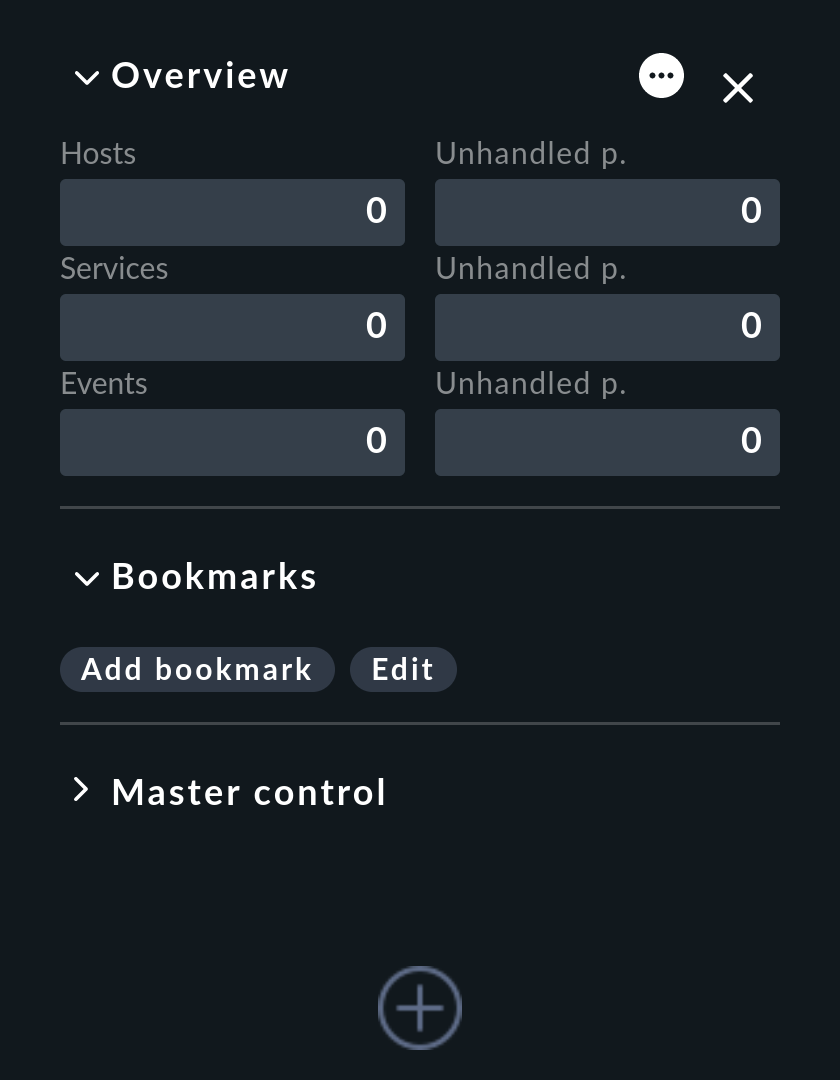
You can compose the complete sidebar according to your preferences. The sidebar elements, also called 'snap-ins', serve this purpose. Snap-ins are compact GUI containers with predefined functions. Since the sidebar is intended to hold your preferences, by default a new installation contains only a few snap-ins:
Overview — An overview of all monitored objects with their current status information
Bookmarks — Your personal bookmarks within Checkmk
Master control — Various main switches for the monitoring
If you click on ![]() at the very bottom of the sidebar, the main page will show you all the snap-ins that are currently not in your sidebar and that you can add with a single click.
In this preview, the lower area of each snap-in shows a short description about its meaning and purpose.
Try it out and fill the sidebar as a test.
at the very bottom of the sidebar, the main page will show you all the snap-ins that are currently not in your sidebar and that you can add with a single click.
In this preview, the lower area of each snap-in shows a short description about its meaning and purpose.
Try it out and fill the sidebar as a test.
Depending on the size of your screen, not all snap-ins may now be visible. The fastest way to move vertically through the sidebar is to use the mouse wheel while the mouse pointer is over the sidebar. On touchpads, this function is often possible with the gesture 'slide two fingers up and down together' method.
In the sidebar you can manipulate the snap-ins like this:
Expand or collapse: Click in the displayed title of the snap-in. Alternatively, point to the title bar and then click
 or
or  .
.Show more or less: Some snap-ins (like Overview) offer you two views — either with only the most important information or with all information. Point the mouse at the title bar and click
 or
or  to switch between the two modes.
Move: Press the left mouse button right next to the title, drag the snap-in up or down to another position in the sidebar and release the mouse button.
Remove from sidebar: Point the mouse at the title bar and click
 .
.
So much for the options for customizing the sidebar’s content. As a whole, you can hide and show the sidebar — with Sidebar in the navigation bar — and you can move its position from right to left so that it docks with the navigation bar — in the menu User > Sidebar position.
By the way, you can get more detailed information on the above-mentioned snap-ins in the chapter on monitoring tools.
5. Show less or Show more
Checkmk provides a wide range of setting and selection options in many places on the interface. This selection can sometimes be quite overwhelming, so that one can lose sight of the essentials and orientation becomes difficult — not only, but especially for newcomers to monitoring.
As a measure to reduce complexity, you will find three dots (…) in many locations on the Checkmk interface, such as in the Overview or here on the far right in the first line of the Monitor menu:

Whenever you see these ellipsis points, Checkmk offers two views:
In the 'Show less' mode only the most important entries are shown (meant for the beginner), and in the 'Show more' mode all entries (for the expert).
You can switch between the two modes by clicking on the omission points:
show more with ![]() and show less with
and show less with ![]() .
.
You set the general behavior in the settings for your user profile (User > Edit profile > Show more / Show less > Set custom show mode) by setting one of the two modes as the default — or do without both modes and face the unfiltered complexity with Enforce show more.
6. Searching and finding
In the Checkmk interface you will find two central locations for the search — in the monitoring environment in the Monitor menu, and in the configuration environment in the Setup menu. The input fields for the search terms can be found in the first line of the corresponding menu.
Note: The search in the monitoring environment will not return any results until you add the first host to the monitoring.
6.1. Searching in the monitoring environment
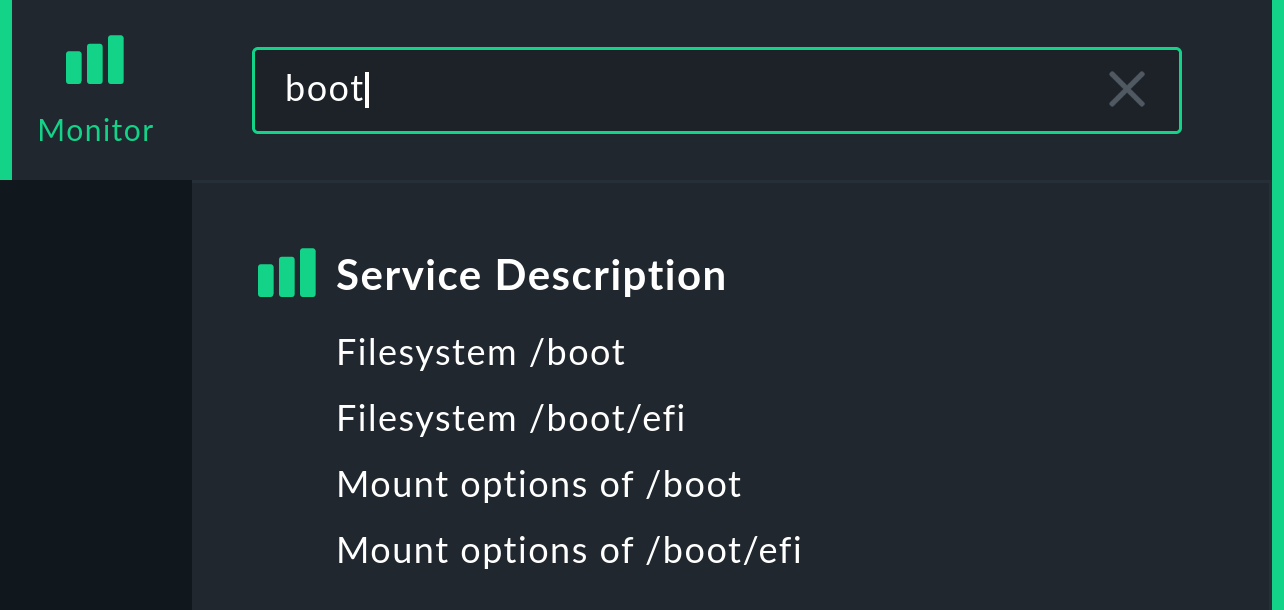
In the Monitor menu you can search for hosts and services. The search is interactive, so as soon as you have typed something, you will immediately see the results matching your input below the search field:
The search function in the Monitor menu is identical to that offered to you by the Quicksearch snap-in.
Here are a few tips for searching:
Upper and lower case is not relevant to the search — with the exception of the search for labels, which are only found if they are entered exactly as they are called in the syntax
key:value.You can work freely with keywords, e.g. search for
pending service.But you can also use filters to search for patterns within host names (with
h:), patterns within service names (withs:) and you can combine the two. A search fors:bootwill show you all services that containbootand a search forh:win s:cpuwill show you all services that containcpuon any hosts that containwin.For each result category, only a maximum of 10 results will be shown to you at first. You can then reload the rest with the last entry Show all results.
You do not have to select an entry from the suggestion list. After entering your search term, simply press the Enter key and you will receive the appropriate result on the main page in the form of a list of all hosts and/or services.
You can save the search query in a bookmark.
Apart from the two filters h: and s: mentioned above, there are others you can use.
You can find out what these are and how you can also use regular expressions in the article on the user interface.
6.2. Searching in the configuration environment
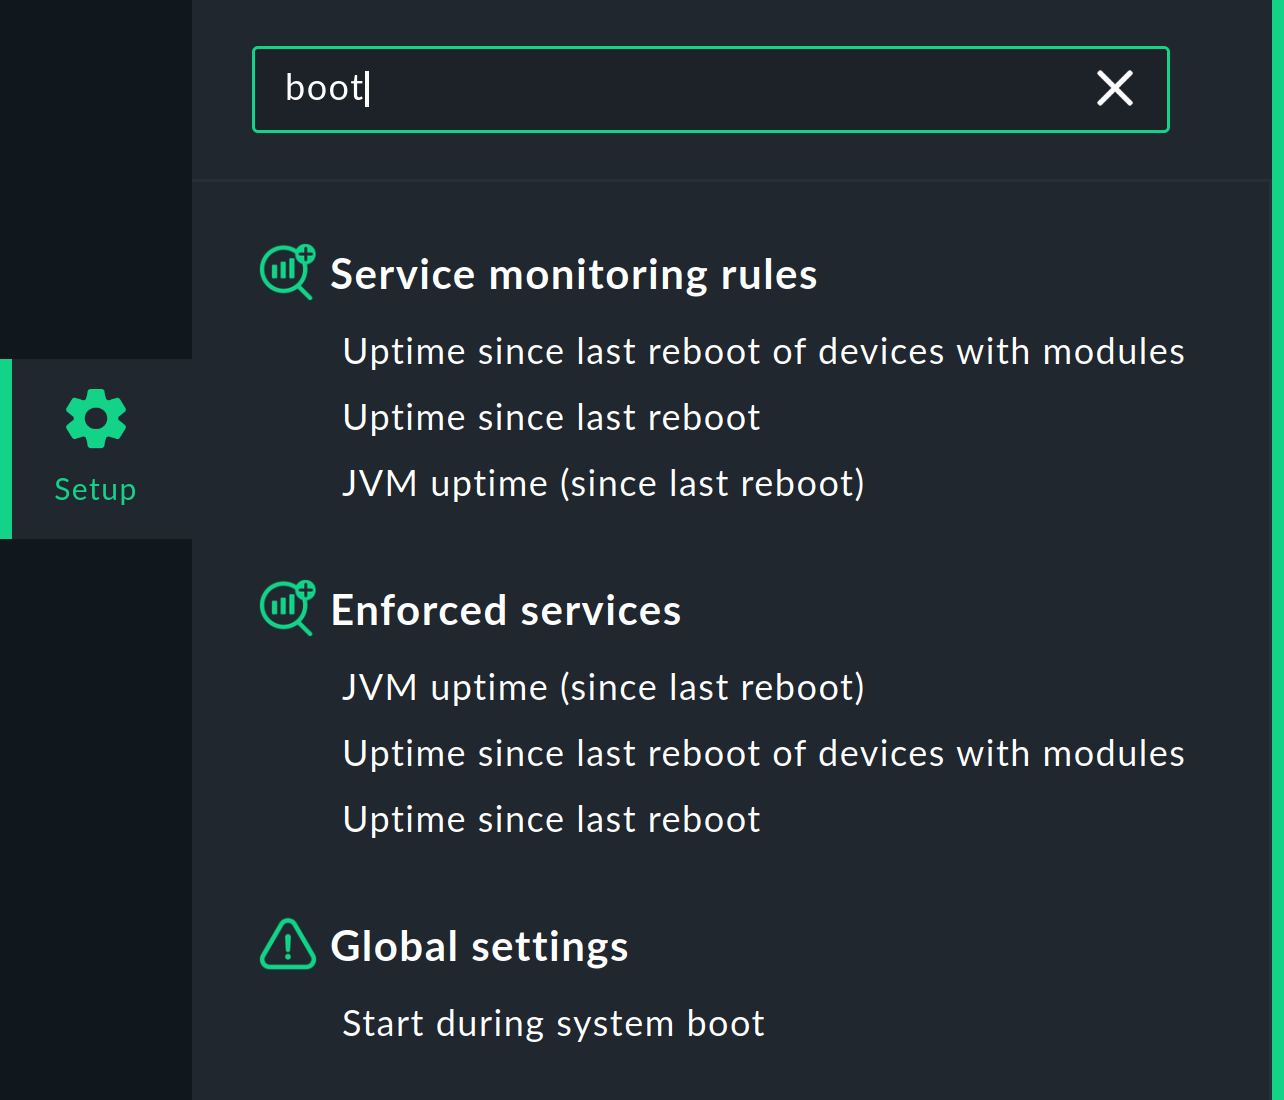
Using the search field in the Setup menu, you can search the configuration environment of Checkmk, i.e. the Setup menu itself, with all of its visible entries and additionally with some hidden ones.
The search scope includes, among other things, all rule sets that are grouped into topics in the Setup menu and the Global settings. Searches are carried out in the titles and the parameter names.
You search with free text, i.e. without filter rules as in the Monitor menu. You do not need to pay attention to upper and lower case. The search results are displayed as you type:
The search for rule sets becomes interesting when it comes to fine-tuning the monitoring later on, but we are not there yet, because: