1. Introduction
With its integrated graphing system, Checkmk has a powerful tool for recording and visualizing metrics. Nevertheless, it can be useful to connect Grafana as an external graphing system, for example, when you already use Grafana and want to merge the data from Checkmk with data from other systems into shared dashboards.
Since Grafana 8.x, it is possible to address Checkmk directly as a data source in all editions and to display individual metrics or even entire graphs as predefined in Checkmk. In addition, you can dynamically create your own graphs by using regular expressions to define a group of hosts and services from which certain metrics are to be included in the graph.
This article describes how to retrieve and display your Checkmk metrics in Grafana. The screenshots used here were created with Grafana 10.1, earlier versions differ slightly in their user interface. Detailed instructions on how to use and configure Grafana can be found in the documentation at Grafana Labs.
The Grafana plug-in has been developed independently of Checkmk and is maintained in its own Github repository. This article describes the installation of the plug-in in version 3.1, which interacts with Checkmk 2.1.0 and 2.2.0. As the plug-in is installed in Grafana, it does not make sense to deliver it together with Checkmk.
2. Installing the plug-in in Grafana
Depending on your Grafana server installation type and your Checkmk edition, several methods for installing the plug-in are available.
The only restriction here is that users of the Grafana Cloud solution must use the ![]() Checkmk Cloud Edition and activate the plug-in via the official Grafana plug-in collection.
On-premises installations of Grafana can be connected to all Checkmk editions.
Checkmk Cloud Edition and activate the plug-in via the official Grafana plug-in collection.
On-premises installations of Grafana can be connected to all Checkmk editions.
2.1. Installation using the command line (Cloud Edition, own Grafana server)
This type of installation requires the use of the ![]() Checkmk Cloud Edition.
If Grafana is operated on its own server, installation from the Grafana plug-in collection is possible via the command line:
Checkmk Cloud Edition.
If Grafana is operated on its own server, installation from the Grafana plug-in collection is possible via the command line:
root@linux# grafana-cli plugins install checkmk-cloud-datasourceRestart the Grafana server service:
root@linux# systemctl restart grafana-serverThe plug-in will then be available in the Grafana interface and so can there be activated and set up.
2.2. Installation via the Grafana Cloud GUI (Cloud Edition, Grafana Cloud)
First log in to the Grafana instance in which you want to install the Checkmk data source. Then open the page for the data source in the Grafana plug-in collection. In the Installation tab, tick the Grafana instance that is to receive the plug-in and then click on the Install button. It may take a few minutes before the plug-in is available in the Grafana installation’s web interface.
2.3. Installation from a zip archive (all editions, own Grafana server)
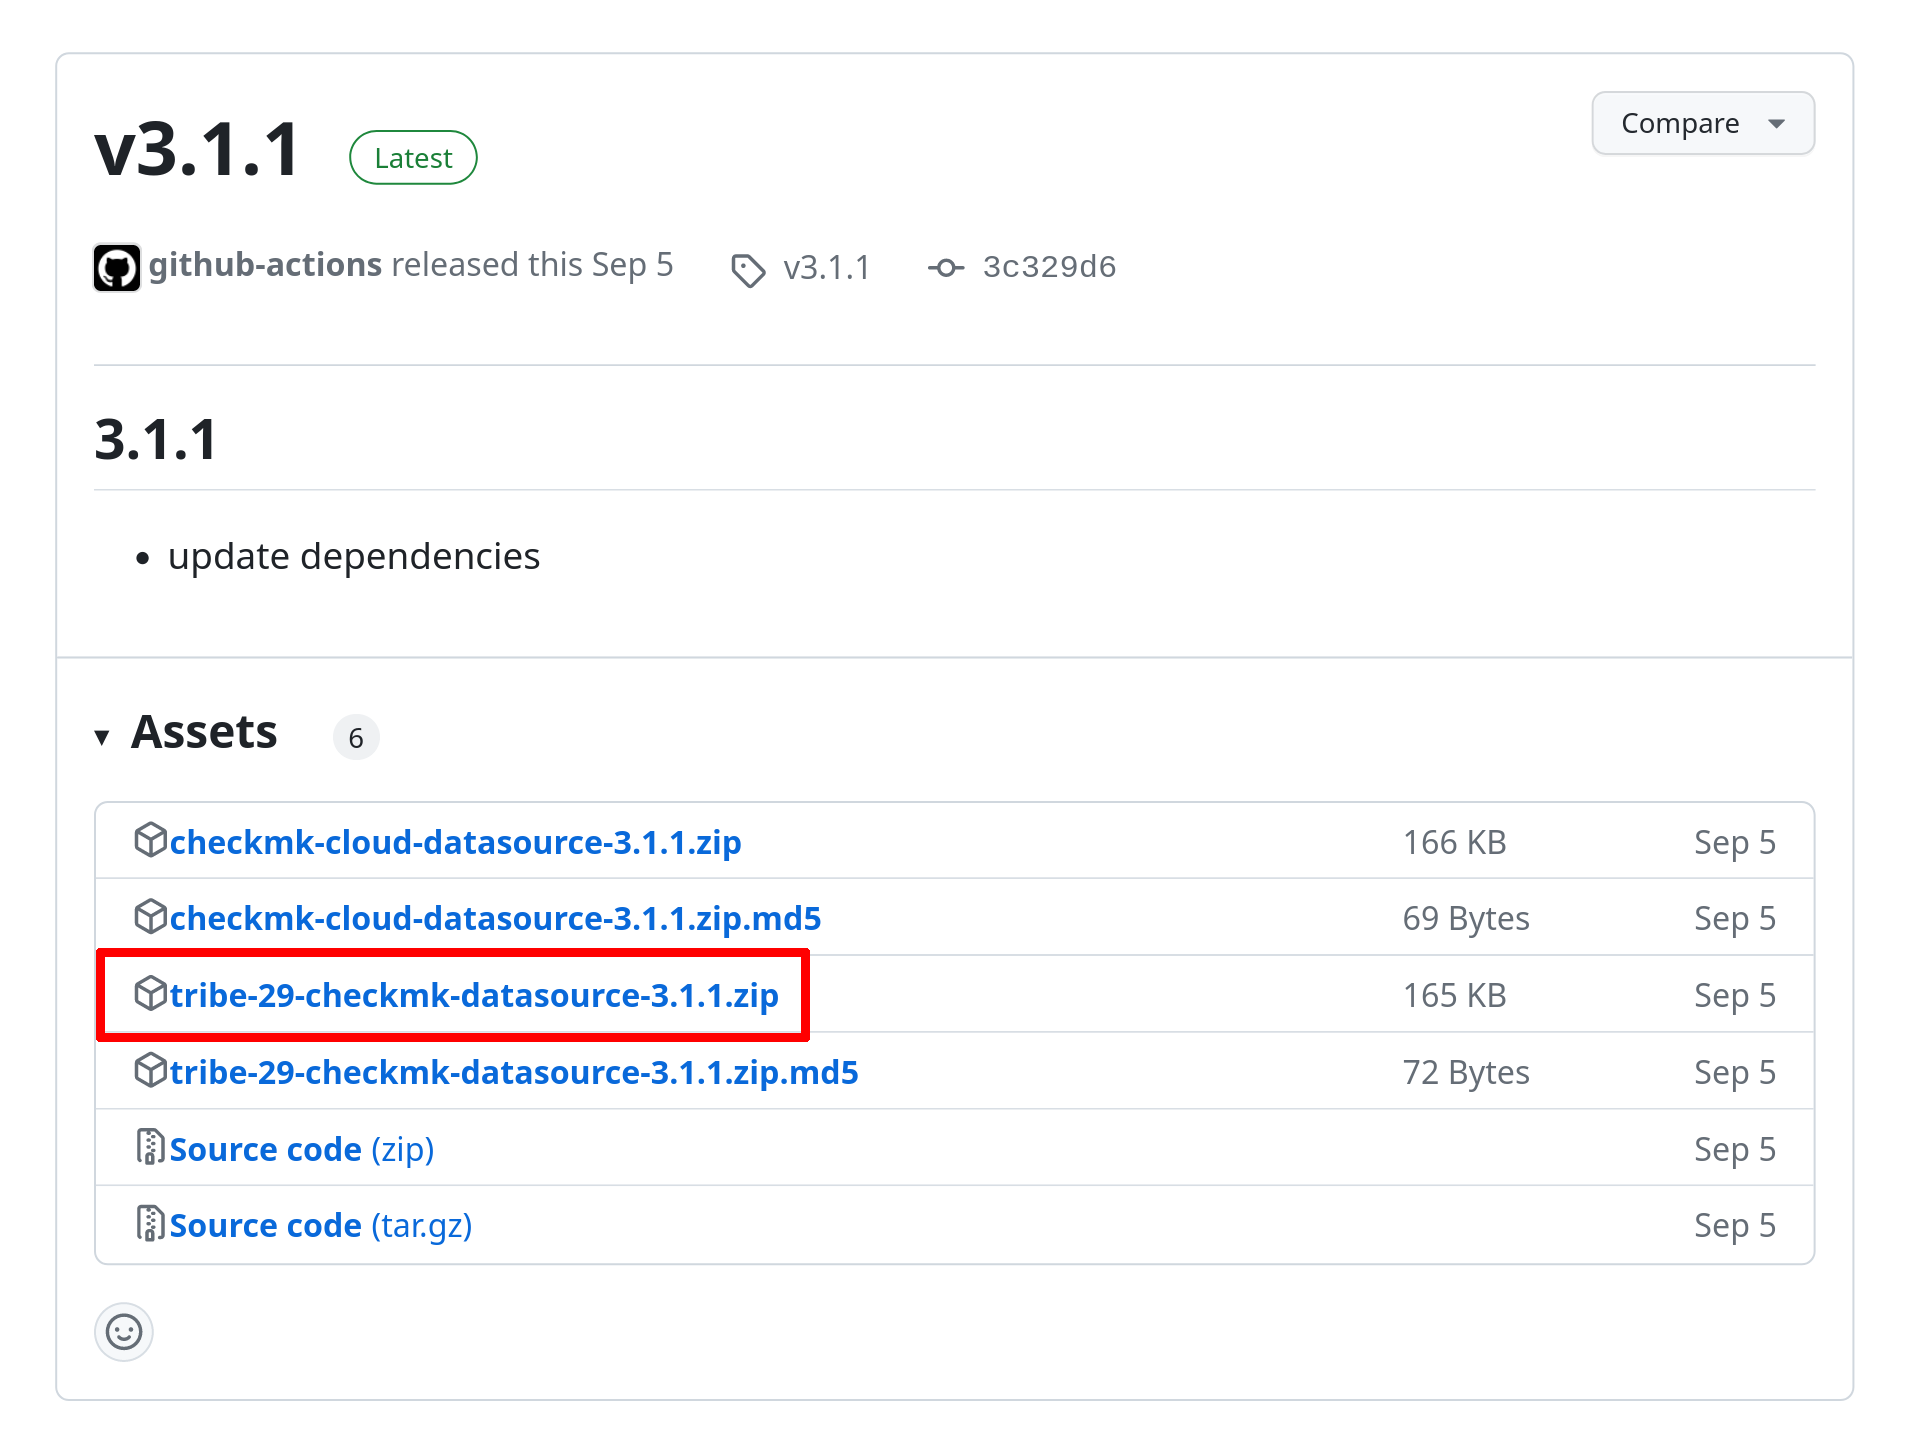
On the Releases page in the GitHub repository you will find two variants of the plug-in as a zip archive:
The signed variant
checkmk-cloud-datasource-X.Y.Z.zipmentioned above, which can only be used with the Cloud Edition.A variant that uses the old
tribe-29-checkmk-datasource-X.Y.Z.zipnaming scheme, for all editions from Checkmk 2.1.0 and newer.
Simply download the latest version as a zip file and copy it, for example with scp, to the Grafana server.
Instead of using the browser, you can of course also load the file directly from the command line.
Note that you need to know the current version for this — in the following example, we write the version in the $plugvers variable.
root@linux# plugvers='3.1.1'
root@linux# wget https://github.com/Checkmk/grafana-checkmk-datasource/releases/download/v${plugvers}/tribe-29-checkmk-datasource-${plugvers}.zip
Next, unpack the zip archive:
root@linux# unzip tribe-29-checkmk-datasource-${plugvers}.zipCreate a plug-in directory, if this does not already exist, and make the Linux user under whose ID the Grafana processes are executed (usually grafana) its owner:
root@linux# mkdir -p /var/lib/grafana/plugins
root@linux# chown grafana:grafana /var/lib/grafana/plugins
Move the resulting folder to the Grafana plug-in directory.
This is usually the file path /var/lib/grafana/plugins/:
root@linux# mv -v tribe-29-checkmk-datasource /var/lib/grafana/plugins/tribe-29-checkmk-datasourceChange the ownership to the Grafana user:
root@linux# chown -R grafana:grafana /var/lib/grafana/plugins/tribe-29-checkmk-datasourceAn installation by cloning the Git archive (as described in older versions of this article) is no longer possible. If you want to participate in the development of the plug-in, read the Development Guide.
Allowing unsigned plug-ins
Since Grafana 8.0, it is no longer possible to integrate external plug-ins if they have not been signed. This also applies to the Checkmk plug-in, so that you will require an additional step.
To do this, edit the /etc/grafana/grafana.ini configuration file in the [plugins] section.
Change the line ;allow_loading_unsigned_plugins = as follows.
Make sure to remove the semicolon at the beginning of the line:
[plugins]
allow_loading_unsigned_plugins = tribe-29-checkmk-datasource
With this setting, you add an exception for this one plug-in. If you are using Grafana in a (Docker) container, there are several ways to make changes to the Grafana configuration. If only small configuration changes are necessary, these can be made via the environment variables:
user@host:~$ sudo docker run -d \
-e GF_PLUGINS_ALLOW_LOADING_UNSIGNED_PLUGINS=tribe-29-checkmk-datasource \
-p 3000:3000 --name grafana \
-v grafana-plugins:/var/lib/grafana/plugins \
-v grafana-db:/var/lib/grafana grafana/grafana
If major customizations of the INI file or the entire /etc/grafana/ are required, either link the customized INI file to the container or create a volume which you map to the directory in the container (/etc/grafana/).
The following is an example of how to link the INI file with --mount.
Note that this is only an example and will probably not apply directly to your environment:
user@host:~$ sudo docker run -d \
--mount type=bind,source=/home/user/grafana/grafana.ini,target=/etc/grafana/grafana.ini \
-p 3000:3000 --name grafana \
-v grafana-plugins:/var/lib/grafana/plugins \
-v grafana-db:/var/lib/grafana grafana/grafana
Restarting the Grafana service
After installing the plug-in, updating or modifying the configuration file, restart the Grafana server service:
root@linux# systemctl restart grafana-serverThe plug-in will then be available in the Grafana interface and can there be activated and set up.
3. Creating a Grafana user in Checkmk
The Grafana connection requires a user on the Checkmk side who has sufficient permissions and is also authenticated via an automation password (automation secret) instead of a password. Normal guest or monitoring users are not sufficient, and for security reasons you should not use an administrator.
The easiest way to create a 'suitable' user is to clone the role of the guest user (guest) and provide it with the additional authorization User management (allow read access to user information).
If you base your Grafana user role on another role, make sure that the See all host and services authorization is set in addition to User management.
Once the role has been created, create one or more Grafana users with an automation password (automation secret). You can further restrict the authorizations assigned to the role later, for example no access to BI or the Event Console is required.
4. Activating and setting up the plug-in
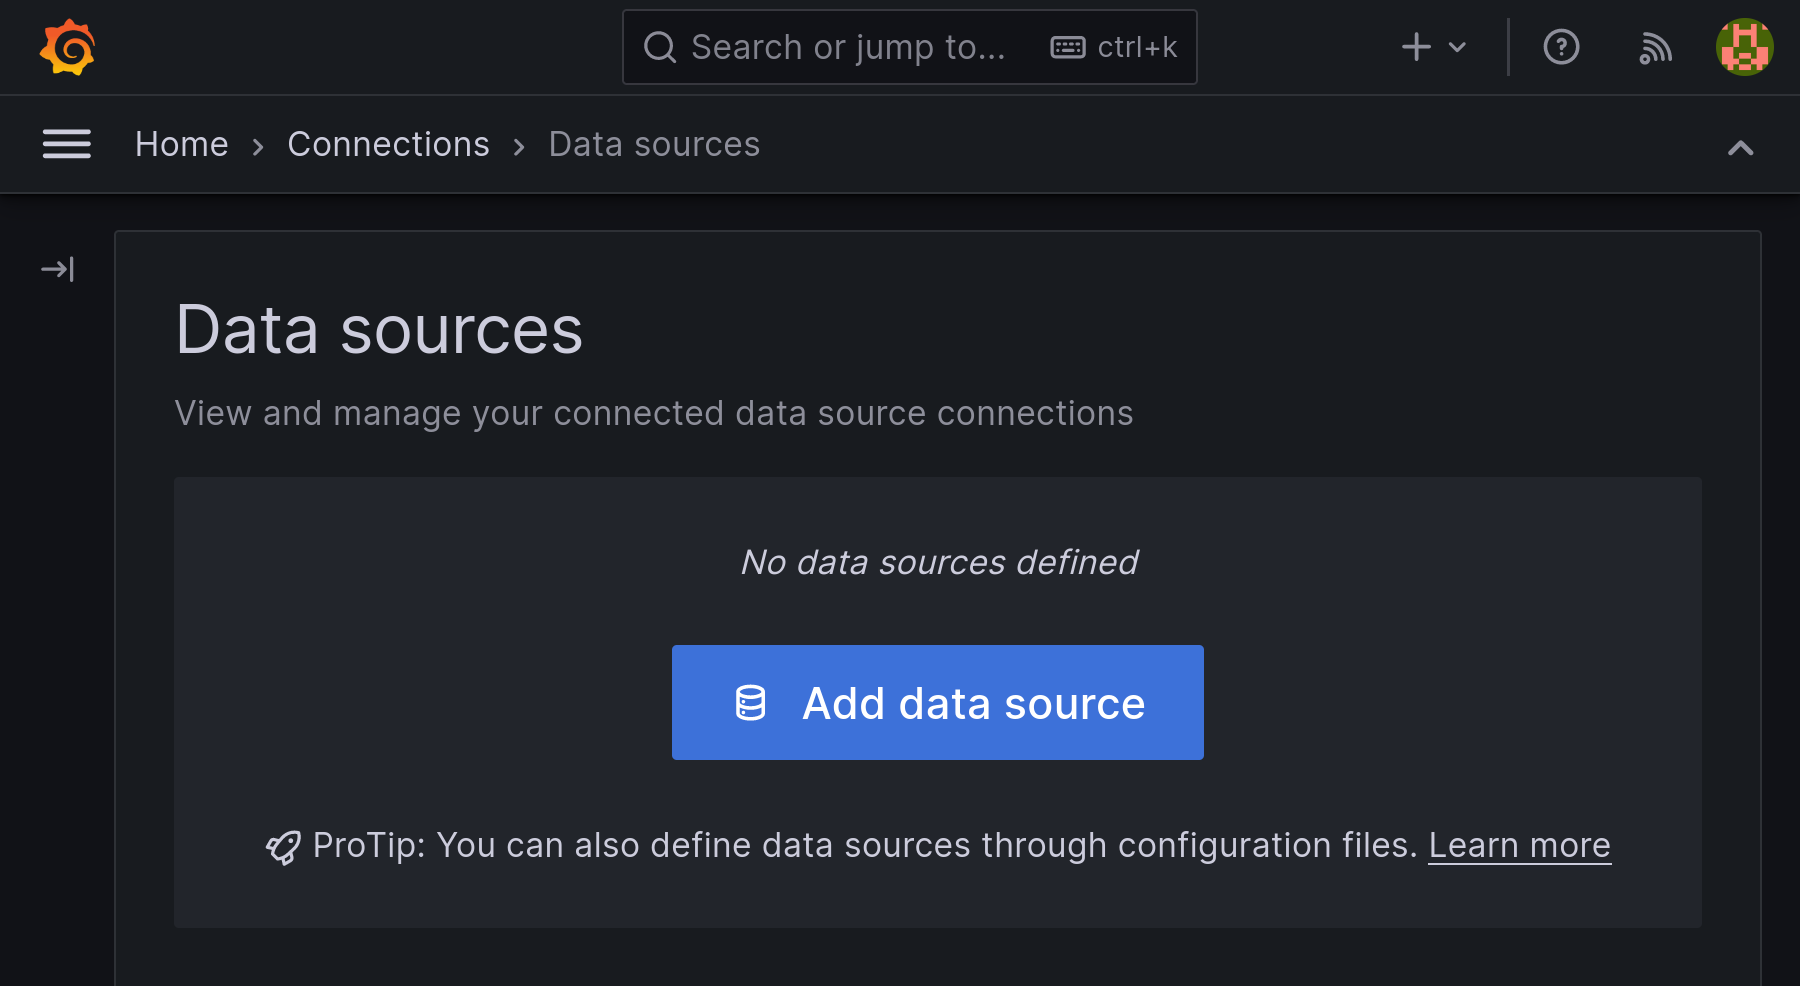
Once the necessary files have been installed, you can activate the plug-in in Grafana. To do this, switch to the configuration and select the Data sources option. Here you can add a new data source using the Add data source button:
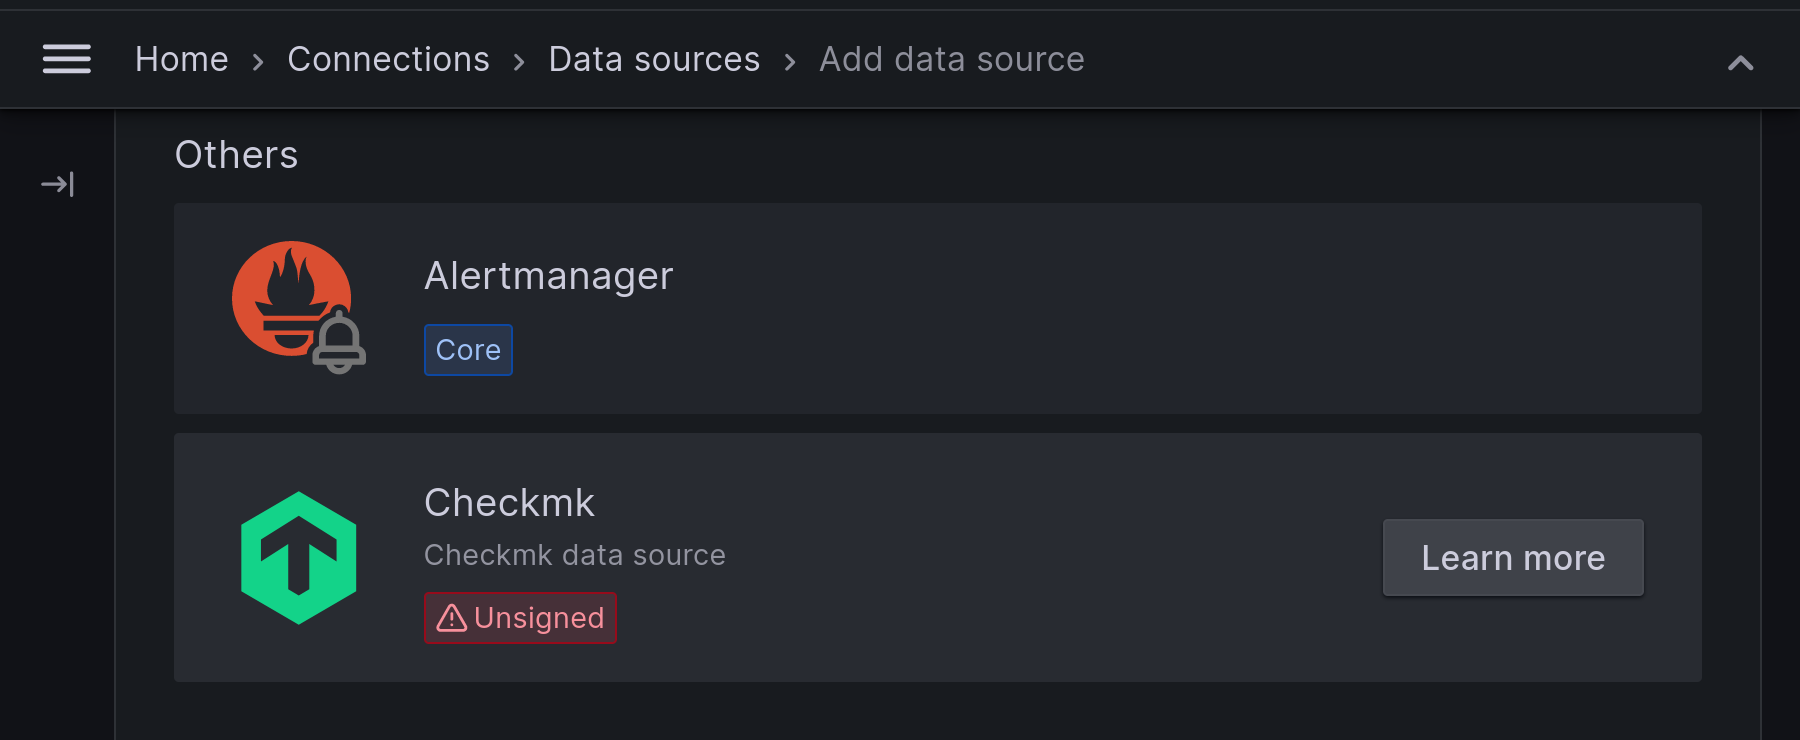
The entry for Checkmk can be found in the Others category:
The template for this data source is quite simple. Enter the URL for your site, the type of your edition and the user you have just created for Grafana. Important: If you use Checkmk in a distributed environment, enter the URL to your central site here:
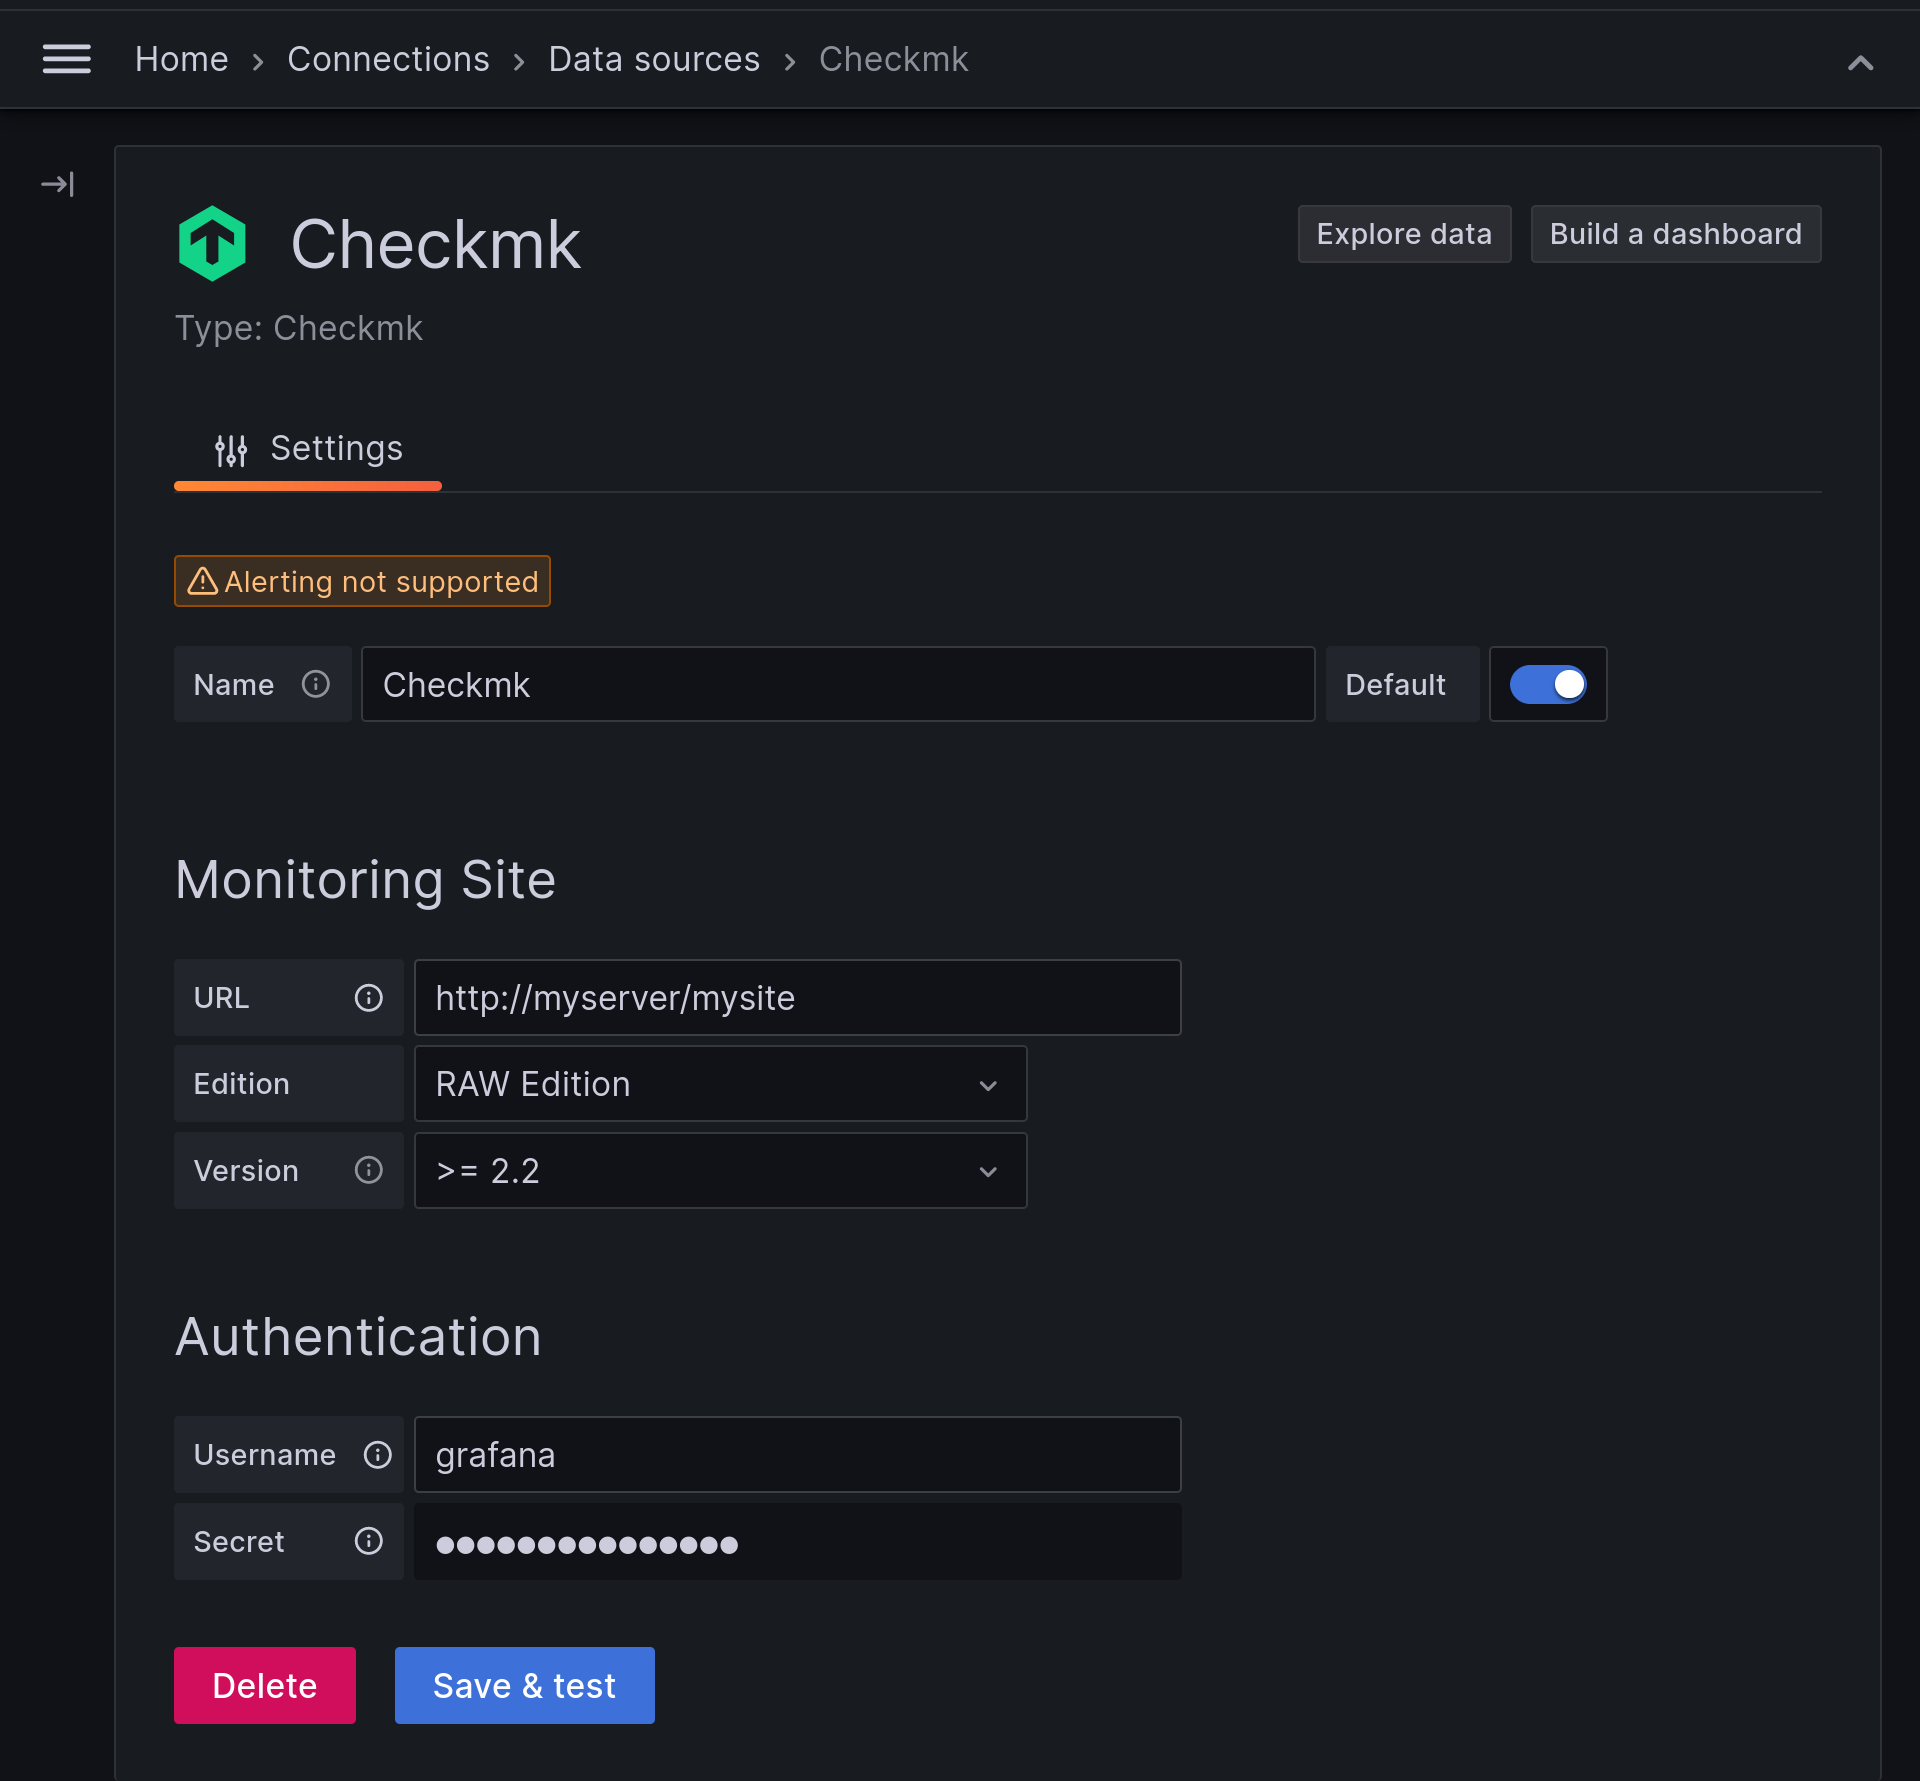
If you want to connect several Checkmk sites, you can optionally give each individual connection a unique name.
Otherwise, simply leave the default as Checkmk or Checkmk for Cloud Edition.
Once you have saved the connection with the Save & test button, it will be available to you as a data source in Grafana and you can configure your first graphs.
5. Creating graphs
5.1. Creating a blank dashboard
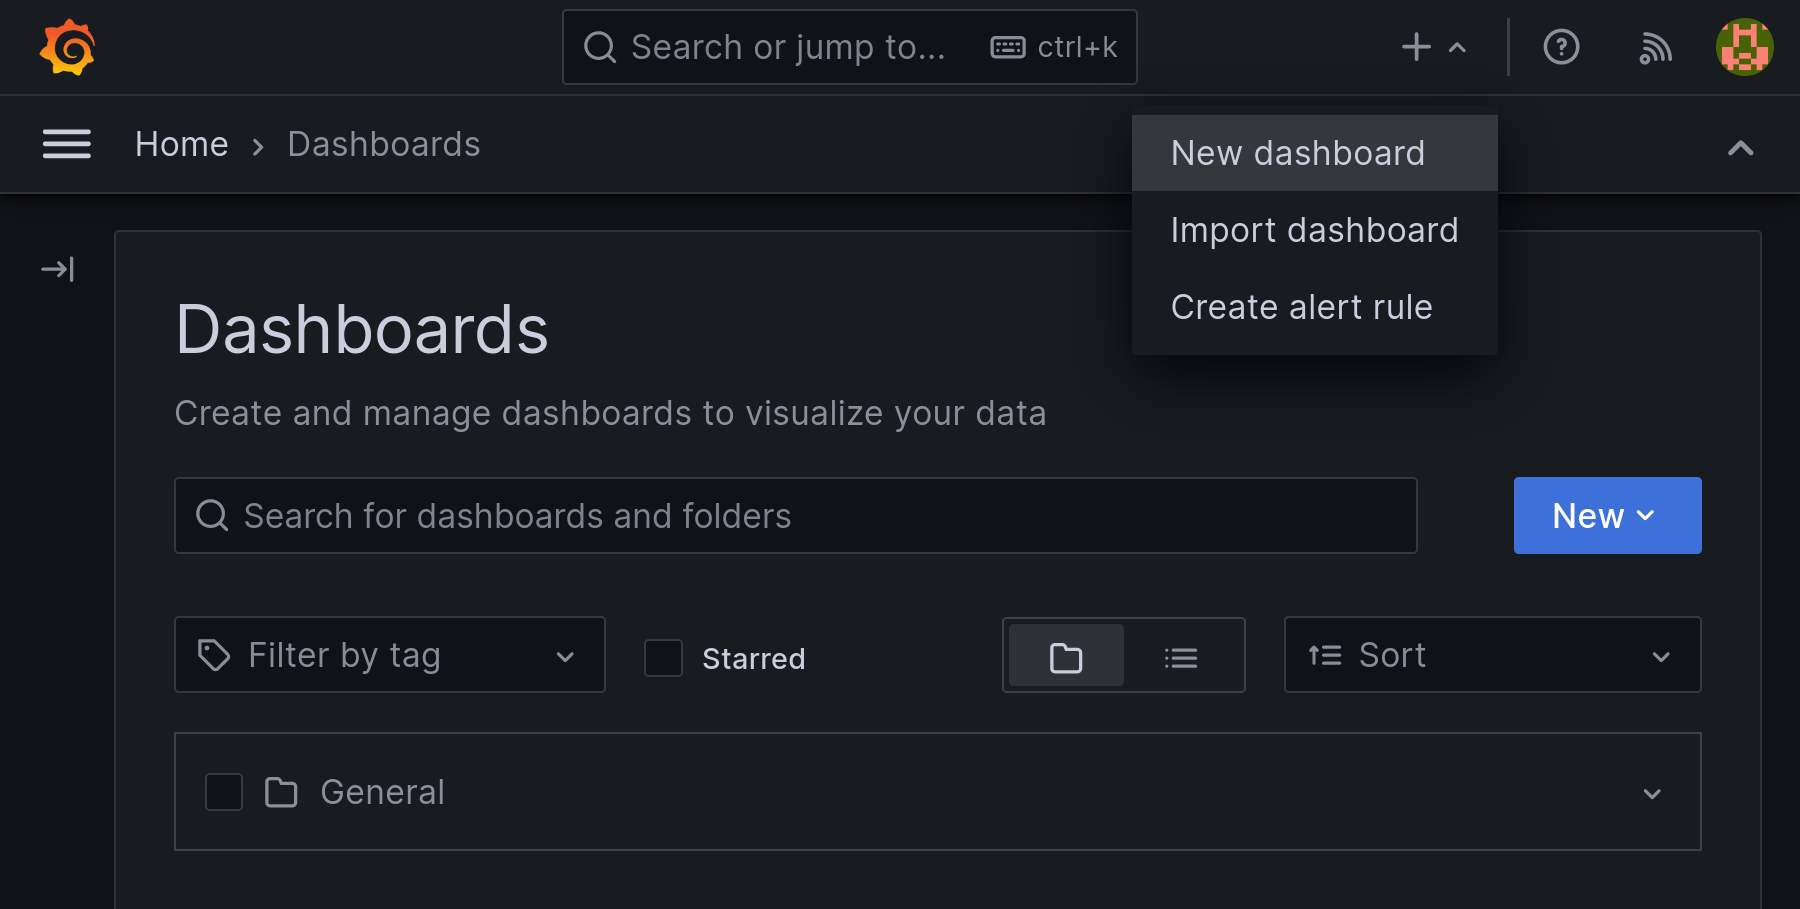
Under Home > Dashboards you will find a drop-down menu marked with a plus sign. Click on New dashboard to create a new dashboard:
5.2. Displaying a single host metric
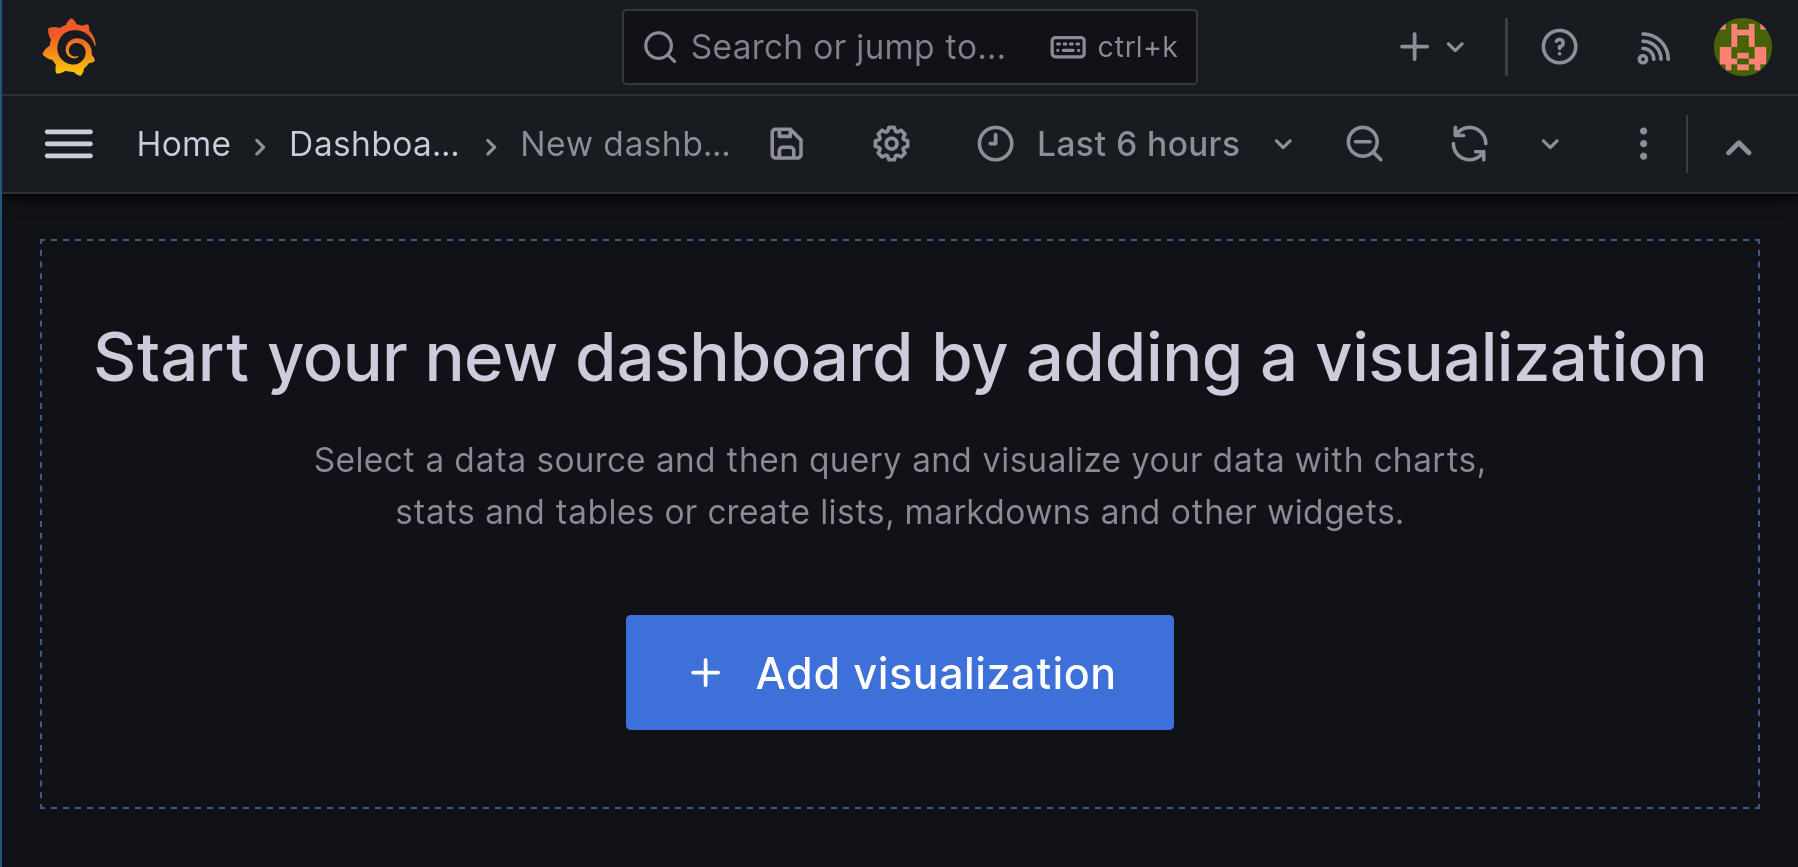
The simplest dashboard shows a single graph for a host’s service. This can also be the metric from a local check for which no ready-made graphs exist. Create a new visualization in an existing dashboard or the one you have just created. First select Add visualization here:
Creating a visualization takes you to the selection of the data source. After selecting Checkmk, you are directly in the editing mode of the Query for the newly created panel. A panel is a container for a visualization.
Access to the data to be visualized differs slightly between the ![]() Checkmk Raw Edition and the commercial editions:
In the Raw Edition you work with predefined menus — for site, host name, service and so on.
In the commercial editions, you have the option of defining cascades of filters.
This allows a very detailed selection, also using regular expressions.
The following simple example has been chosen so that you can run through it with all editions.
Checkmk Raw Edition and the commercial editions:
In the Raw Edition you work with predefined menus — for site, host name, service and so on.
In the commercial editions, you have the option of defining cascades of filters.
This allows a very detailed selection, also using regular expressions.
The following simple example has been chosen so that you can run through it with all editions.
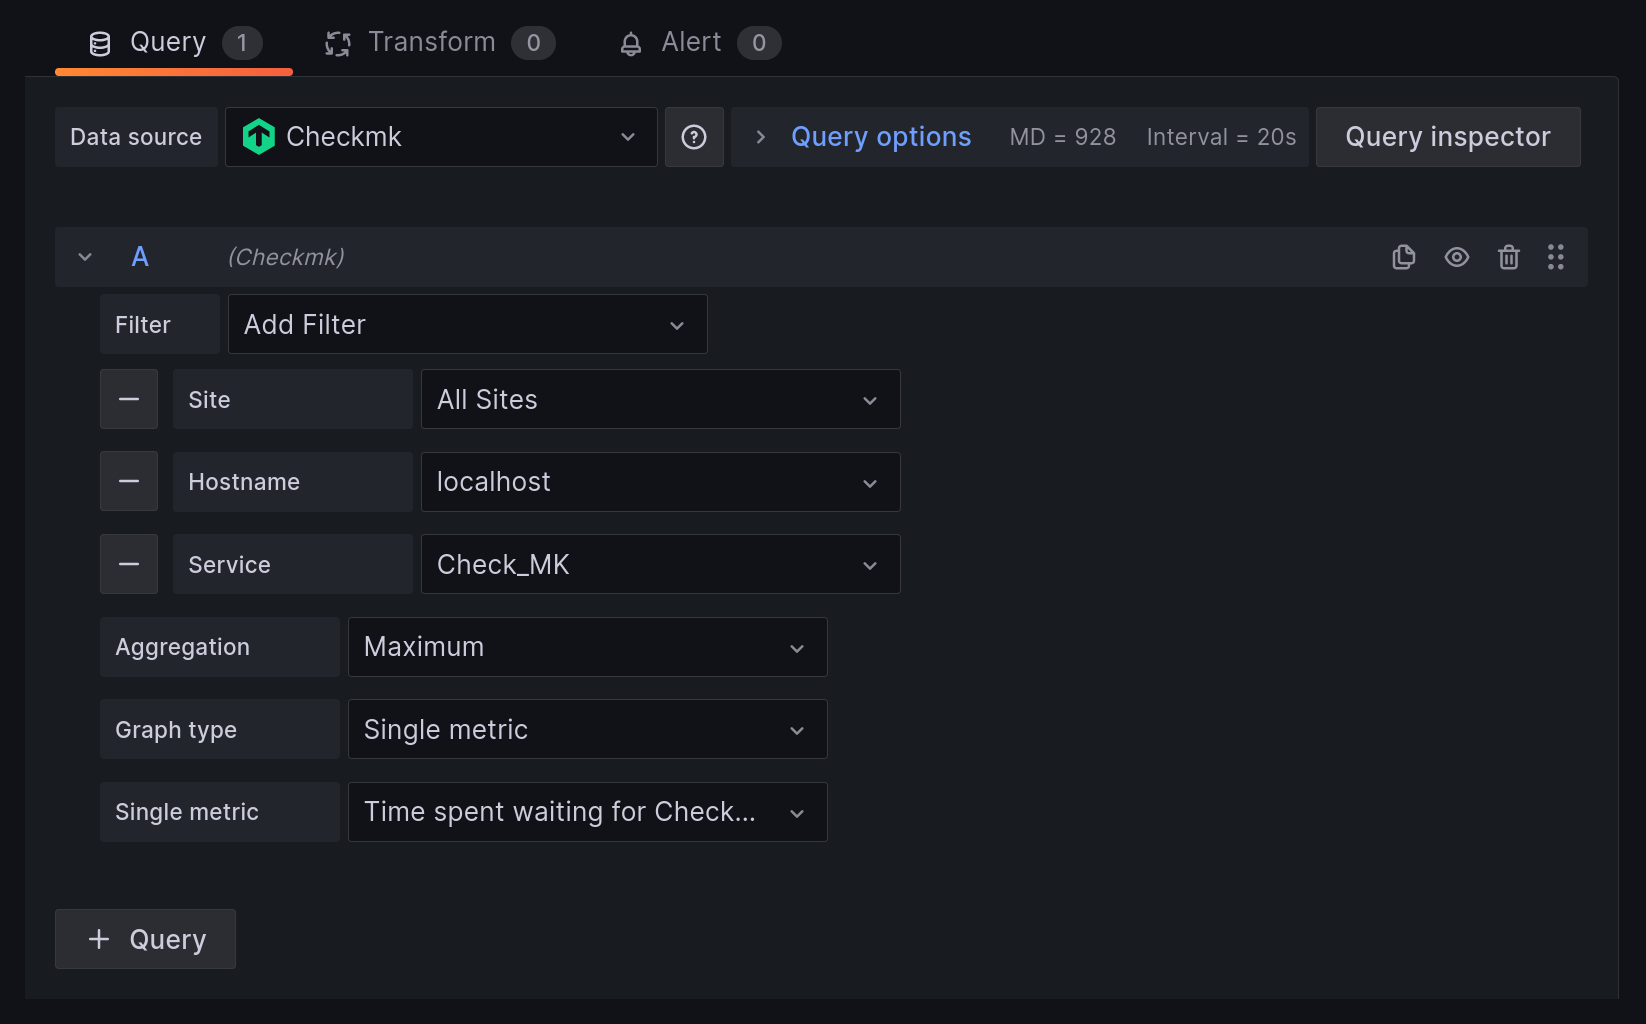
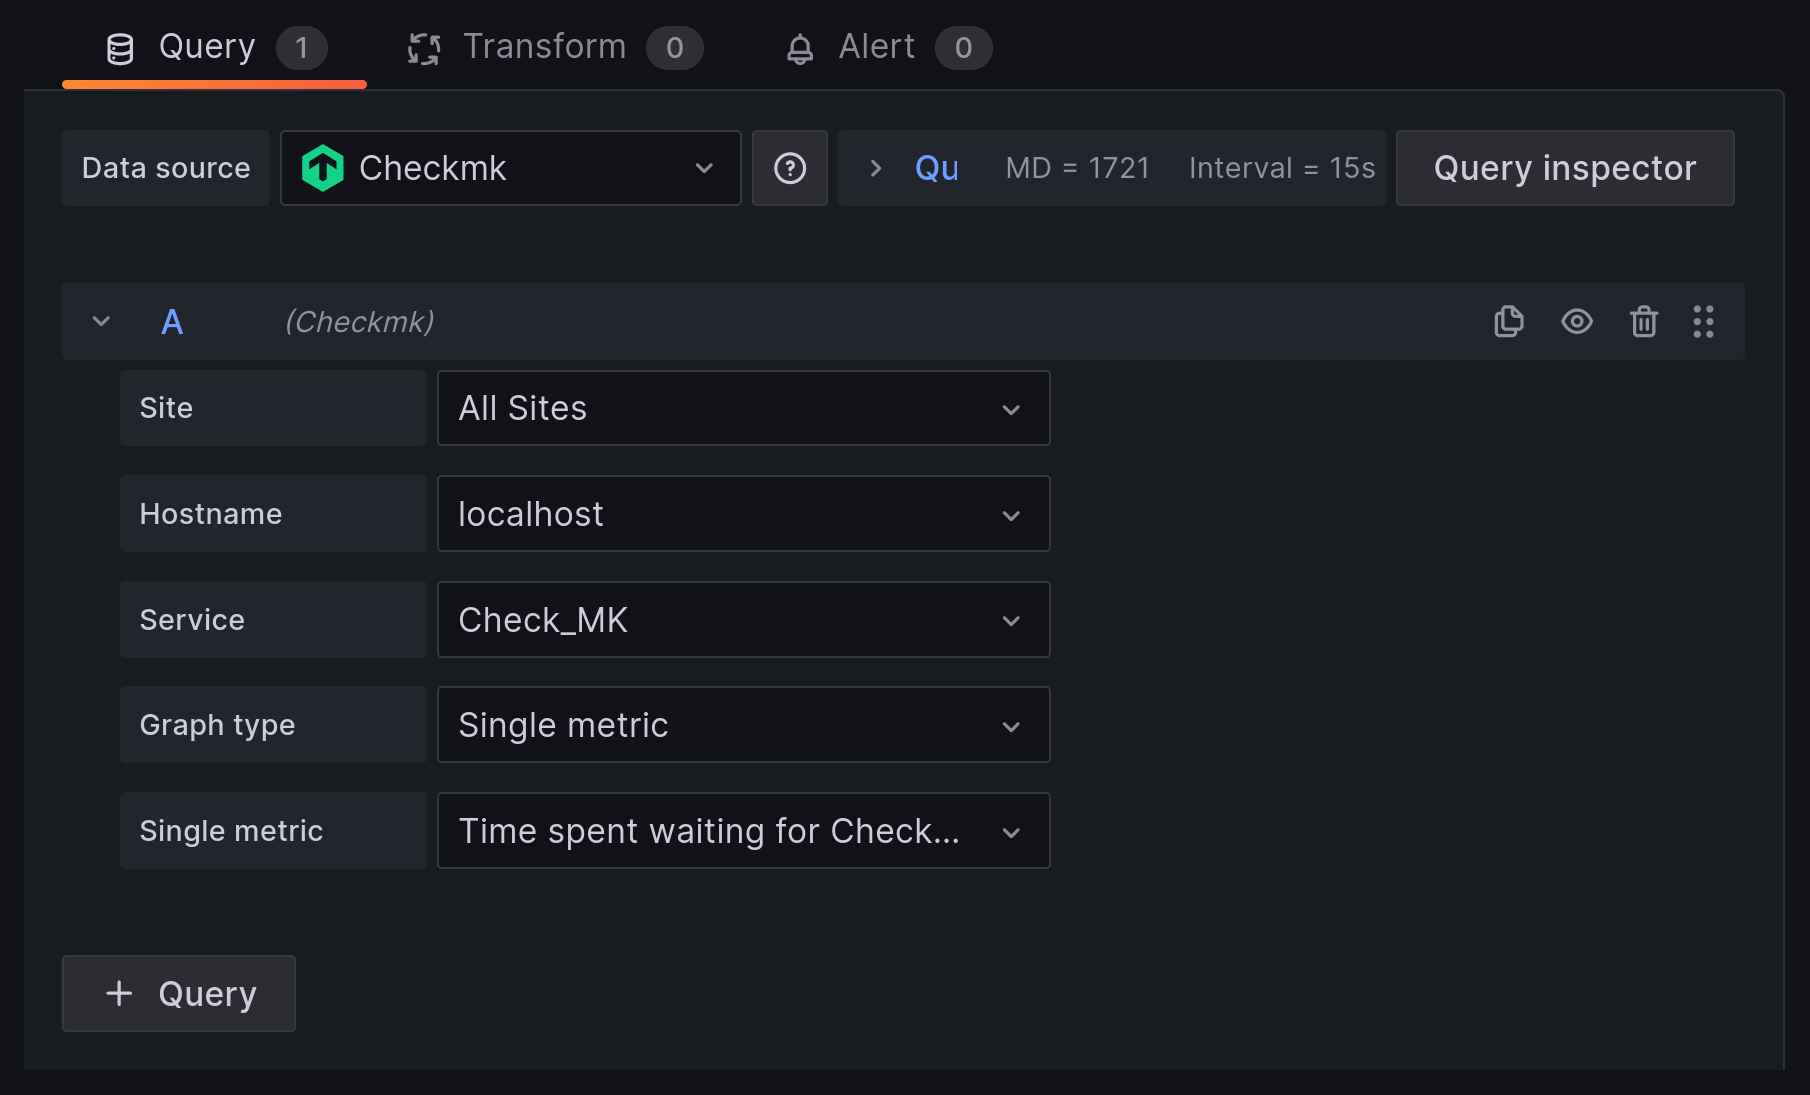
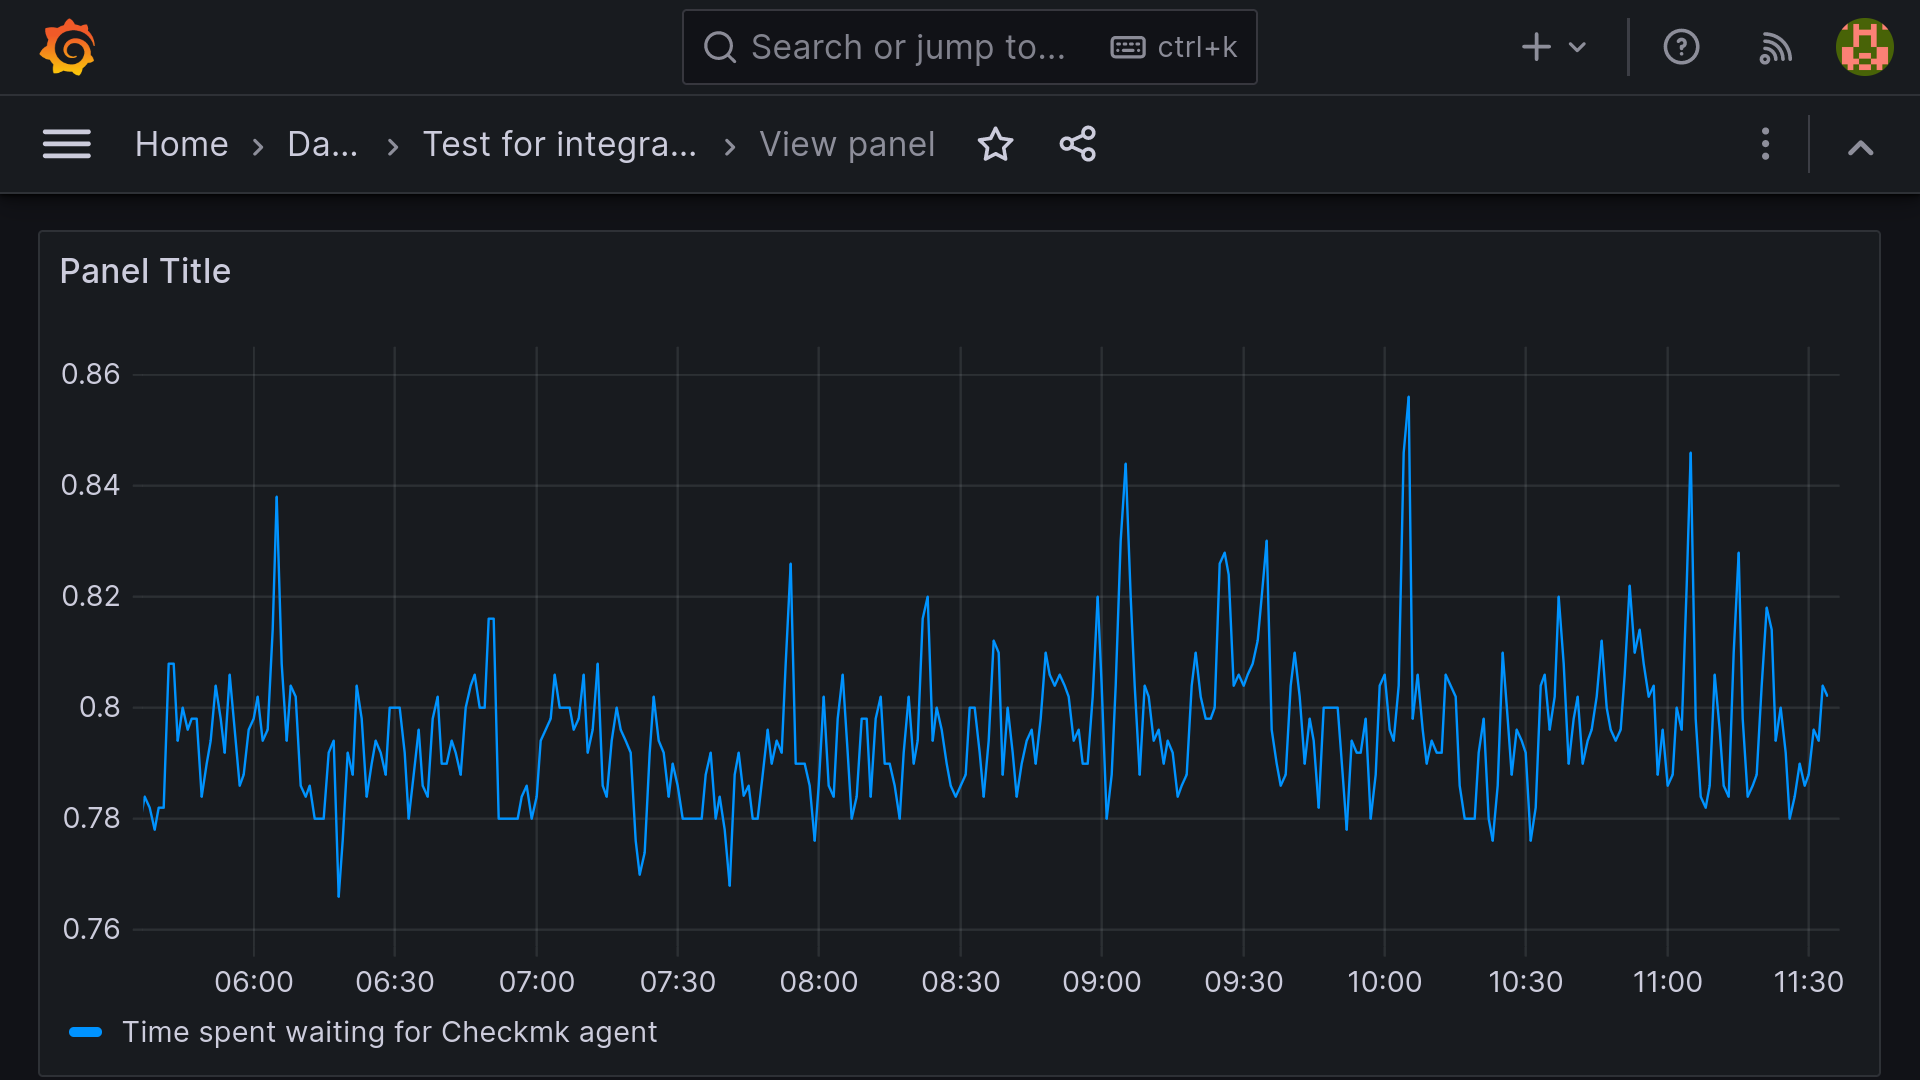
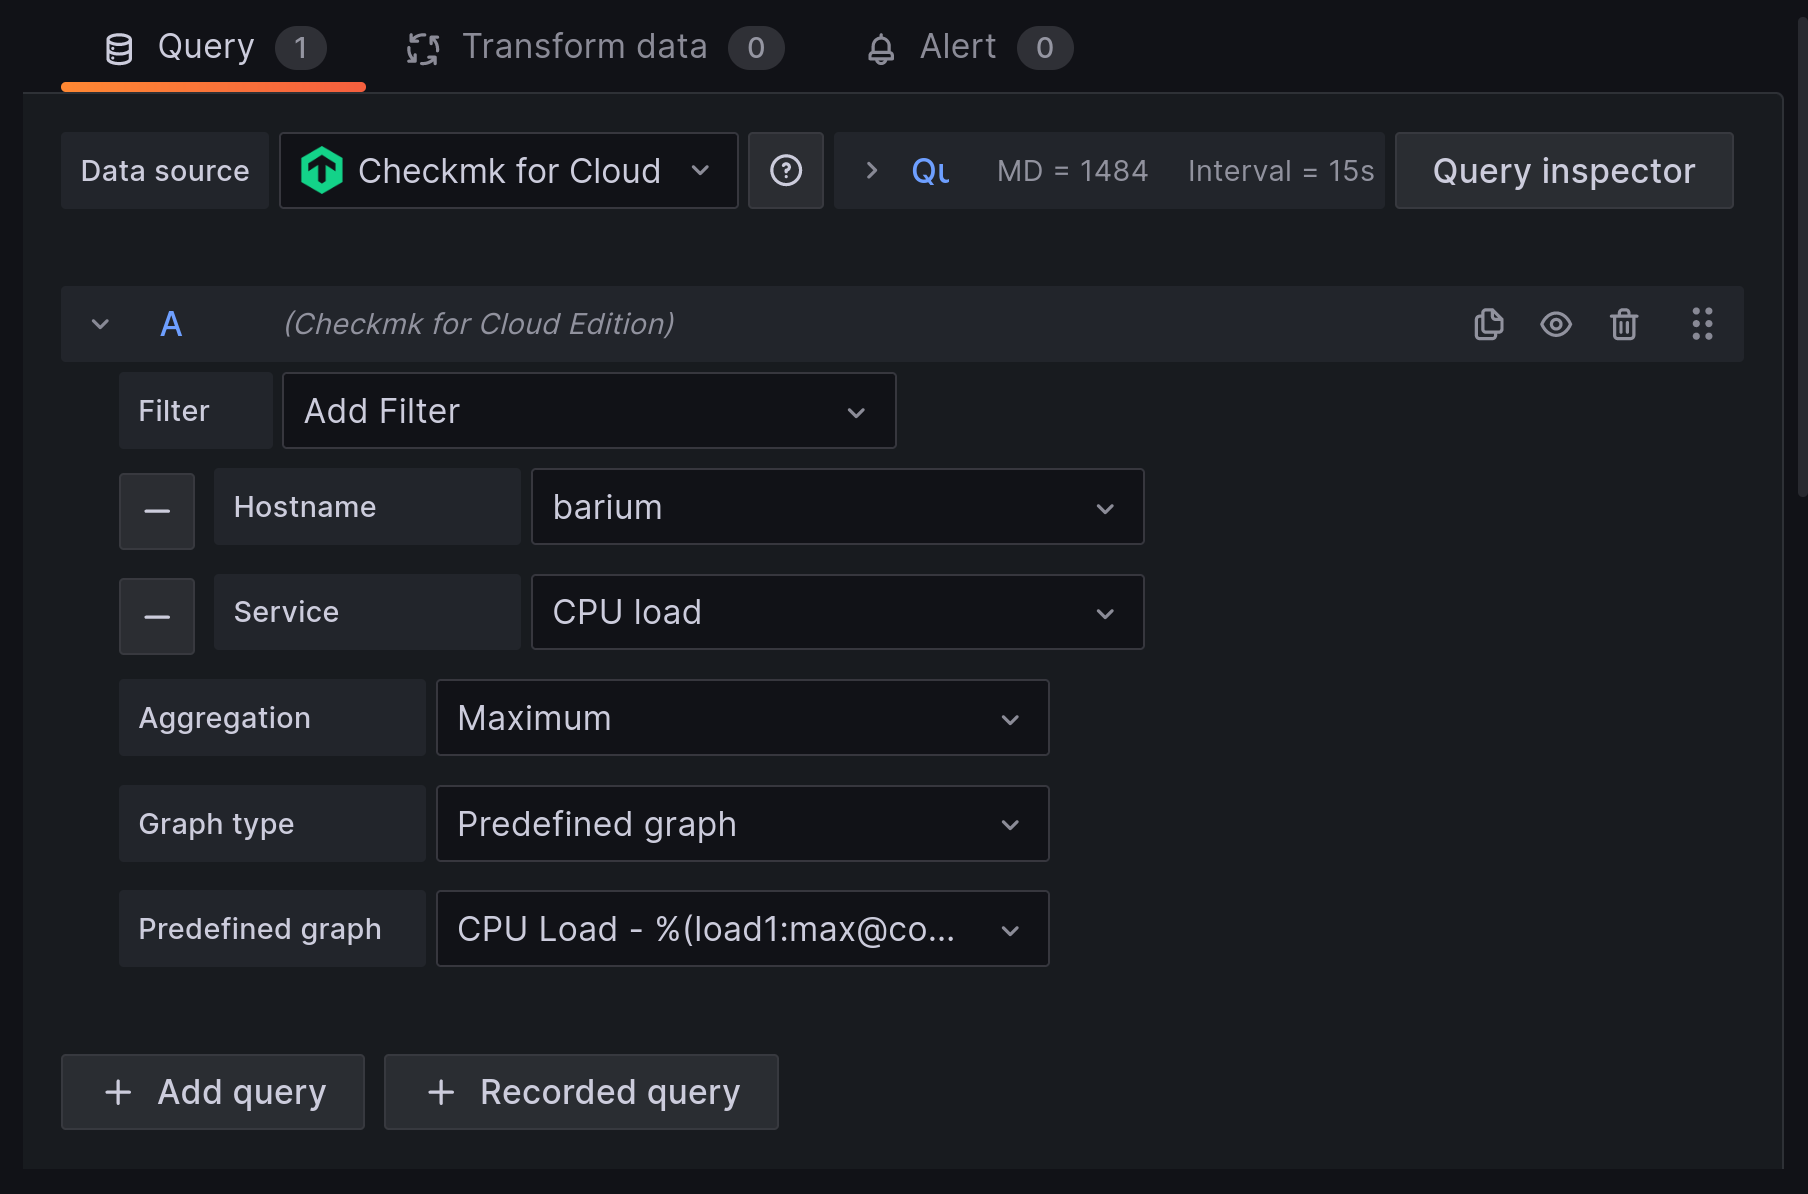
First select the Site, then filter for a Hostname in the monitoring. For the first test, use any host that uses the Windows or Linux agent. Select Check_MK as the Service. Set the type of Aggregation to Maximum. The Graph type available for selection is Single metric or Predefined graph: Predefined graphs take metrics from Checkmk, which can also contain combined graphs. Our screenshots here show the Single metric, which contains the total execution time of the agent (Time spent waiting for Checkmk agent).
Grafana displays the result directly. With the Apply button you can apply the graph without saving the dashboard. With Save you are prompted to enter a title for the new Dashboard and can then save the newly created dashboard.
5.3. Displaying a predefined graph from Checkmk
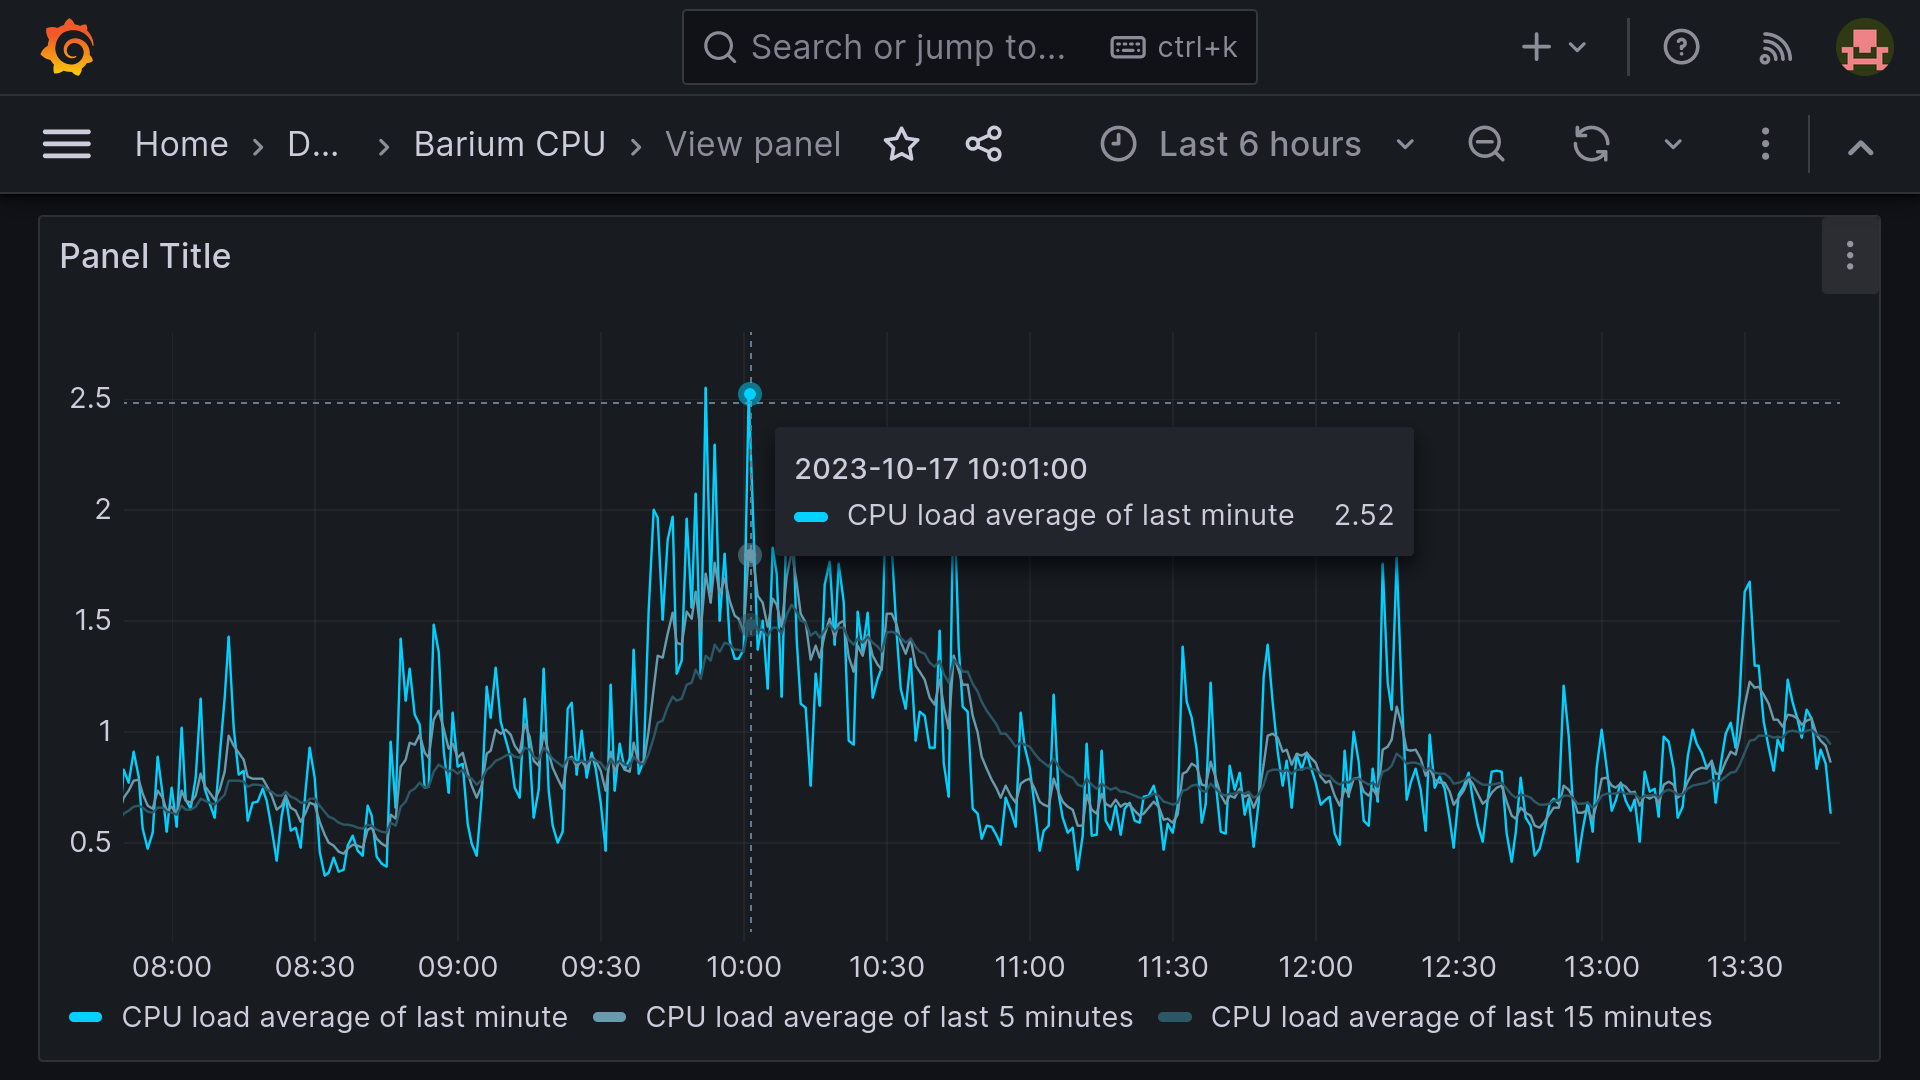
The developers of Checkmk have already compiled many related metrics into common graphs to make it easier for users to get an overview of the various aspects of a single resource. You can display the metrics from such a ready-made graph directly in Grafana.
The procedure is initially the same as explained in the previous section. However, to complete the process select the Graph type entry Predefined graph and the Predefined graph for the service to be used.
If you receive an error message that the selection of combined metrics with more than 200 elements is not permitted, use additional filters to restrict the selection. If in doubt, move the filters that will significantly limit the result to the front of the set.
Once you are satisfied with your selection, click the Apply button. The graph will now be available in the selected dashboard.
5.4. Creating complex graphs
Especially in a dynamic cluster, you will often want to be able to track the entire progress of a metric across all participating hosts without having to customize a graph every time a new node is added or removed. To achieve this, there are various options for dynamically adapting graphs.
The first option is to filter by Host Labels or Host Tags instead of selecting individual hosts.
Another option is to use regular expressions.
You can apply regular expressions to hosts or services.
In the following example, filesystem matches all services that contain filesystem — regardless of how many file systems a host has mounted.
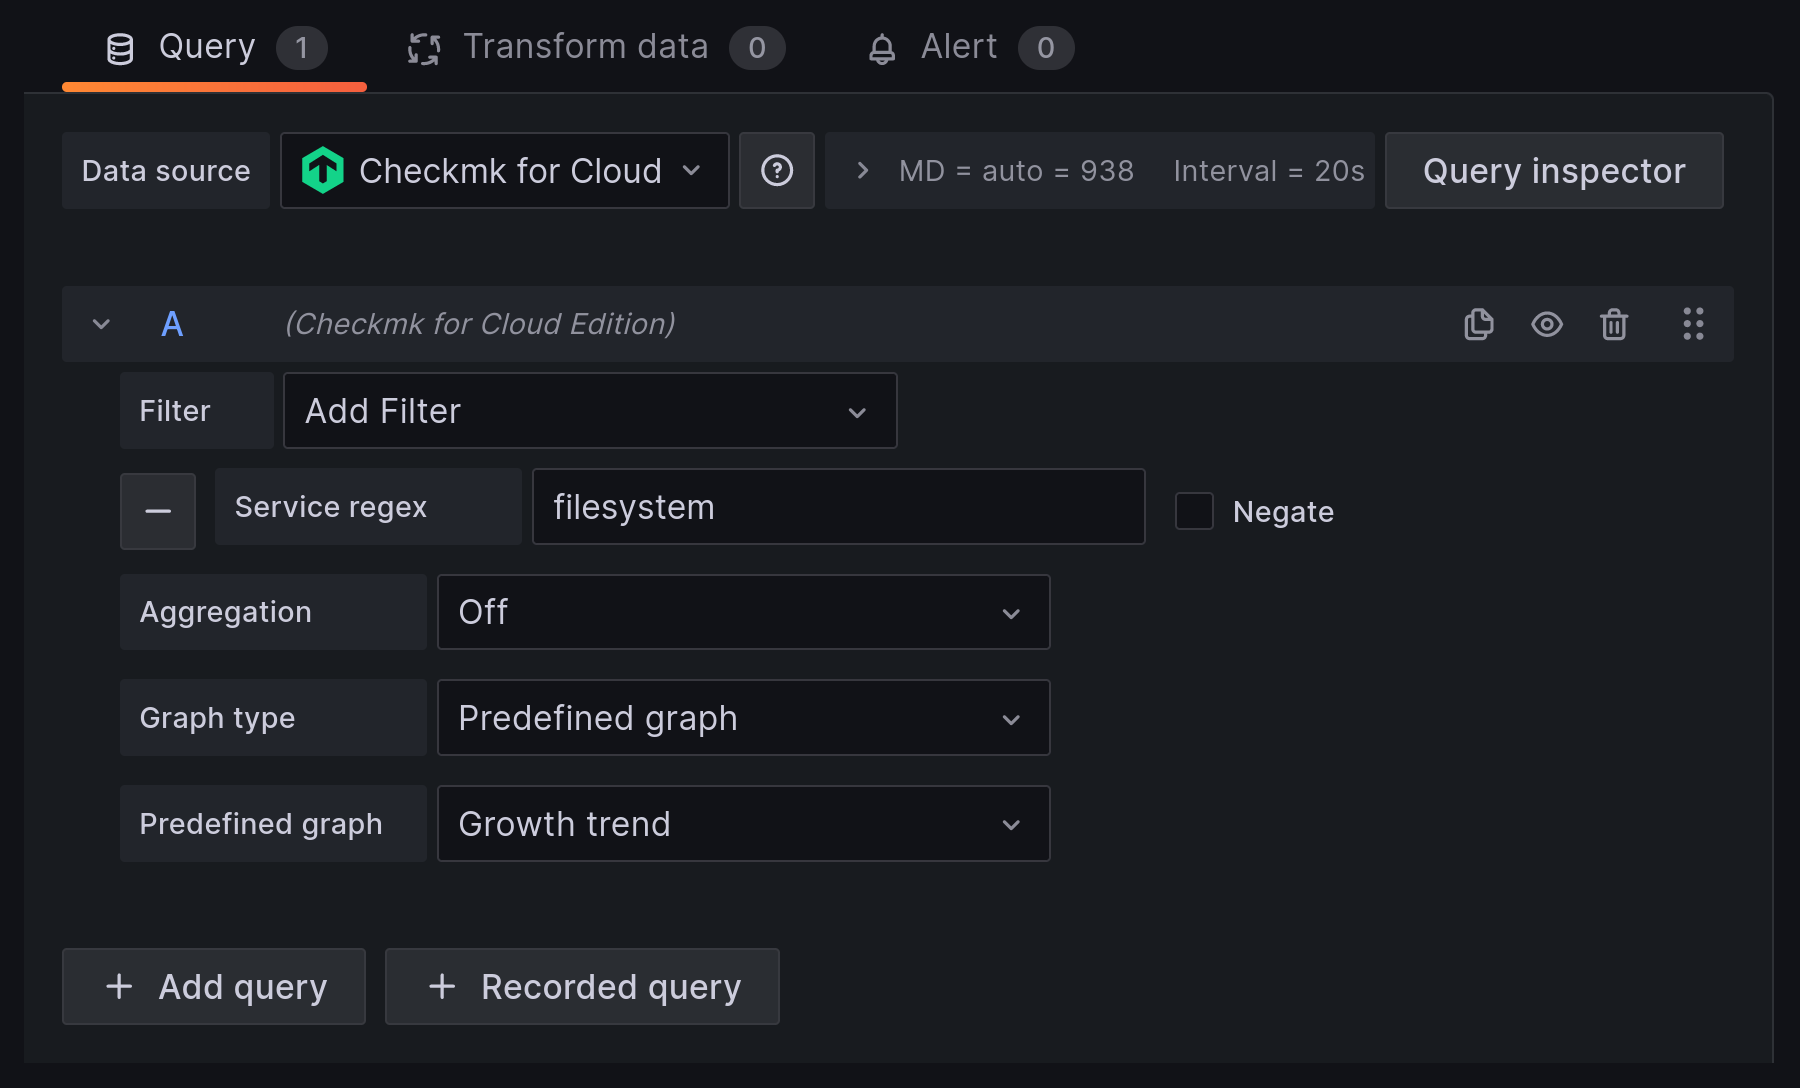
With filesystem.*nvme you would restrict the selection to all file systems on NVMe drives, no matter which file system type they use, since the part of the string between filesystem and nvme can be arbitrary.
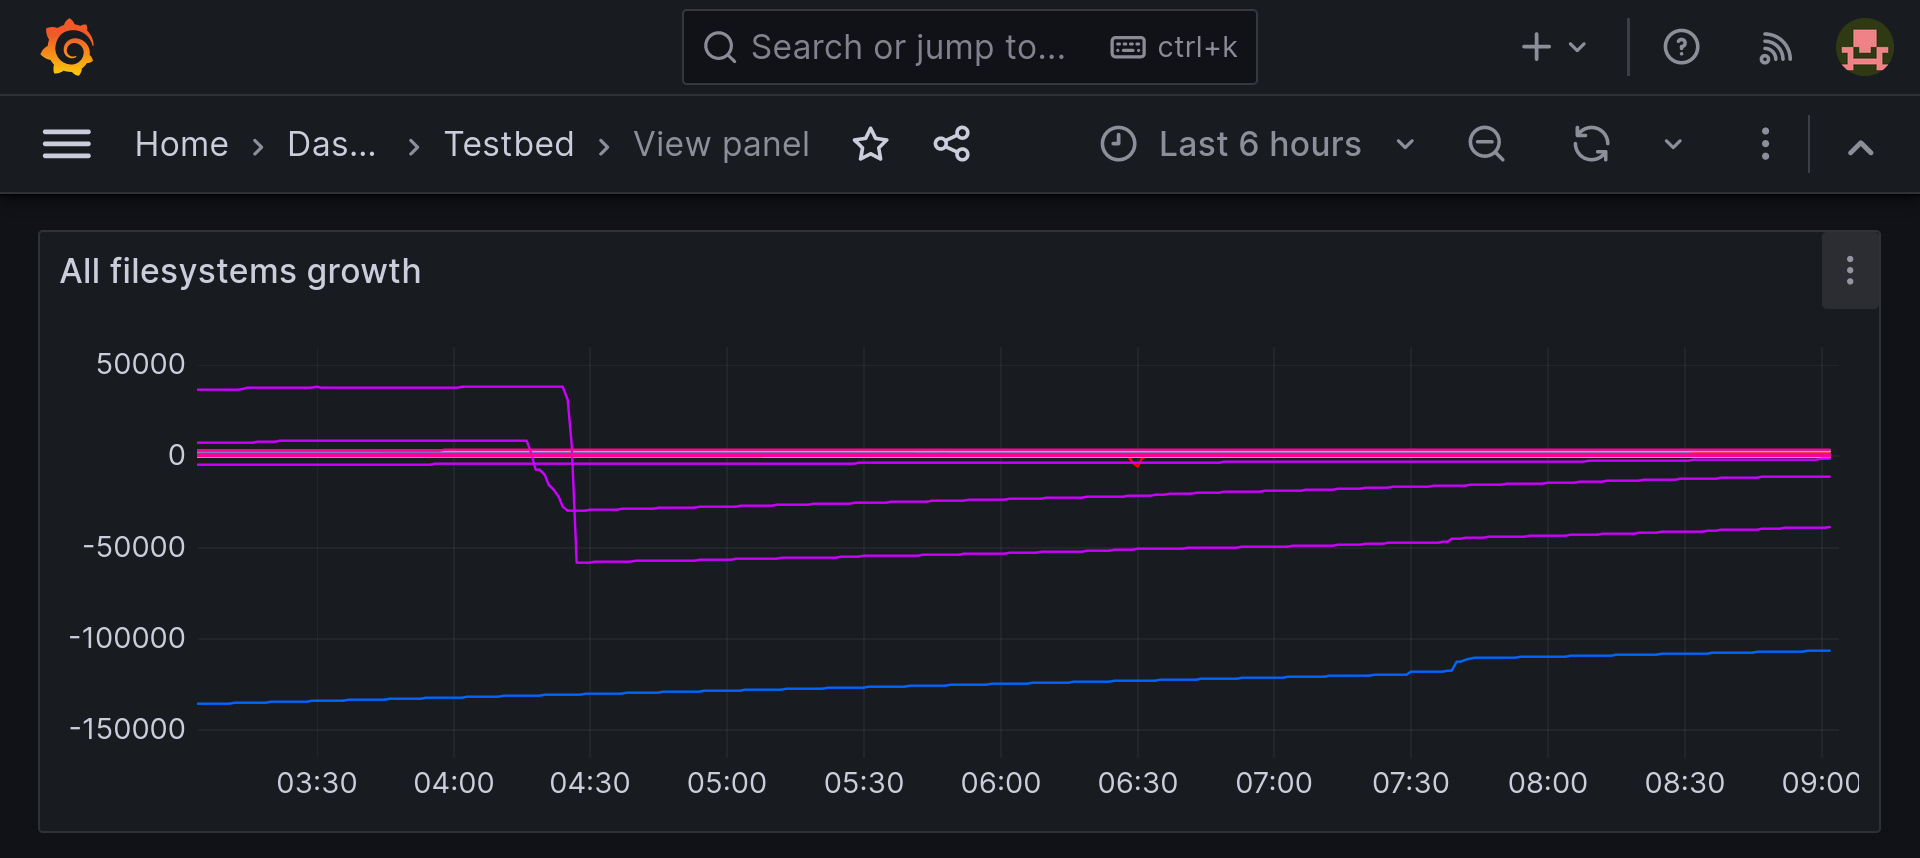
In addition to the extended filter options, use Aggregation to determine the display of the metrics in the graph and Graph to determine which graph is to be used as a reference. Note that metrics for a host/service are only displayed if it also has the selected graph. A graph could then look like this, for example:
5.5. Renaming using regular expressions
In each panel’s edit mode, you will find a Transform tab.
You can use the Rename by regex sub-item available here to reorder the names of metrics or suppress information that is not required.
Our following example searches for two groups of characters separated by a comma followed by a space, swaps them and explicitly places Service and Host at the front:
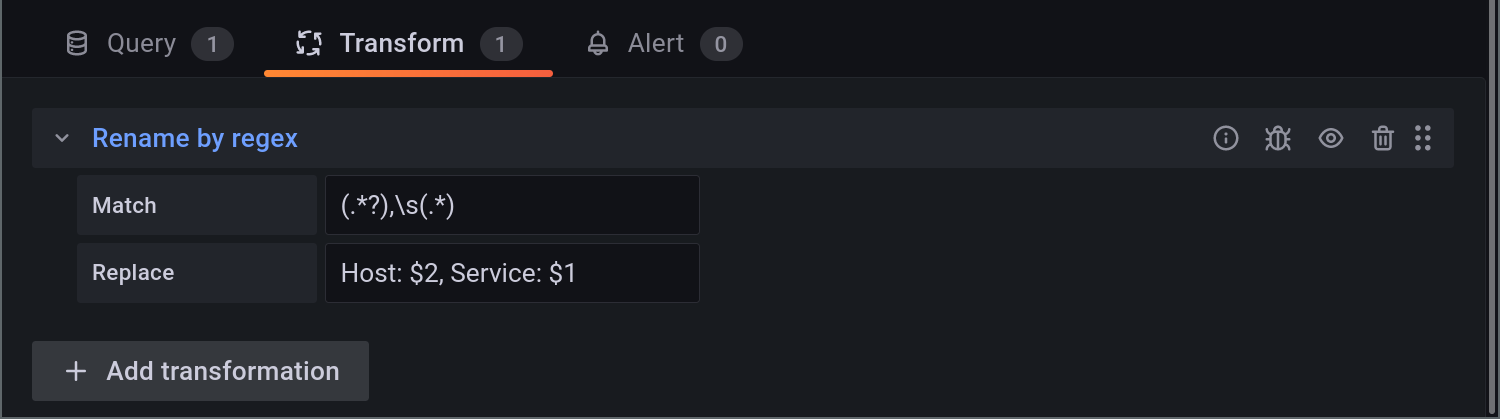
The variables $1 and $2 correspond to the strings 'captured' in the line above (match groups or capture groups).
Grafana also allows nested match groups.
The corresponding section in the article on regular expressions provides an overview of the possibilities available for these.
6. Making graphs more flexible using variables
You can use variables to flexibly add graphs to dashboards. This allows you to determine the host of a specific metric via a drop-down selection or you can use variables to simultaneously add graphs for multiple hosts to a dashboard. This article cannot and should not replace the documentation for Grafana. First and foremost, here we want to provide an overview of the possible applications and an introduction to the topic.
Variables can be created from queries. In this case, you can filter on sites, hosts or services. Alternatively, there is also the option of defining quantities or free text fields, which allows you to create any number of filters.
6.1. Creating variables
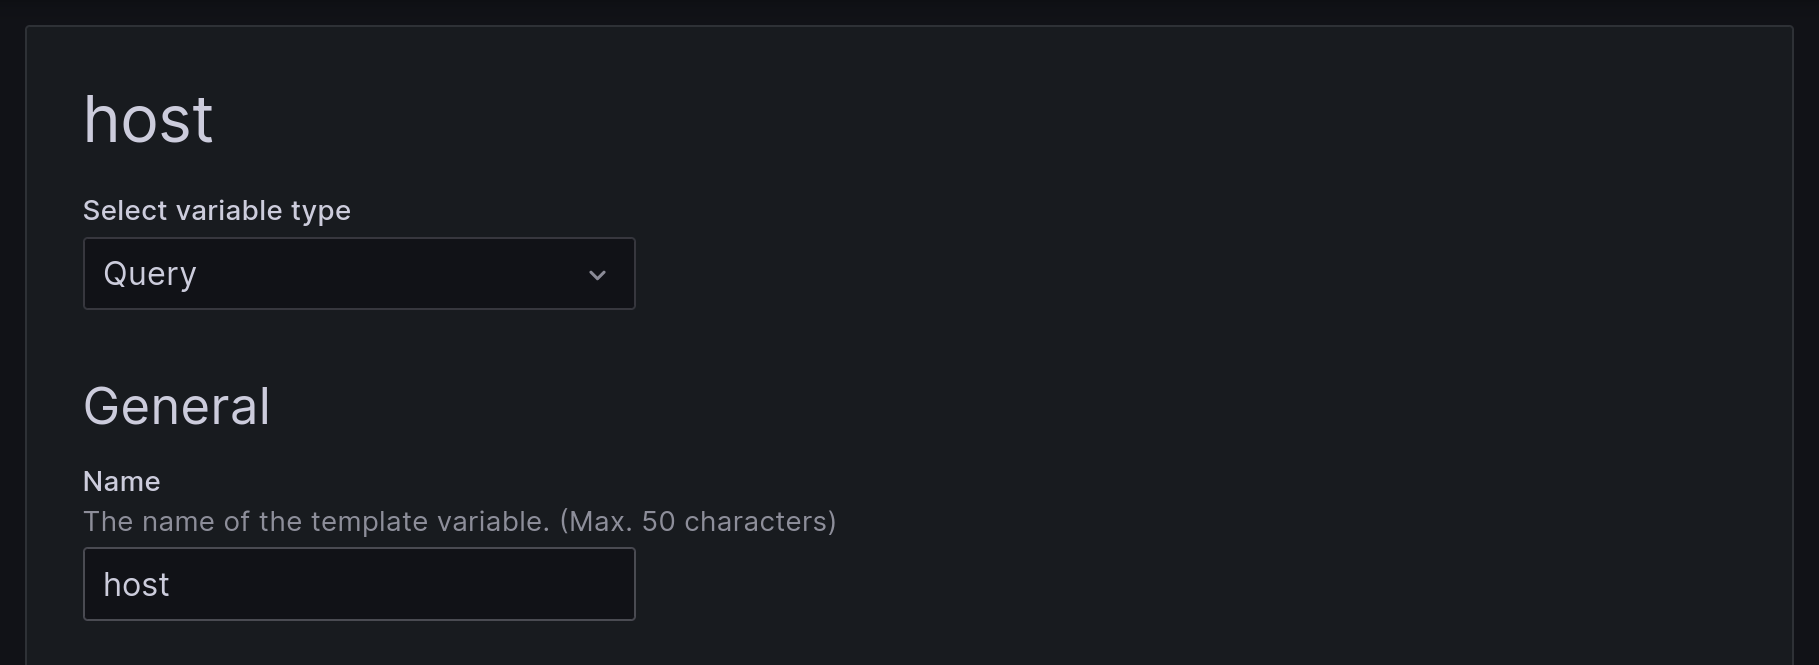
Each variable is a property of a dashboard. It must be created in the dashboard settings and can then only be used within this dashboard. As query requires the most extensive configuration, we will show its use in our example.
The relevant properties for a variable are its type and its name; all other properties are only used for the purpose of clarity in the dashboard.
The name should differentiate between variables.
So if you plan to use several variables to select hosts from different subsets, use a name that references this set instead of host as in the example, for example host_from_linuxservers.
host in the dashboard propertiesWhen selecting a data source, make sure that a Checkmk connection is selected. You can further restrict the selected object type, for example with regular expressions. Any filters used are evaluated on the Checkmk server. In contrast, the following fields Regex and Sort are evaluated by Grafana.

The two checkboxes for Selection options at the bottom of the page can be optionally used later depending on need. You can modify these settings at any time if required; for the first test, leave both at the (empty) default setting. Save the variables using Save dashboard when you have made all the settings.
6.2. Using variables for graphs
You can now enter the assigned variables in the appropriate fields to create a flexible graph. The variables can also be used in the graph’s title.
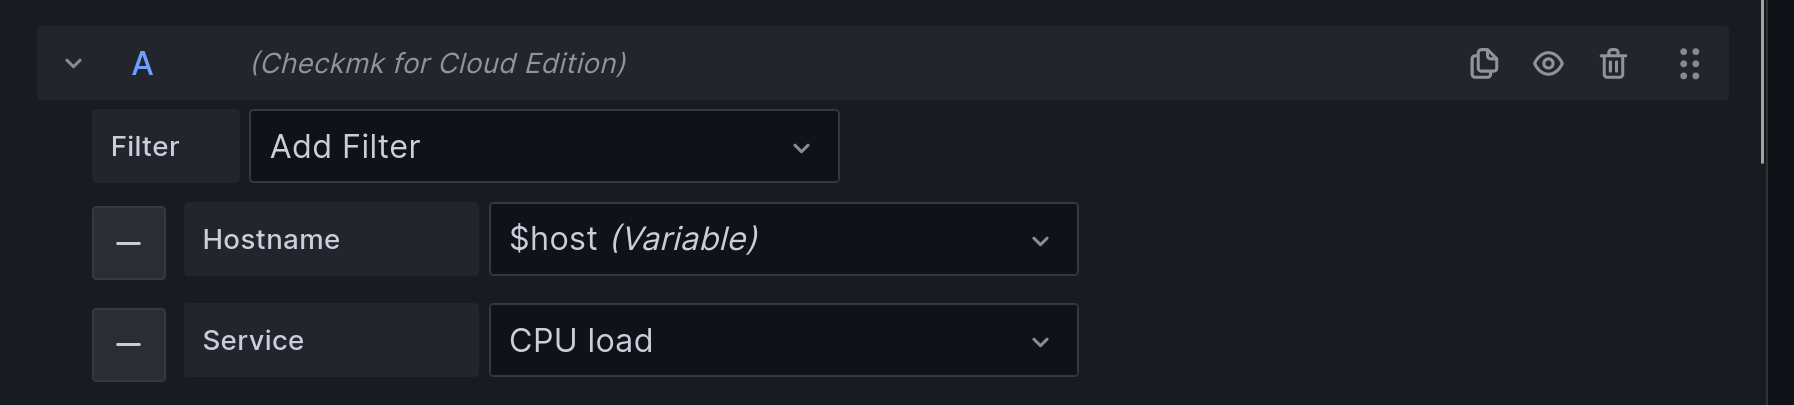
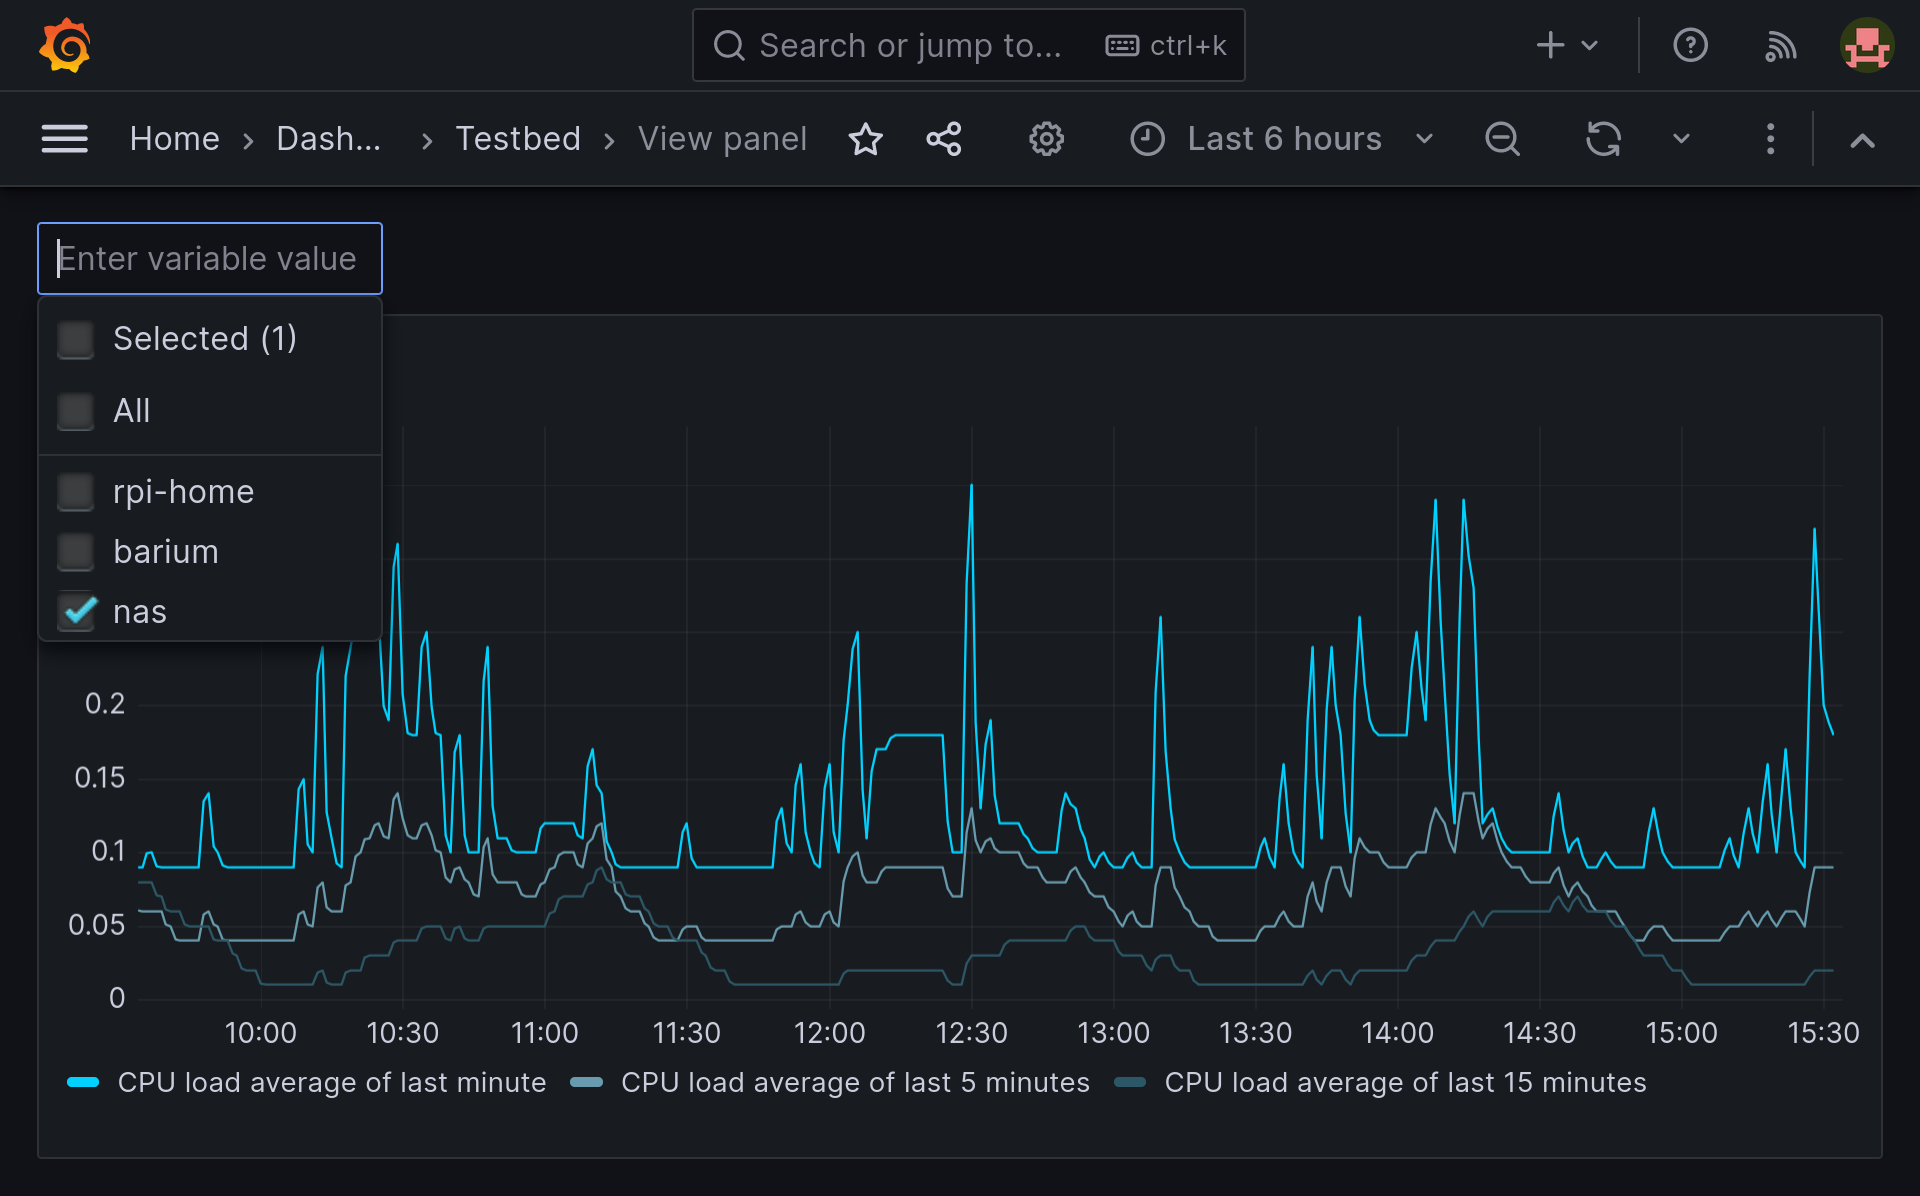
A drop-down selection for each variable is displayed in the dashboard, which you can use to set the variable values (hosts, services…) which you want to display on the dashboard. If you have activated multiple selection, you can set the Repeat by variable option in the panel settings to display the panel for each selected variable’s value.
7. Files and directories
The following files and directories are relevant on a self-hosted Grafana server.
| File path | Description |
|---|---|
|
Here Grafana searches for (new) plug-ins. Each plug-in has its own subdirectory. The plug-in from Checkmk should therefore be placed here. |
|
Grafana configuration directory. |
|
Grafana’s central configuration file. Here you define which unsigned plug-ins you allow. |