1. Introduction
1.1. Events are not states
The main task of Checkmk is the active monitoring of states. At any point in time, each monitored service has one of the states, OK, WARN, CRIT or UNKNOWN. Through regular polling the monitoring constantly updates its picture of the current situation.
A completely different type of monitoring is that which handles events. An example of an event is an exception that occurs in an application. The application may remain in the OK state and continue to run correctly — but, something has happened.
1.2. The Event Console
With the Event Console (EC for short), Checkmk provides a fully integrated system for monitoring events from sources including syslog, SNMP traps, Windows Event Logs, log files and own applications. Events are not simply defined as states, but they form a category of their own and are in fact displayed as separate information by Checkmk in the sidebar’s Overview.

Internally, events are not processed by the monitoring core, but by a separate service — the Event daemon (mkeventd).
The Event Console also has an archive where you can search for past events. However, it should be said right away this is not a substitute for a proper log archive. The task of the Event Console is the intelligent filtering of a small number of relevant messages from a large stream. It is optimized for simplicity, robustness and throughput — not for storing large volumes of data.
A brief outline of the EC’s functionality:
It can receive messages directly via syslog or SNMP traps. Therefore a configuration of the corresponding Linux system services is not necessary.
It can also evaluate text-based log files and Windows Event Logs using the Checkmk agents.
It classifies messages based on chains of user-defined rules.
It can correlate, summarize, count, annotate and rewrite messages as well as consider their temporal relationships.
It can perform automated actions and send notifications via Checkmk.
It is fully integrated into the Checkmk user interface.
It is included and ready for use in any current Checkmk system version.
1.3. Terminology
The Event Console receives messages (mostly in the form of log messages). A message is a line of text with a number of possible additional attributes, e.g. a timestamp, a host name, etc. If the message is relevant, it can be converted directly into an event with the same attributes, but:
A message will only be turned into an event if a rule takes effect.
Rules can edit the text and other attributes of messages.
Multiple messages can be combined into one event.
Messages can also cancel current events.
Artificial events can be generated if certain messages fail to appear.
An event can go through a number of phases:
Open |
The 'normal' state: Something has occurred: the operator should attend to it. |
Acknowledged |
The problem has been acknowledged — this is analogous to host and service problems from status-based monitoring. |
Counting |
The required number of specified messages have not yet arrived: the situation is not yet problematic. The event is therefore not yet displayed to the operator. |
Delayed |
An error message has been received, but the Event Console is still waiting whether the appropriate OK message will be received within a configured time. Only then the event will be displayed to the operator. |
Closed |
The event has been closed by the operator or automatically by the system and is found only in the archive. |
An event also has a state. Strictly speaking, however, it is not the state of the event itself that is meant here, but rather the state of the service or device that sent the event. To use an analogy with status-based monitoring, an event can also be flagged as OK, WARN, CRIT, or UNKNOWN.
2. Setting up the Event Console
Setting up the Event Console is very simple, because the Event Console is an integral part of Checkmk and is activated automatically.
However, if you want to receive syslog messages or SNMP traps over the network, you must enable this separately. The reason for this is that both services need to open a UDP port with a specifically-identified port number. And since only one Checkmk site per system can do this, reception over the network is by default disabled.
The port numbers are:
| Protocol | Port | Service |
|---|---|---|
UDP |
162 |
SNMP traps |
UDP |
514 |
Syslog |
TCP |
514 |
Syslog via TCP |
Syslog via TCP is rarely used, but it does have the advantage that the transmission of messages is secured here. With UDP it can never be guaranteed that packets will actually arrive. And neither Syslog nor SNMP traps offer acknowledgements or similar protection against lost messages. In order to be able to use syslog via TCP, the sending system must of course be able to send messages via this port.
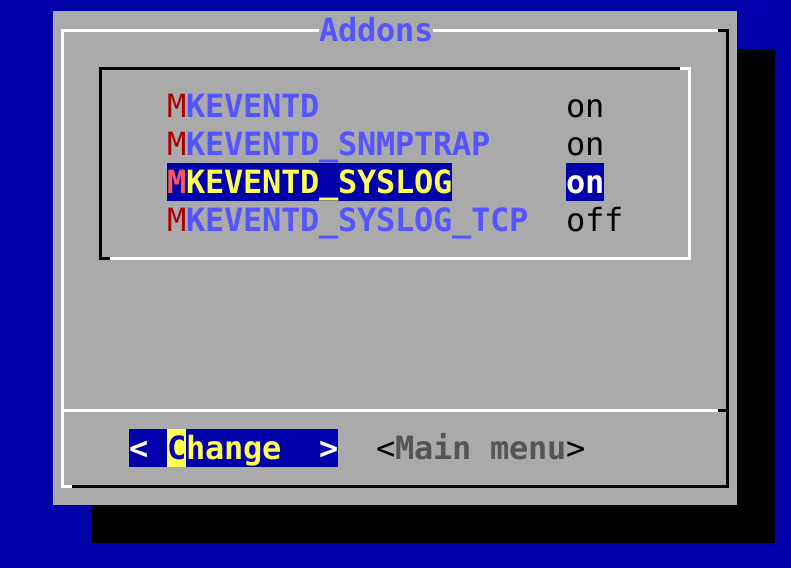
In the Checkmk appliance, you can enable the reception of syslog/SNMP traps in the site configuration.
Otherwise, simply use omd config.
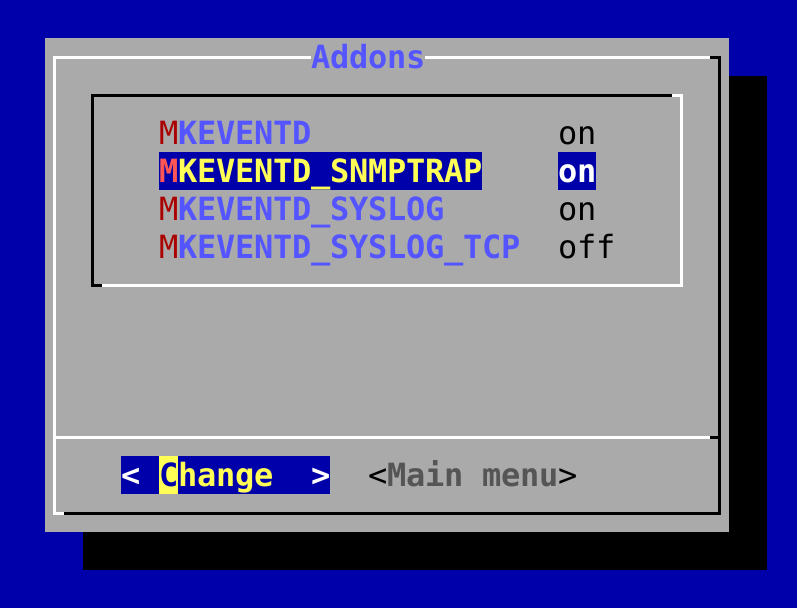
You can find the required setting under Addons:
At omd start you can see in the line containing mkeventd which external interfaces your EC has open:
OMD[mysite]:~$ omd start
Creating temporary filesystem /omd/sites/mysite/tmp...OK
Starting mkeventd (builtin: syslog-udp,snmptrap)...OK
Starting liveproxyd...OK
Starting mknotifyd...OK
Starting rrdcached...OK
Starting cmc...OK
Starting apache...OK
Starting dcd...OK
Starting redis...OK
Initializing Crontab...OK
3. The first steps with the Event Console
3.1. Rules, rules, rules
It was mentioned at the beginning that the EC is used to fish out and display relevant messages. However the unfortunate fact is that most messages — no matter whether they are from text files, the Windows Event Log or the syslog — are rather unimportant. It also doesn’t help when messages have already been pre-classified by their originator.
For example, in Syslog and in the Windows Event Log messages are classified into something similar to OK, WARN and CRIT. But what WARN and CRIT actually mean can be defined subjectively by their programmer. And it can’t even be definitely said that the application which has produced the message is even important on this computer. In short: You cannot get around needing to configure which messages look like a real problem to you and which ones can simply be discarded.
As everywhere in Checkmk, the configuration is performed via rules, which are processed by the EC for each incoming message according to the 'first match' principle. The first rule which is applied to an incoming message decides its fate. If no rule is applied, the message will simply be silently discarded.
Since over time one usually accumulates very many rules for the EC, the rules are organized in packets. The processing of the rules is done packet by packet and within a packet from top to bottom — so the order of processing of these packets is important.
3.2. Creating a simple rule
Not surprisingly, the configuration interface for the EC can be found in the Setup menu under Events > Event Console. Out of the box, you will only find the Default rule pack, which does not actually contain any rules. Incoming messages are therefore, as already mentioned, discarded and also not logged. The module itself looks like this:
Start by creating a new rule package with ![]() Add rule pack:
Add rule pack:
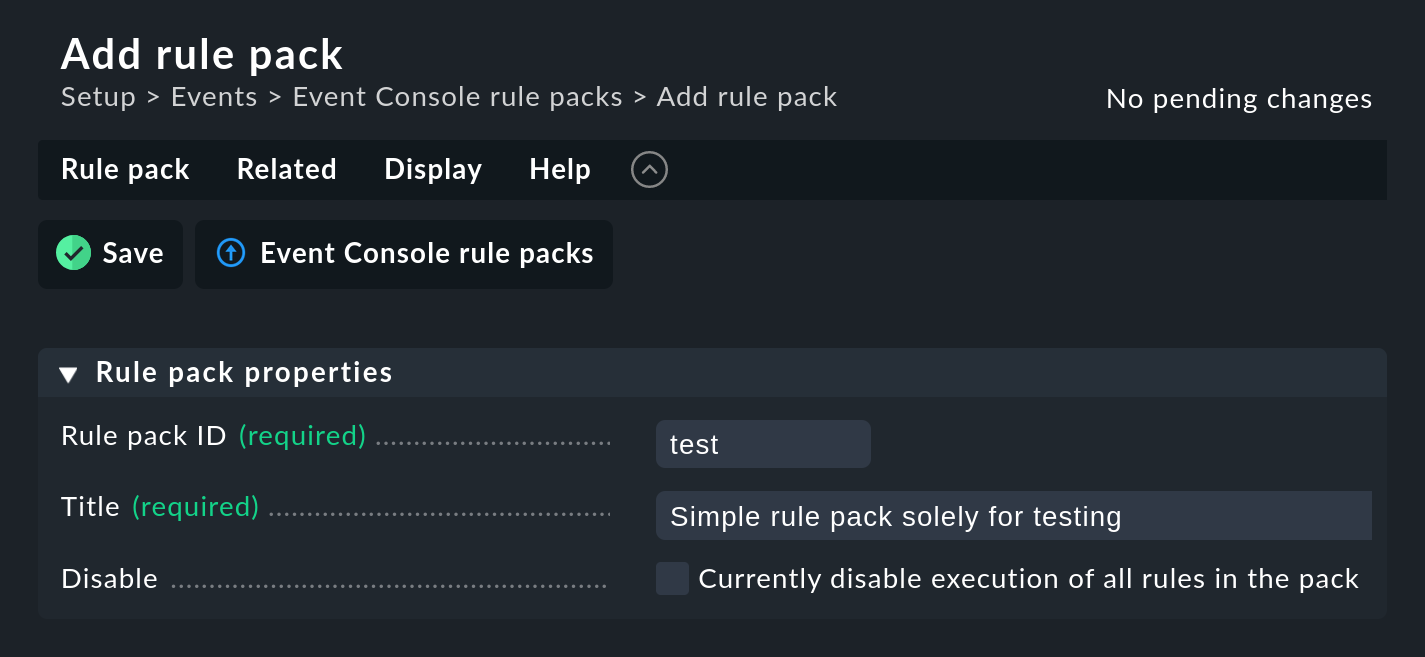
As always, the ID is an internal reference and cannot be changed later. After saving you will find the new entry in the list of your rule packages:
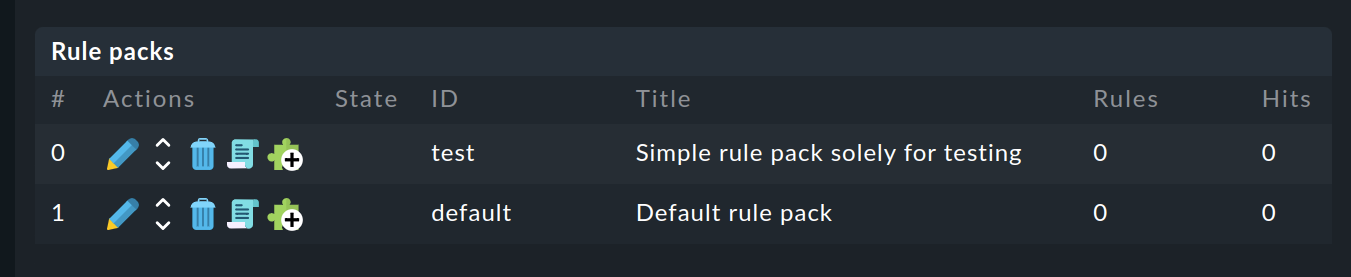
There you can now switch to the still empty rule package with ![]() and create a new rule with
and create a new rule with ![]() Add rule.
Only fill in the first box here with the Rule Properties heading:
Add rule.
Only fill in the first box here with the Rule Properties heading:
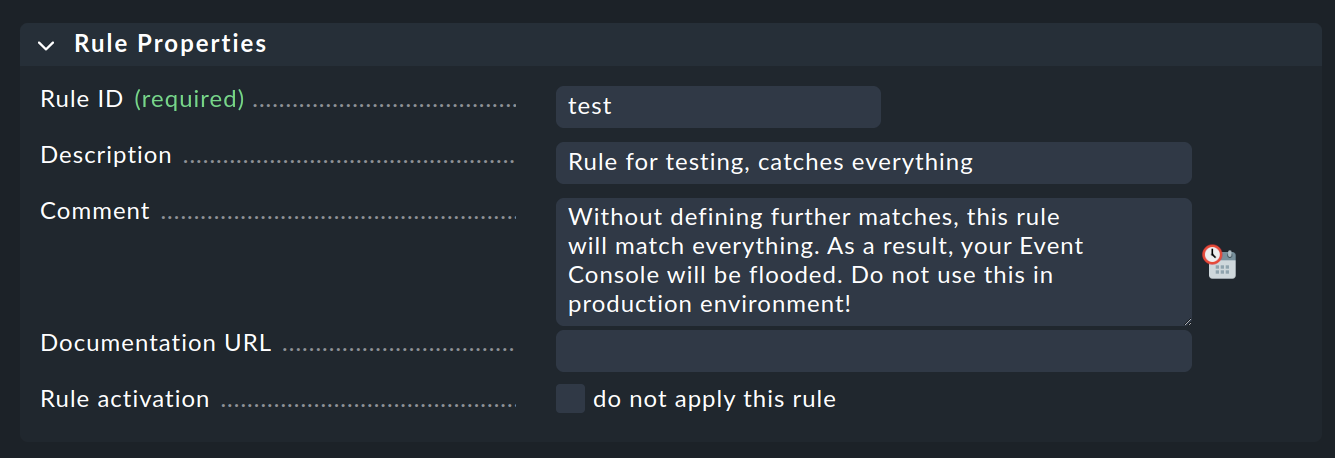
The only thing necessary is a unique Rule ID. This ID will be found later in log files, and it will be stored with the generated events. So it is sensible to assign the IDs with meaningful names in a systematic way. All other boxes are optional. This is especially true for the conditions.
Important: This new rule is an example only for testing and will apply to every event. Therefore it is also important that you later remove it or at least deactivate it, otherwise your Event Console will be flooded with every imaginable pointless message and will be pretty much useless!
Activating the changes
As always in Checkmk, you must first activate changes in order for them to take effect. This is not a disadvantage because this way, for changes that affect several related rules, you can specify exactly when the rules should go 'live'. And beforehand you can use the Event Simulator to test if everything fits as intended.
First, click on the number of accumulated changes at the top right of the page.
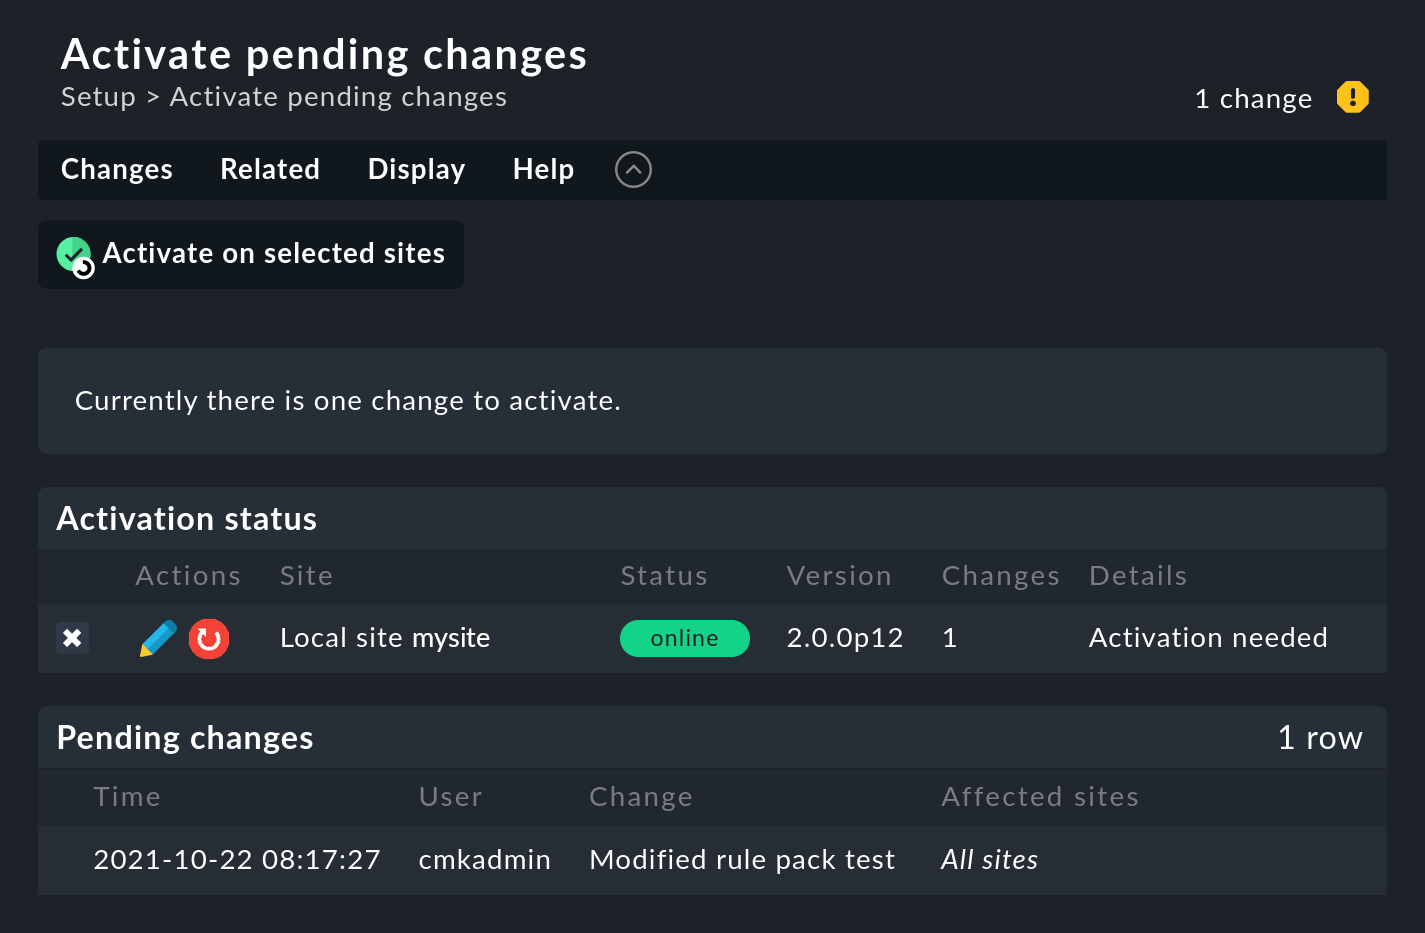
Then click Activate on selected sites to activate the change. The Event Console is designed in such a way that this action runs with no interruptions. The reception of incoming messages is ensured at all times, so that no messages can be lost in the process.
Only administrators are allowed to activate changes in the EC. This is controlled via the Activate changes for event console permission.
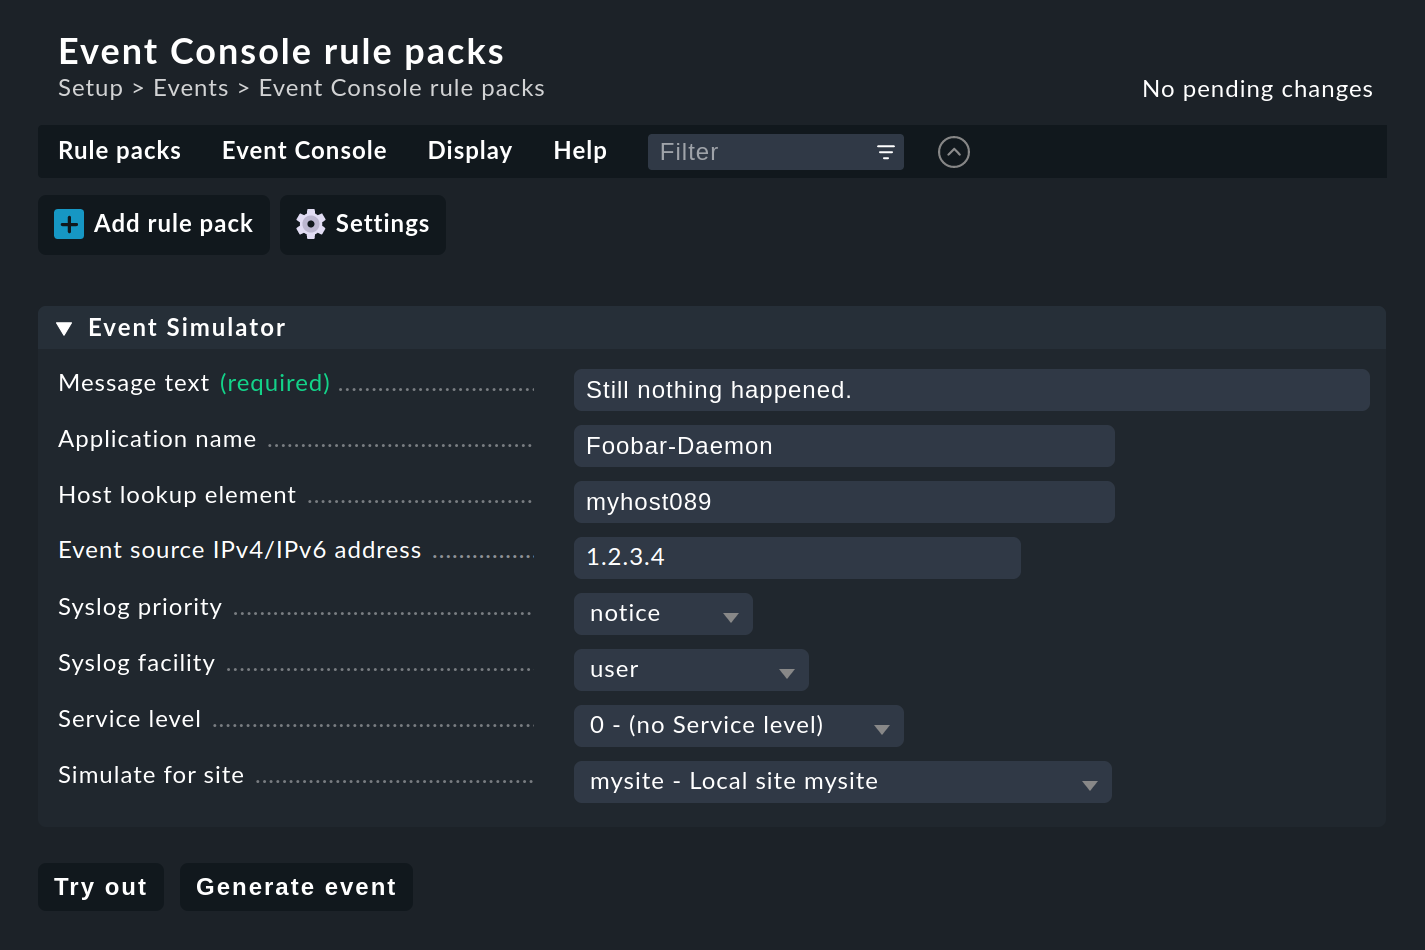
Testing the new rule
For testing you could of course now send messages via Syslog or SNMP. You should also do this later. But for a first test the EC’s built-in Event Simulator is more practical:
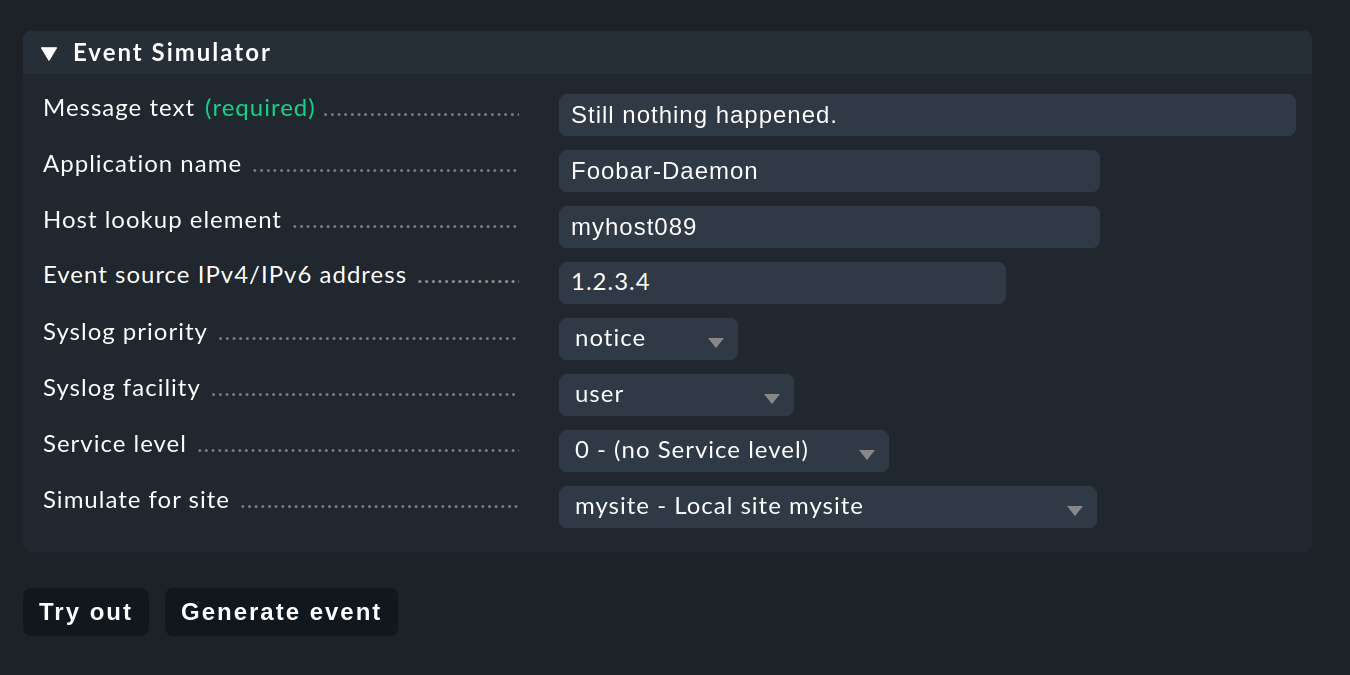
Here you have two options: Try out evaluates on the basis of the simulated message which of the rules would match. If you are in the top level of the Setup GUI for the EC, the rule packages will be highlighted. If you are inside a rule package, the individual rules are highlighted. Each package or rule is marked with one of the following three symbols:
|
This rule is the first to take effect on the message and consequently determines its fate. |
|
This rule would take effect, but the message has already been handled by an earlier rule. |
|
This rule does not take effect. Very handy: If you move the mouse over the gray ball, you get an explanation of why the rule does not apply. |
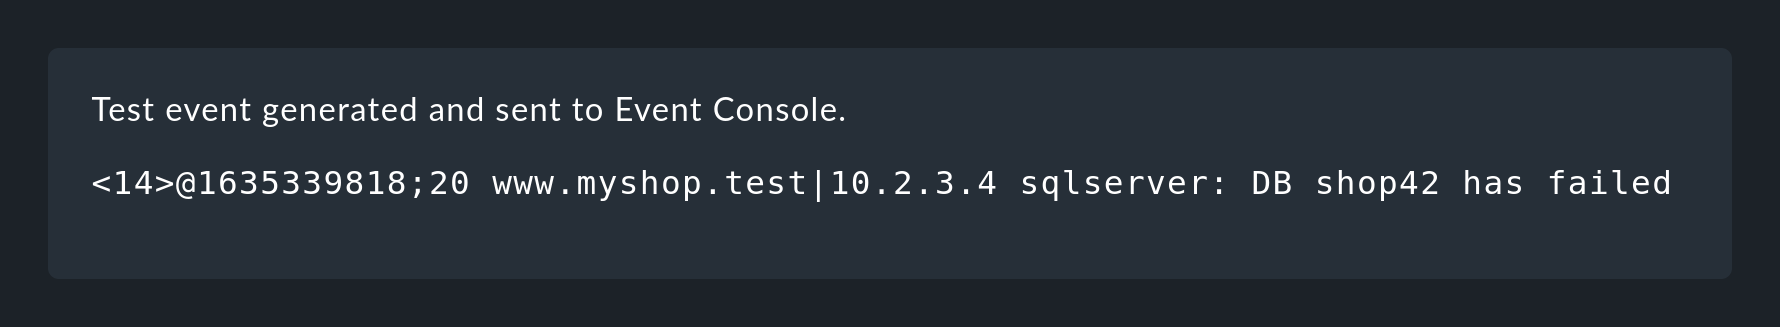
Clicking Generate event does almost the same as Try out, only now the message is actually generated. Any defined actions are actually executed. And the event will then also show up in the open events in the monitoring. You can see the source code for the generated message in the confirmation:
The generated event appears in the Monitor menu under Event Console > Events:
Generating messages manually for testing
For a first real test over the network, you can easily send a syslog message from a another Linux computer by hand.
Since the protocol is so simple, you don’t even need a special program, you can simply send the data via netcat or nc using UDP.
The content of the UDP packet consists of a single line of text.
If this conforms to a specific structure, the Event Console breaks down the components cleanly:
user@host:~$ echo '<78>Dec 18 10:40:00 myserver123 MyApplication: It happened again.' | nc -w 0 -u 10.1.1.94 514But you can also simply send anything. The EC will then accept it anyway and just evaluate it as a message text. Additional information such as the application, the priority, etc. will of course be missing. For security reasons the status CRIT will be assumed:
user@host:~$ echo 'This is no syslog message' | nc -w 0 -u 10.1.1.94 514Within the Checkmk site running the EC there is a named pipe, into which you can write text messages locally via echo.
This is a very simple method for connecting a local application and also a way to test the processing of messages:
OMD[mysite]:~$ echo 'Local application says hello' > tmp/run/mkeventd/eventsBy the way, it is also possible to send in syslog format here, so that all fields in the event data are filled in cleanly.
3.3. Event Console settings
The Event Console has its own global settings, which are not found with those of the other modules, but instead under Setup > Events > Event Console with the Settings button.
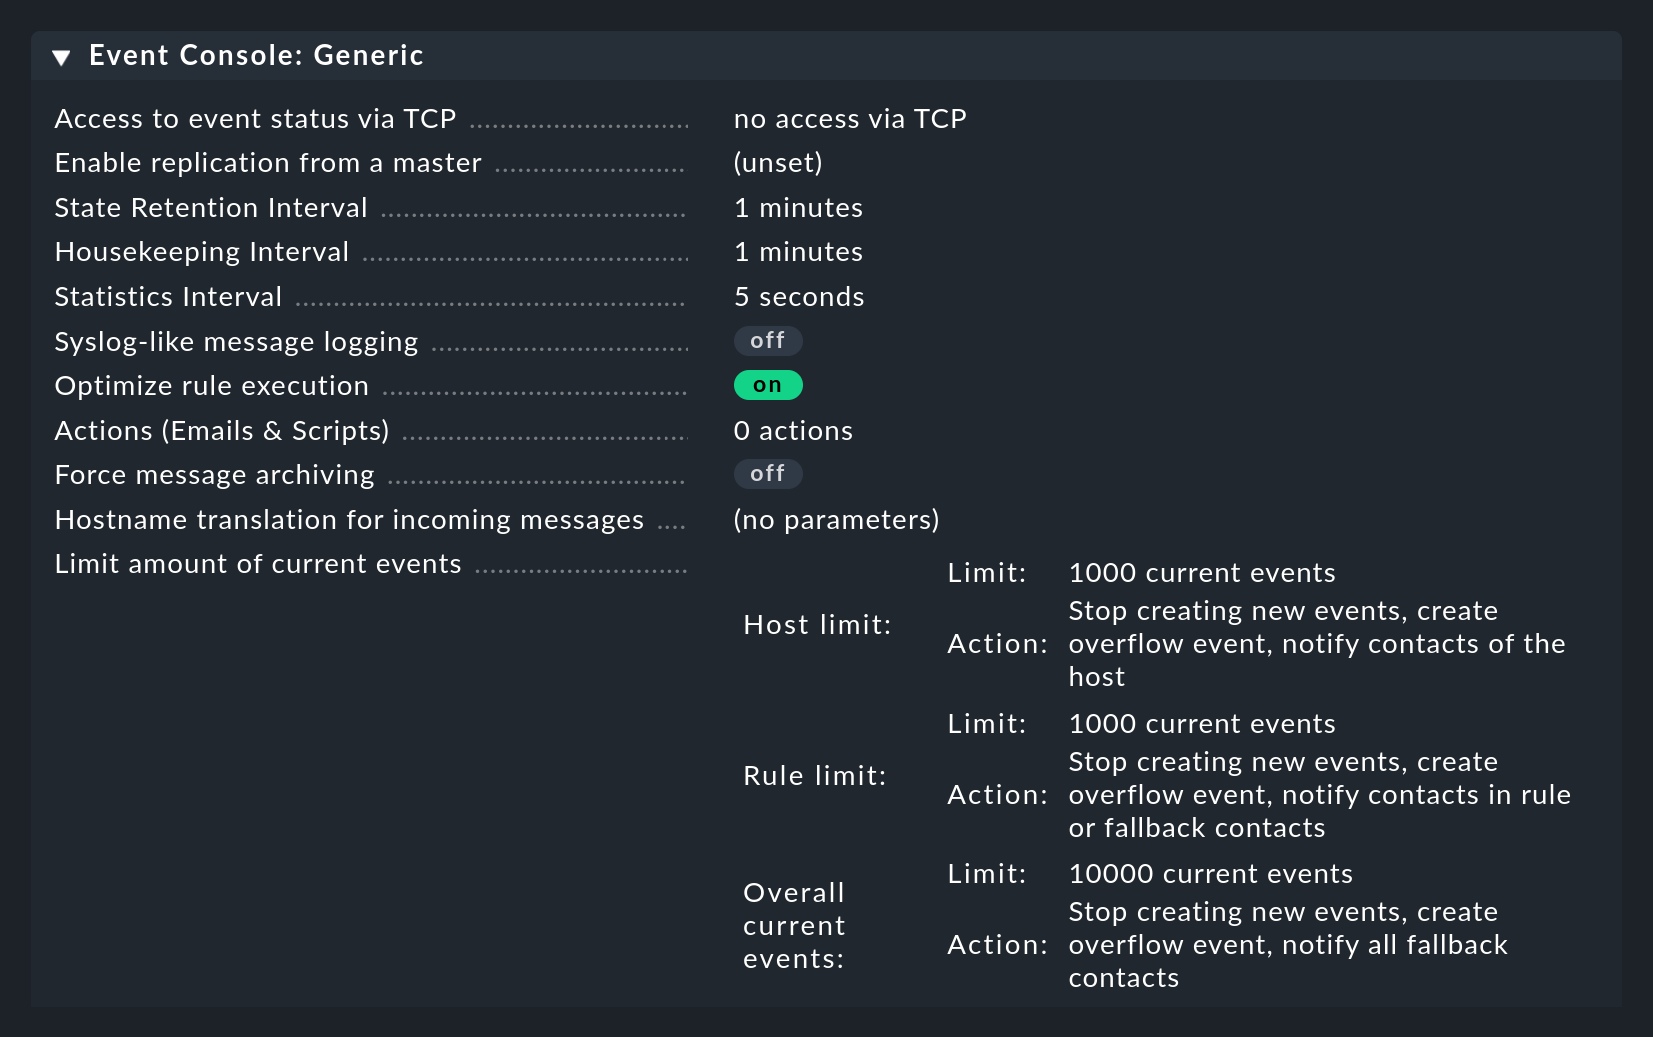
As always, you can find explanations of the individual settings from the inline help and at the appropriate places in this article.
Access to the settings is possible via the Configuration of Event Console permission, which by default is only available in the admin role.
3.4. Permissions
The Event Console also has its own section for roles and permissions:
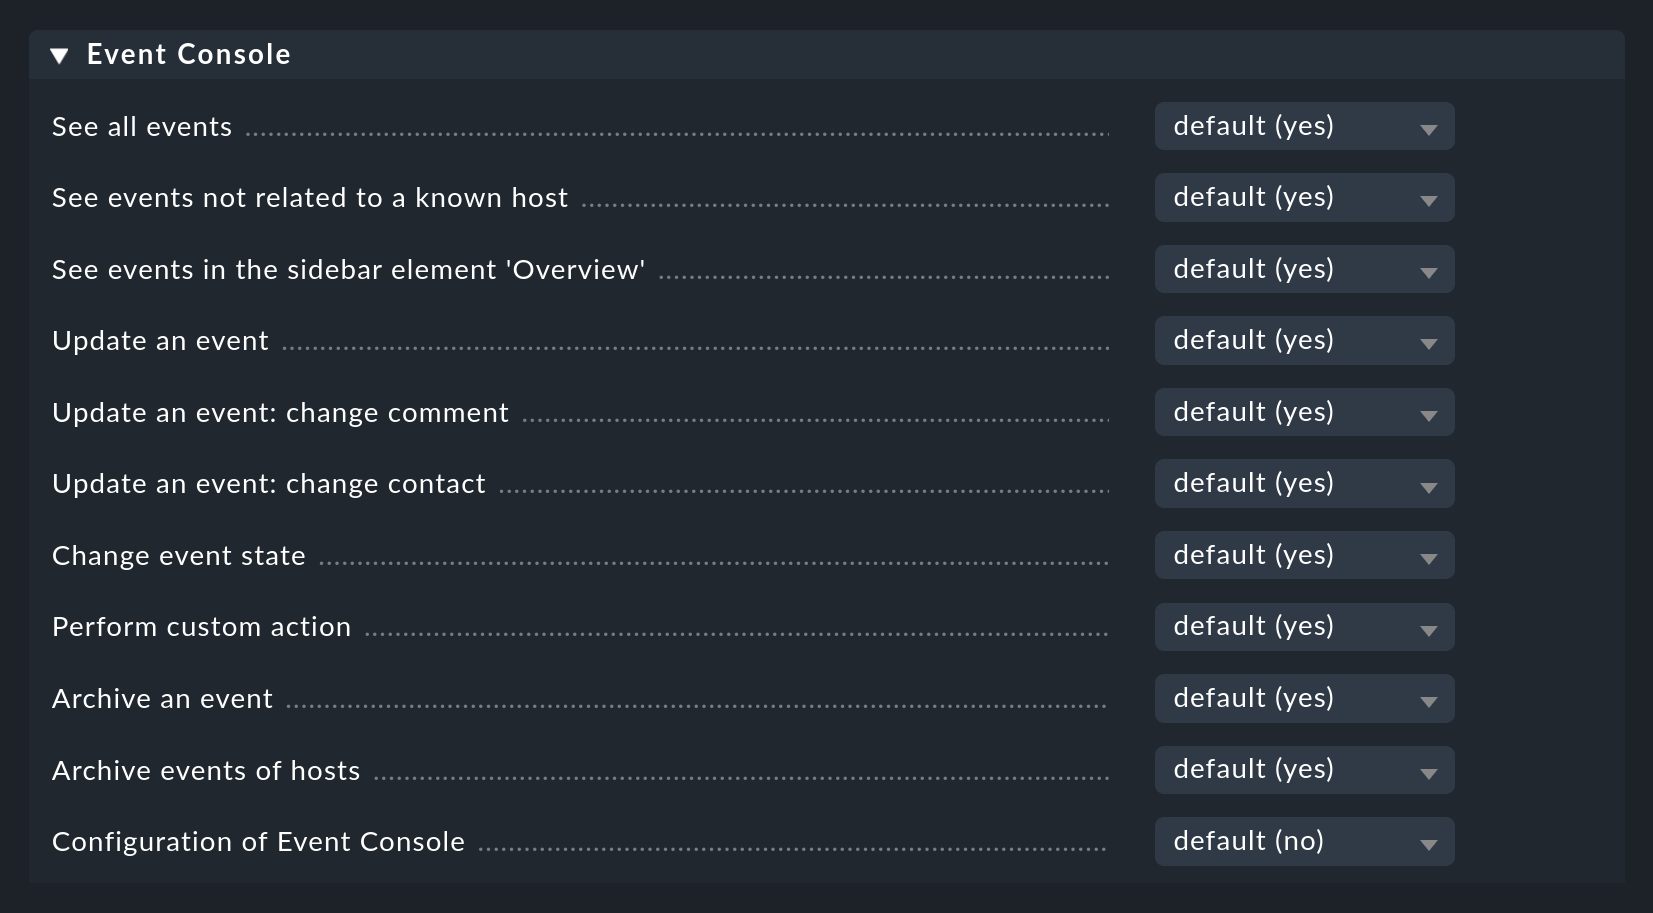
We will discus some of these permissions in more detail at appropriate places in this article.
3.5. Host assignment in the Event Console
A special feature of the Event Console is that, in contrast to status-based monitoring, hosts are not the focus. Events can occur without any explicit host assignment, which is in fact often desired. However an assignment should be possible for hosts that are already in active monitoring, in order to quickly access the status overview when an event occurs. Or at the latest, if events are to be converted into states, a correct assignment is essential.
The fundamental rule for messages received via syslog is that the host name in the message should correspond to the host name in the monitoring.
This is achieved by using the fully qualified domain name (FQDN) / fully qualified host name (FQHN), both in your syslog configuration as well as in the host naming in Checkmk.
In Rsyslog you can accomplish this using the global directive $PreserveFQDN on.
Checkmk tries to match the host names from the events to those from the active monitoring as best it can automatically. In addition to the host name, the host alias is also tried. If the short name is transmitted via syslog the assignment will be correct.
A backward resolution of the IP address would not make much sense here, because intermediate log servers are often used. If the conversion of the host names to FQDN/FQHN or the re-entry of many aliases is too time-consuming, you can use the Event Console setting Hostname translation for incoming messages to translate host names directly when receiving messages. Thereby you have numerous possibilities:
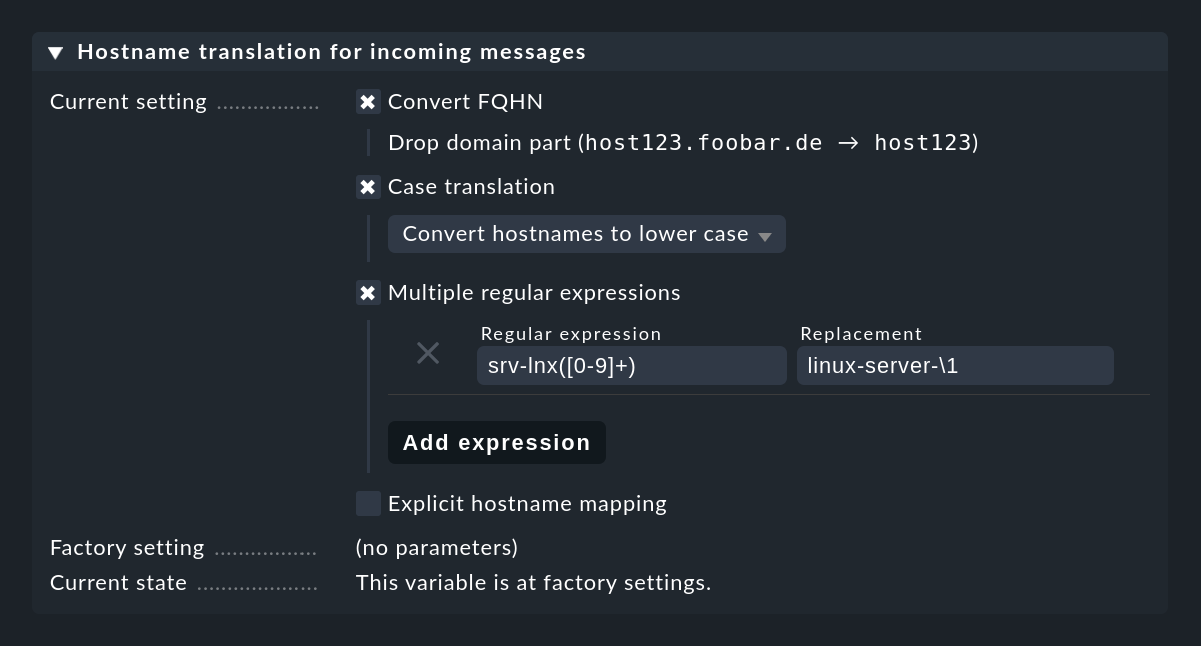
The most flexible method is to work with regular expressions, which allow intelligent search-and-replace within host names.
In particular, if host names are explicit, but only the domain part used in Checkmk is missing, a simple rule helps: (.*) becomes \1.mydomain.test.
In cases where all this is not enough, you can still use Explicit hostname mapping to specify a table of individual names and their respective translations.
Important: A name conversion is performed before the checking of the rule conditions and thus long before a possible rewriting of the host name by the Rewrite hostname rule action in automatic text rewriting.
The assignment is somewhat simpler with SNMP. Here the IP address of the sender is compared with the cached IP addresses of the hosts in the monitoring — i.e. as soon as regular active checks are available, such as the accessibility check of the Telnet or SSH port at a switch, status messages from this device sent via SNMP will be assigned to the correct host.
4. The Event Console in monitoring
4.1. Event views
Events generated by the Event Console are displayed analogously to hosts and services in the monitoring environment. You can find the entry point for this in the Monitor menu under Event Console > Events:
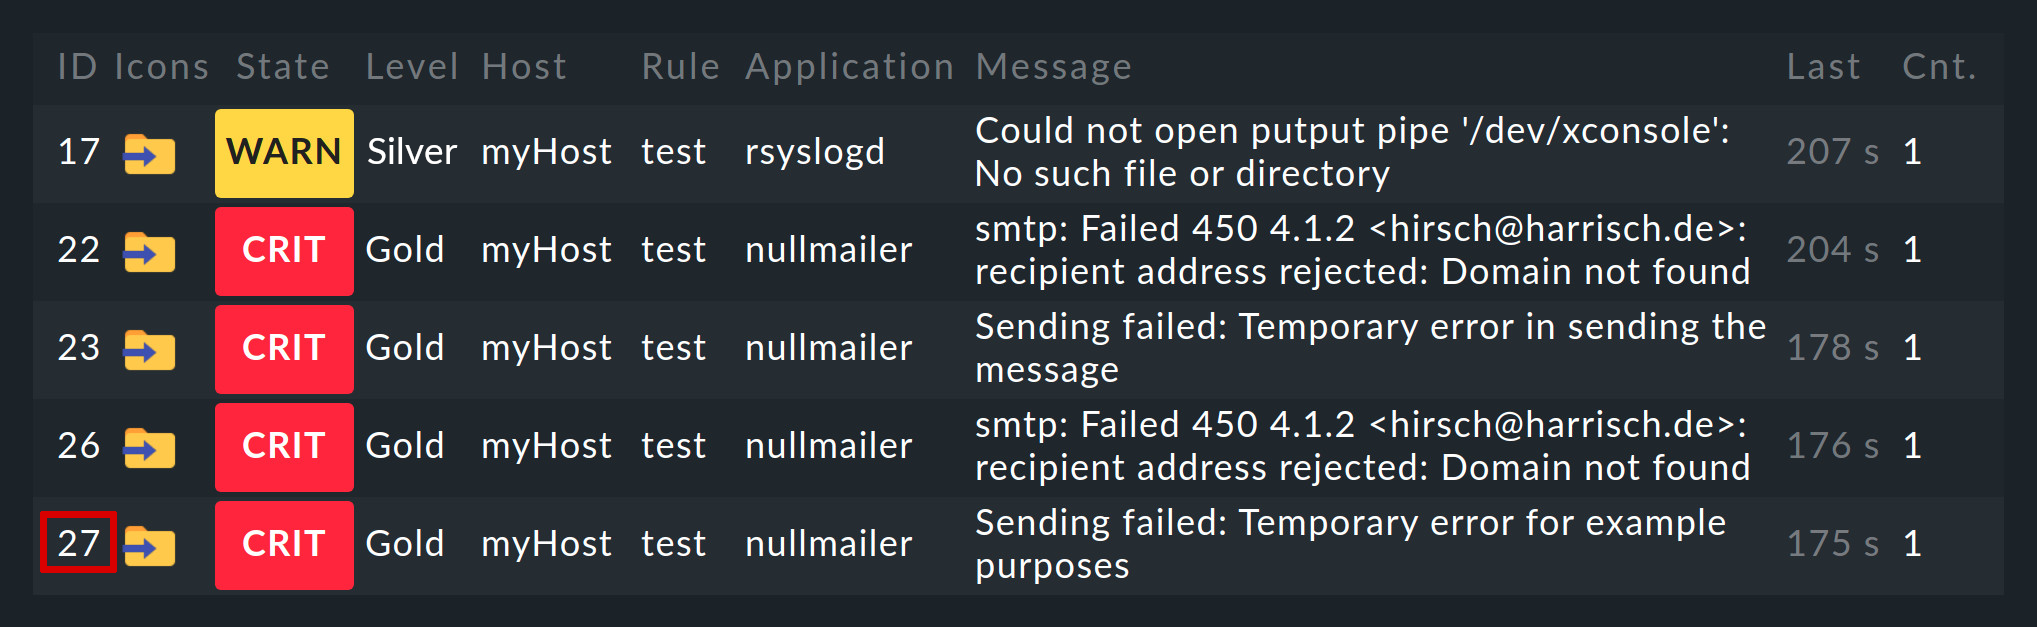
You can customize the displayed Events view just like any other. You can filter the displayed events, execute commands, etc. For details, see the article on views. When you create new event views, events and event history are available as data sources.
A click on the event ID (here e.g. 27) will show you its details:
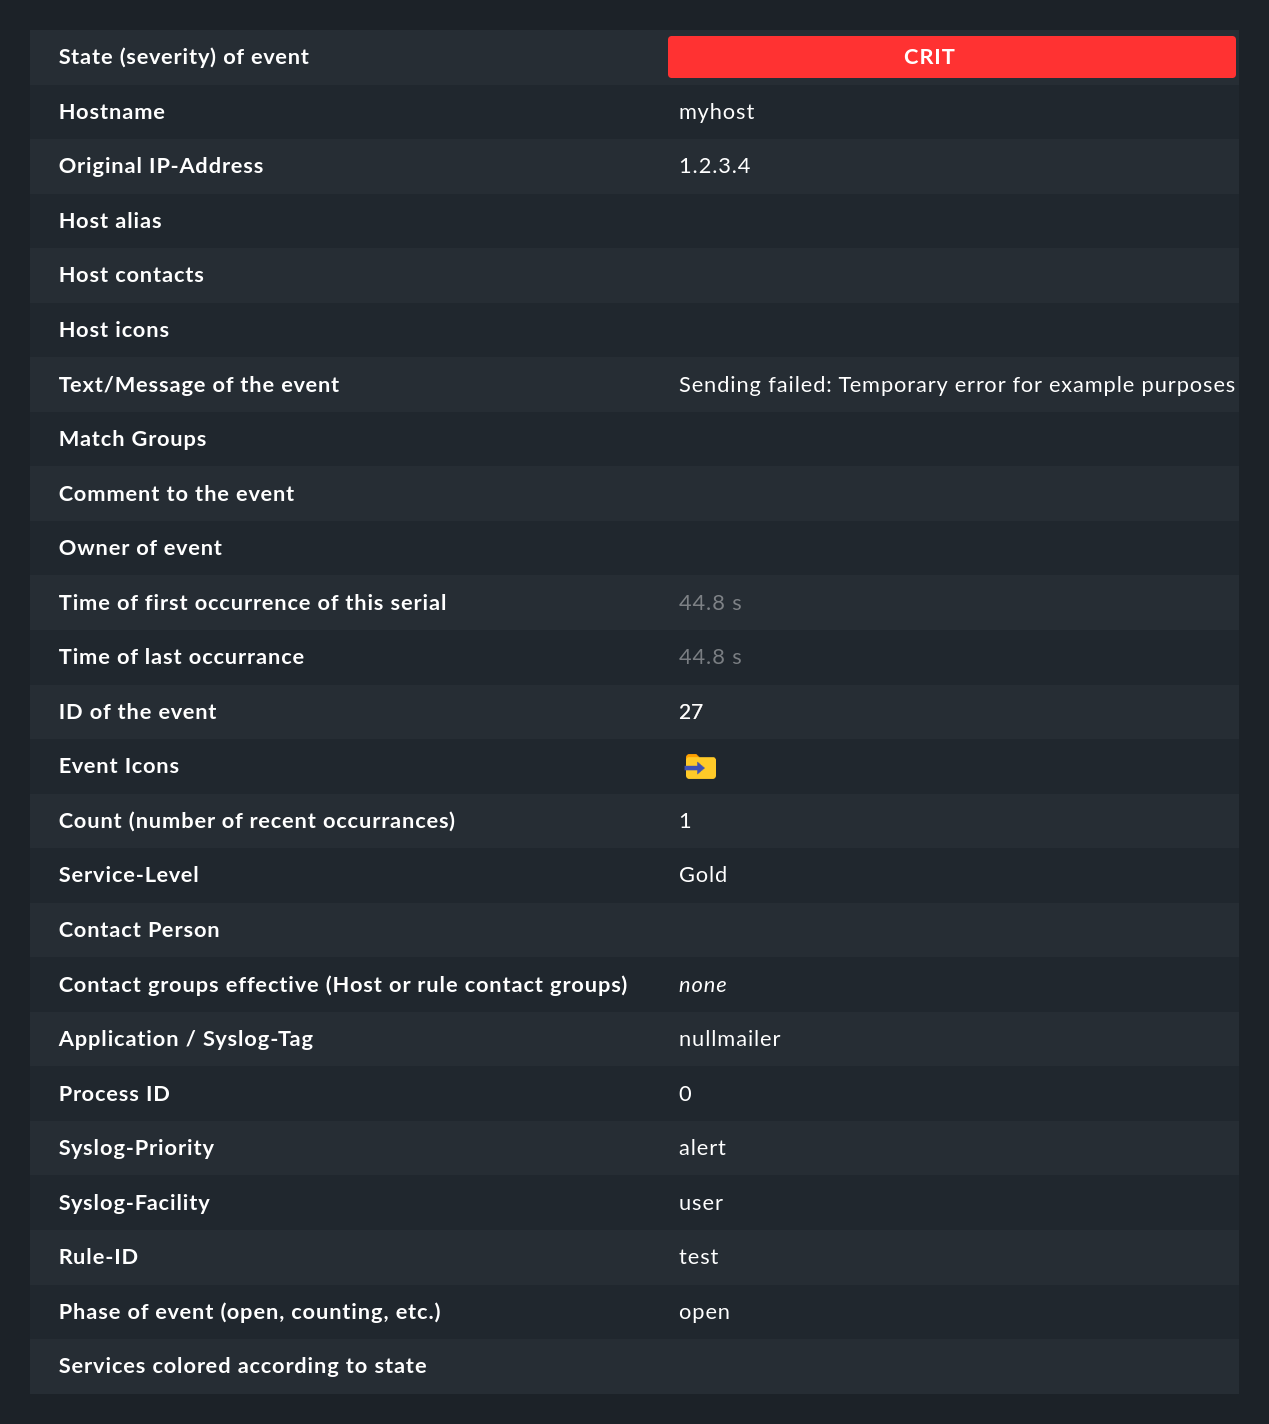
As you can see, an event has quite a few data fields, whose meaning we will explain bit by bit in this article. The most important fields should nevertheless be briefly mentioned here:
| Field | Meaning |
|---|---|
State (severity) of event |
As mentioned in the introduction. each event is classified as OK, WARN, CRIT or UNKNOWN. Events of status OK are rather unusual. This is because the EC is designed precisely to only filter out problems. However, there are situations where an OK event can make sense. |
Text/Message of the event |
The actual content of the event: A text message. |
Hostname |
The name of the host that sent the message. This does not necessarily have to be a host being actively monitored by Checkmk. However, if a host of that name exists in the monitoring, the EC will automatically create a link. In this case, the Host alias, Host contacts and Host icons fields will also be filled and the host will appear in the same notation as in the active monitoring. |
Rule-ID |
The ID of the rule that created this event. Clicking on this ID will take you directly to the rule details. By the way, the ID is preserved even if the rule no longer exists in the meantime. |
As mentioned at the beginning, events are displayed directly in the Overview of the sidebar:
Here you will see three numbers:
Events — all open and acknowledged events (corresponds to the Event Console > Events view)
Problems — of which only those with a WARN / CRIT / UNKNOWN state
Unhandled — of these again only those not yet acknowledged (more on this in a moment)
4.2. Commands and workflow of events
Analogous to the hosts and services, a simple workflow is mapped for events as well.
As usual this is done via commands, which can be found in the Commands menu.
By showing and selecting with checkboxes you can execute a command on multiple events simultaneously.
As a special feature there is the frequently used archive of a single event directly via the ![]() icon.
icon.
For each of the commands there is a permission, which you can use to control for which role the command execution is allowed.
By default all commands are allowed for holders of the admin and user roles.
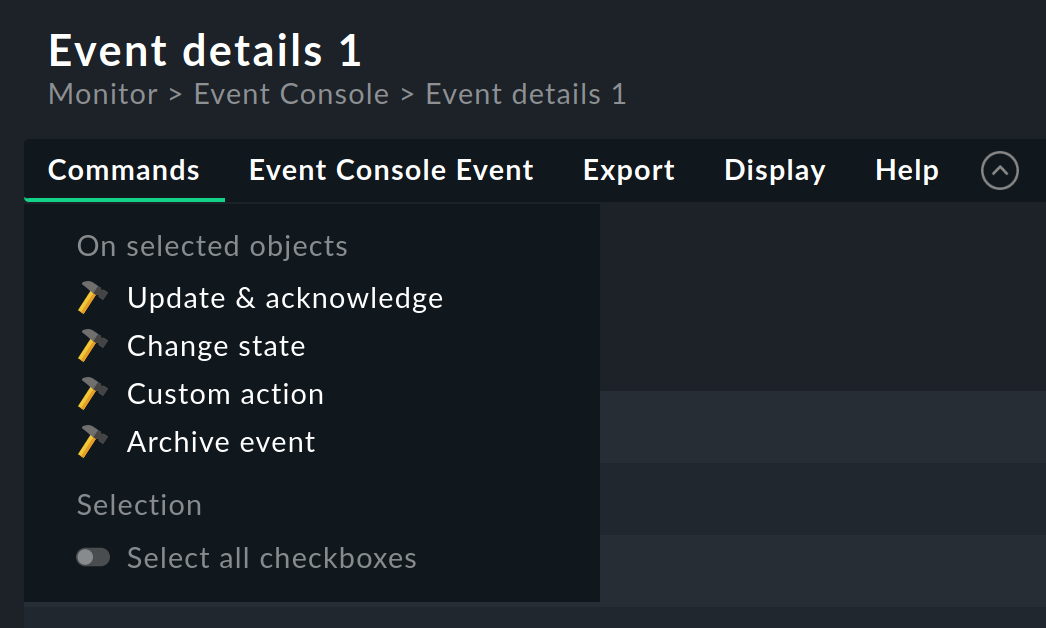
The following commands are available:
Update and acknowledge
The Update & Acknowledge command displays the following area above the event list:
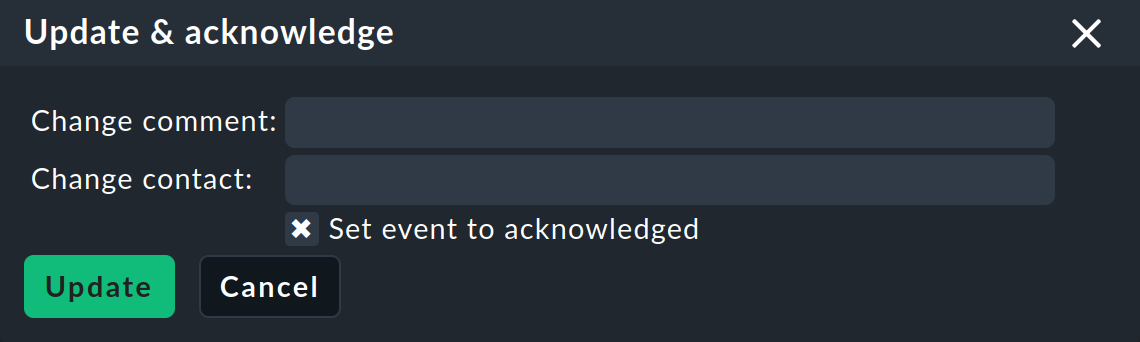
With the Update button you can in a single action add a comment to the event, add a contact person and acknowledge the event. The Change contact field is intentionally free text. Here you can also enter things like phone numbers. In particular, this field has no influence on the visibility of the event in the GUI — it is purely a comment field.
The Set event to acknowledged checkbox will cause the event to switch from the open phase to acknowledged, and henceforth be displayed as handled. This is analogous to the acknowledgement of host and service problems.
Subsequent invocation of the command with the checkbox unchecked removes the acknowledgement.
Change state
The Change State command allows the manual changing of an event’s state — e.g. from CRIT to WARN.
Custom action
With the Custom Action command, freely definable actions can be executed on events. Initially, only the Send monitoring notification action is available. This will send a Checkmk notification which will be handled in the same way as one from an actively monitored service. This goes through the notification rules and can generate emails, an SMS, or whatever you have configured accordingly. See below for details on notification by the EC.
Archive event
The Archive Event button permanently removes an event from the open events list. Since all actions on events — including this deletion — are also recorded in the archive, you will still be able to later access all of the information on the event. That is why we don’t speak of deleting, but rather of archiving.
You can also conveniently archive individual events from the event list using ![]() .
.
4.3. Visibility of events
The visibility 'problem'
To provide visibility of hosts and services in monitoring for normal users, Checkmk uses contact groups. These groups are assigned to the hosts and services through Setup GUI, rule or folder configuration.
With the Event Console the situation is that such an assignment of events to contact groups does not exist. This is because it is simply not known in advance which messages will actually be received. Not even the list of hosts is known, because the sockets for Syslog and SNMP are accessible from everywhere. Therefore the Event Console includes a few special features for defining visibility.
Initially, everyone can see everything
First of all, when configuring the user roles there is the Event Console > See all events permission.
This is active by default, so that normal users are allowed to see all events!
This is deliberately set to ensure that important error messages do not fall by the wayside due to incorrect configuration.
The first step to more precise visibility is to remove this permission from the user role.
Assignment to hosts
To ensure that the visibility of events is as consistent as possible with the rest of the monitoring, the Event Console tries as much as it can to match the hosts from which it receives events to those hosts configured via the Setup GUI. What sounds simple is tricky in detail. Sometimes a host name is missing in the event and only the IP address is known. In other cases the host name is spelled differently to what is in the Setup GUI.
The assignment is done as follows:
If no host name is found in the event, its IP address is used as the host name.
The host name in the event is then compared case-insensitively with all host names, host addresses and IP addresses of the hosts in the monitoring.
If a host is found in this way, its contact groups are used for the event, and this is then used to control visibility.
If the host is not found, the contact groups — if configured there — are taken from the rule that created the event.
If no groups are stored there either, the user may only see the event if she has the Event Console > See events not related to a known host permission.
You can influence the assignment at one point: Namely, if contact groups are defined in the rule and the host could be assigned, the mapping usually has priority. You can change this in a rule with the Precedence of contact groups option:
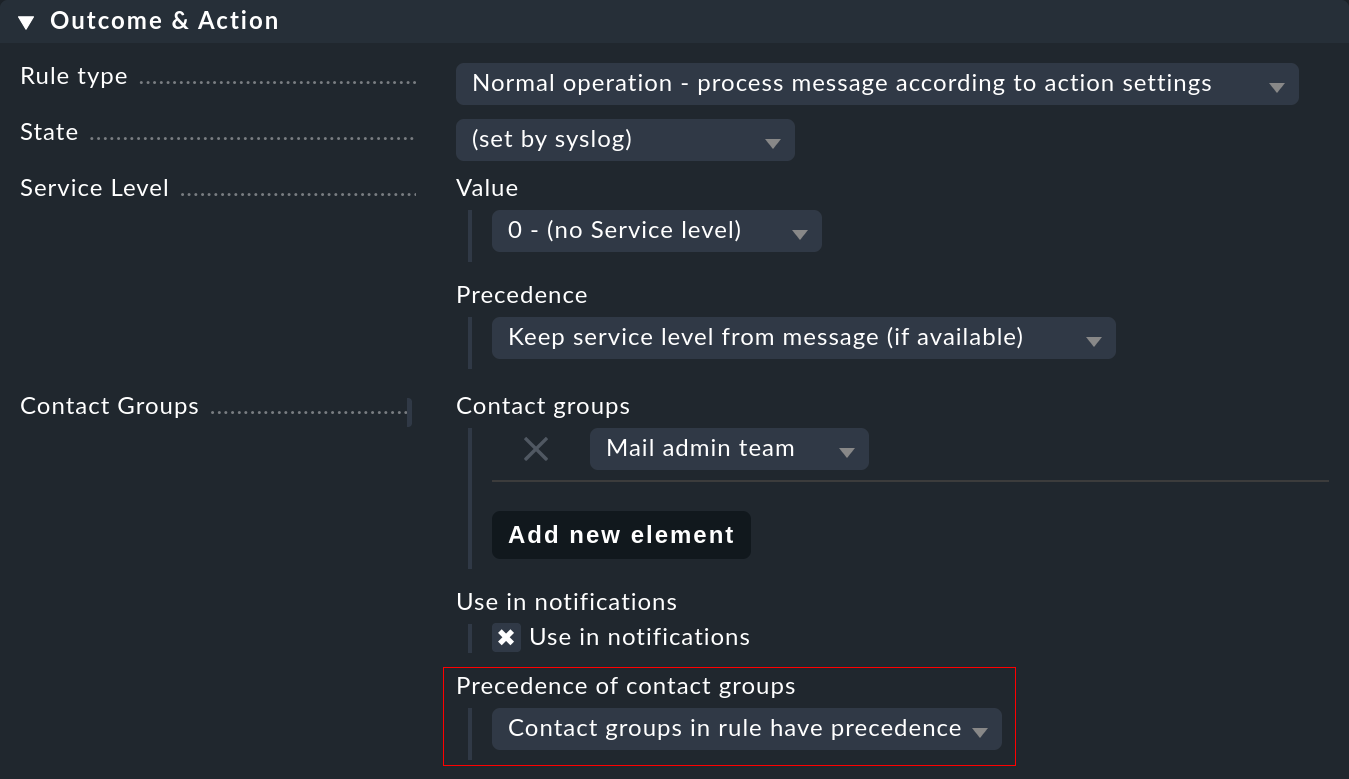
In addition, you can make settings directly in the rule for the notification. This makes it possible to prioritize the type of event over the regular responsibilities for a host.
4.4. Troubleshooting
Which rule applies, and how often?
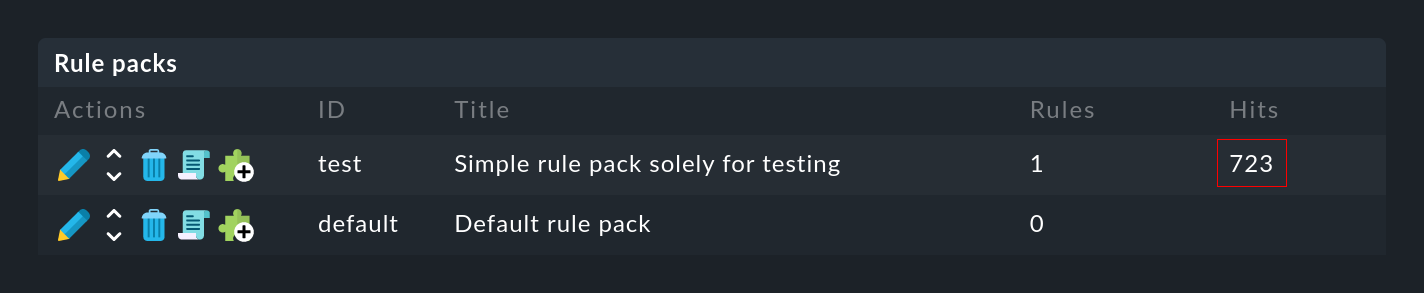
Both for the rule packs …
… as well as for the individual rules …
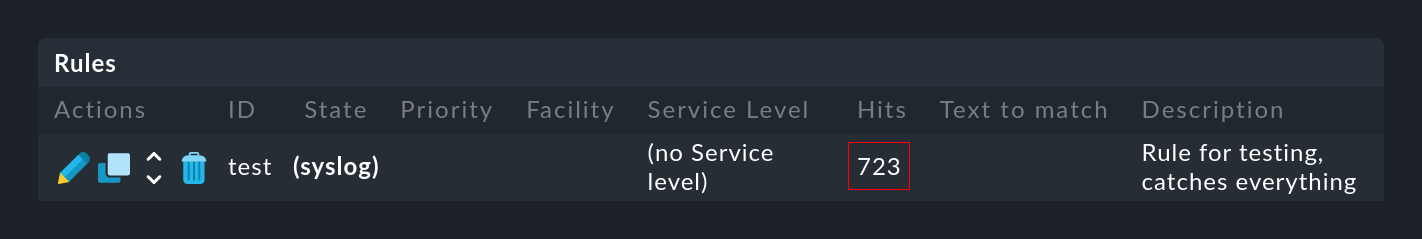
… in the Hits column you will find the information on how often the package or rule has already matched a message. This helps you to eliminate or repair ineffective rules. But this can also be interesting for rules that match very often. For optimal performance of the EC, these should be at the beginning of the rule chain. This way you can reduce the number of rules that the EC has to test on every message.
You can reset the counters at any time with the Event Console > Reset counters menu item.
Debugging rule evaluation
At Trying out a rule you have already seen how you can use the Event Simulator to check the evaluations of your rules. You can get similar information at runtime for all messages, if in the Event Console settings you set the value from Debug rule execution to on.
The Event Console log file can be found at var/log/mkeventd.log, in which you will find the exact reason why any rule that was checked did not take effect:
[1481020022.001612] Processing message from ('10.40.21.11', 57123): '<22>Dec  6 11:27:02 myserver123 exim[1468]: Delivery complete, 4 message(s) remain.'
[1481020022.001664] Parsed message:
 application:    exim
 facility:       2
 host:           myserver123
 ipaddress:      10.40.21.11
 pid:            1468
 priority:       6
 text:           Delivery complete, 4 message(s) remain.
 time:           1481020022.0
[1481020022.001679] Trying rule test/myrule01...
[1481020022.001688]   Text:   Delivery complete, 4 message(s) remain.
[1481020022.001698]   Syslog: 2.6
[1481020022.001705]   Host:   myserver123
[1481020022.001725]   did not match because of wrong application 'exim' (need 'security')
[1481020022.001733] Trying rule test/myrule02n...
[1481020022.001739]   Text:   Delivery complete, 4 message(s) remain.
[1481020022.001746]   Syslog: 2.6
[1481020022.001751]   Host:   myserver123
[1481020022.001764]   did not match because of wrong text
It goes without saying that you should use this intensive logging only when needed and with caution. In an only slightly more complex environment huge volumes of data will be generated!
5. The full power of the rules
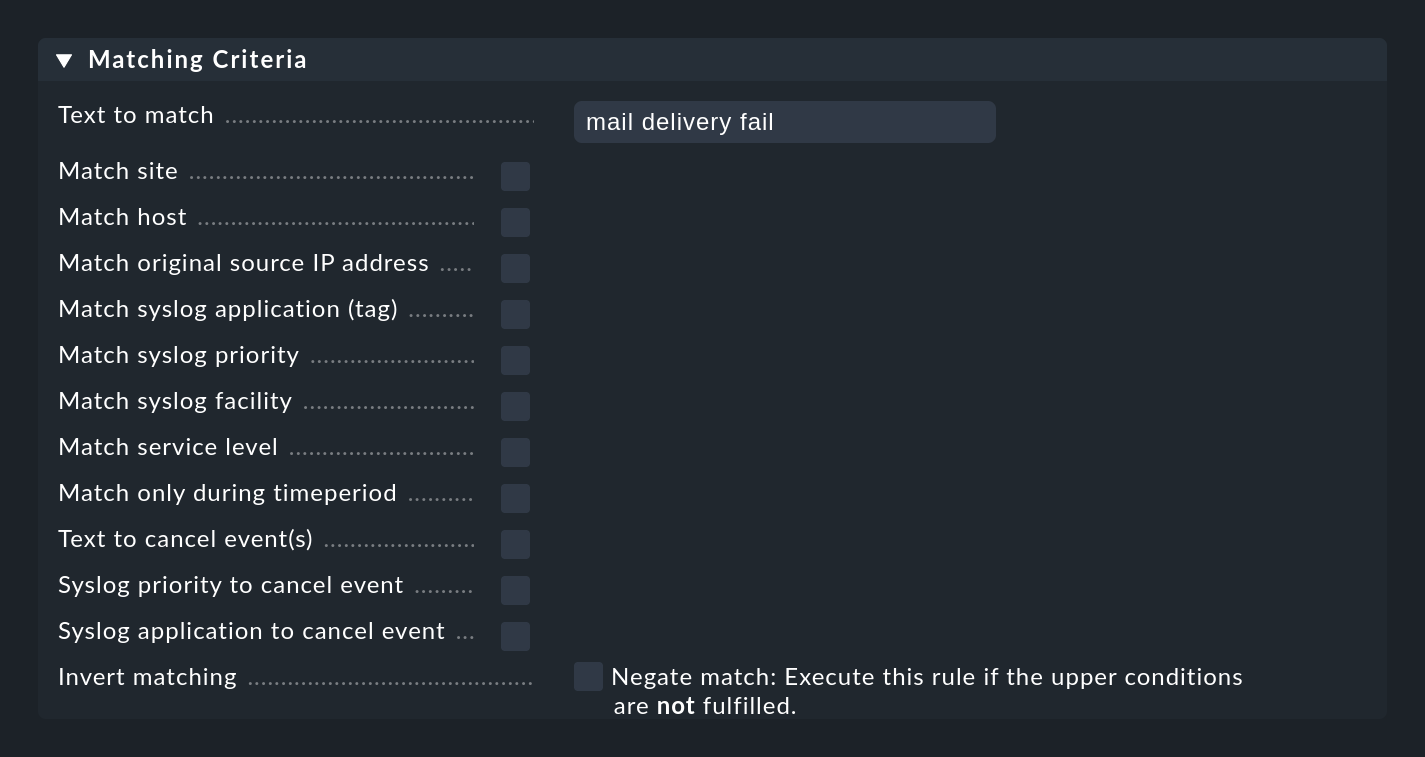
5.1. The conditions
The most important part of an EC rule is of course the condition (Matching Criteria). Only if a message meets all the conditions stored in the rule, the actions defined in the rule are executed and the evaluation of the message is thus completed.
General information on text comparisons
For all conditions involving text fields, the comparison text is always treated as a regular expression. The comparison always takes place ignoring upper/lower case. The latter is an exception to Checkmk conventions in other modules. However, this makes the formulation of the rules more robust, especially since host names in events are not necessarily consistent in their spelling if they have been configured on each host locally rather than centrally. This exception is thus very useful here.
Furthermore, an infix match always applies — i.e. a check for a content of the search text.
So you can save a .* at the beginning or at the end of the search text.
There is one exception however: If no regular expression is used in the match to the host name, rather an explicit host name, it will be checked for an exact match and not for being contained.
Attention: If the search text contains a dot (.), it will be considered a regular expression and the infix search will apply, for example myhost.com will then also match e.g. notmyhostide!
Match groups
Very important and useful here is the concept of match groups in the Text to match field. This refers to the text sections that match parenthesized expressions in the regular expression.
Suppose you want to monitor the following type of message in the log file for a database:
Database instance WP41 has failedThe WP41 is of course variable and you surely do not want to formulate a separate rule for each different instance.
Therefore you use .* in the regular expression, which stands for any string:
Database instance .* has failed
If you now enclose the variable part in round brackets, the Event Console will memorize (capture) the actual value for any future actions:
Database instance (.*) has failed
After a successful match of the rule, the first match group is now set to the value WP41 (or whichever instance produced the error).
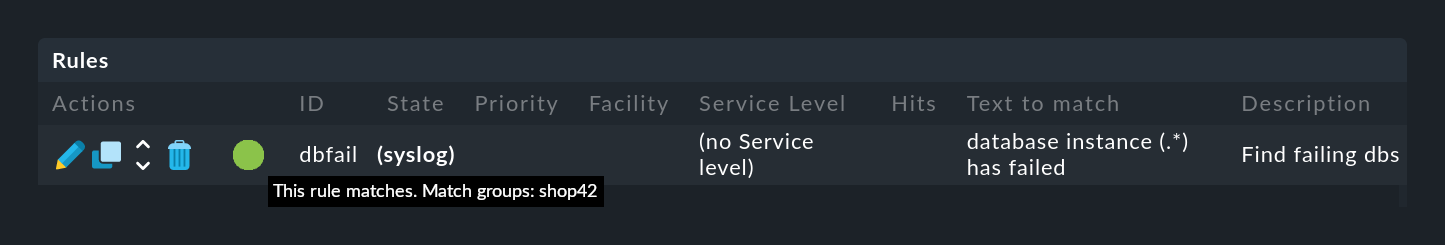
You can see these match groups in the Event Simulator if you move the cursor over the green ball:
You can also see the groups in the details of the generated event:
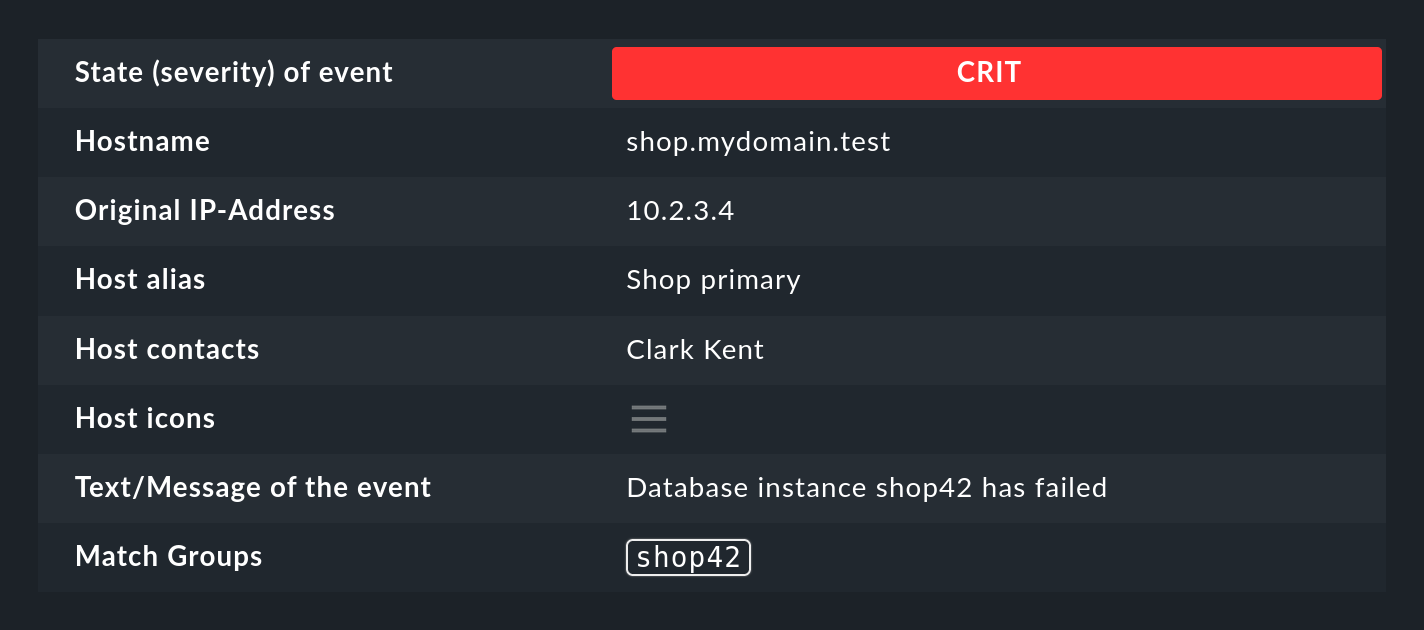
Among other things, the match groups are used for:
At this point, a tip:
There are situations where you need to group something in the regular expression but you do not want to create a match group.
You can do this by placing a ?: directly following the opening parenthesis.
Example: The expression one (.*) two (?:.*) three creates for a match on one 123 two 456 three only the one match group 123.
IP address
In the Match original source IP address field you can match the IPv4 address of the message sender.
Specify either an exact address or a network in the notation X.X.X.X/Y, e.g. 192.168.8.0/24 to match all addresses in the network 192.168.8.X.
Note that the match on the IP address only works if the monitored systems send directly to the Event Console. If another connected intermediate syslog server is forwarding the messages, its address will appear instead as the sender in the message.
Syslog priority and facility
The Match syslog priority and Match syslog facility fields are standardized information, originally defined by Syslog information. Internally, an 8-bit field is divided into 5 bits for the facility (32 possibilities) and 3 bits for the priority (8 possibilities).
The 32 predefined facilities were once meant for something such as an application.
But the selection was not made very forward-looking at that time.
One of the facilities is uucp — a protocol which by the early 90s of the last millennium was already nearly obsolete.
But it is a fact that every message that comes via syslog carries one of these facilities. In some cases you can also assign these freely when sending the message, in order to be able to filter them later. This is quite useful.
The use of facility and priority also has a performance aspect. If you define a rule that in any case only applies to messages that all have the same facility or priority, you should define these additionally in the rule’s filters. The Event Console can then bypass these rules very efficiently when a message with different values is received. The more rules that have these filters set, the fewer rule comparisons are needed.
Inverting a match
The Negate match: Execute this rule if the upper conditions are not fulfilled. checkbox causes the rule to take effect only when none of the conditions are fulfilled. This is actually only useful in the context of two rule types (Rule type in the Outcome & Action box of the rule):
Do not perform any action, drop this message, stop processing.
Skip this rule pack, continue rule execution with next pack
You can learn more about the rule packs below.
5.2. Effect of the rule
Rule type: Cancel or create an event
When a rule matches, it specifies what should happen with the message. This is done in the Outcome & Action box:
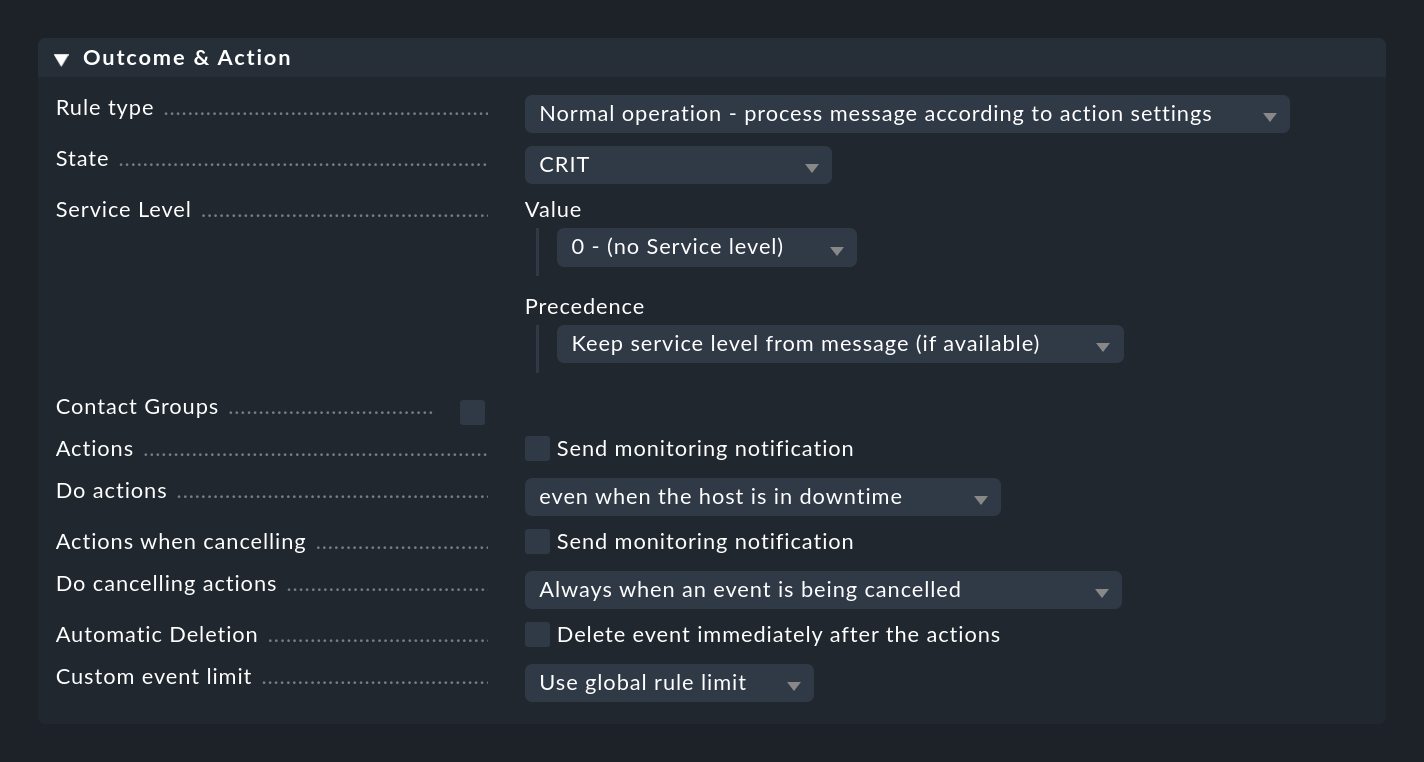
The Rule type can be used to abort the evaluation at the point entirely or for the current rule package. Especially the first option should be used to get rid of most of the useless 'noise' using a few specific rules at the very beginning. Only with the 'normal' rules are the other options in this box actually evaluated.
Setting the status
With State the rule sets the status of the event in the monitoring. In the rule this state will be WARN or CRIT. Rules that generate OK events can be interesting in exceptions to represent certain events in a purely informative way. In such a case a combination with an automatic expiration of these events is then interesting.
As well as setting an explicit status, there are two more dynamic options. The (set by syslog) setting takes over the classification based on the syslog priority. This only works if the message has already been classified usable by the sender. Messages received directly by syslog will contain one of eight RFC priorities, which are mapped as follows:
| Priority | ID | State | Definition according to syslog |
|---|---|---|---|
|
0 |
CRIT |
system is unusable |
|
1 |
CRIT |
immediate action required |
|
2 |
CRIT |
critical condition |
|
3 |
CRIT |
error |
|
4 |
WARN |
warning |
|
5 |
OK |
normal, but significant information |
|
6 |
OK |
purely informational |
|
7 |
OK |
debug message |
In addition to syslog messages, messages from the Windows Event Log, and messages from text files that have already been classified with the Checkmk Logwatch plug-in on the target system, provide ready-made states. For SNMP traps this is unfortunately not available.
A completely different method is to classify the message based on the text itself. This can be done with the (set by message text) setting:
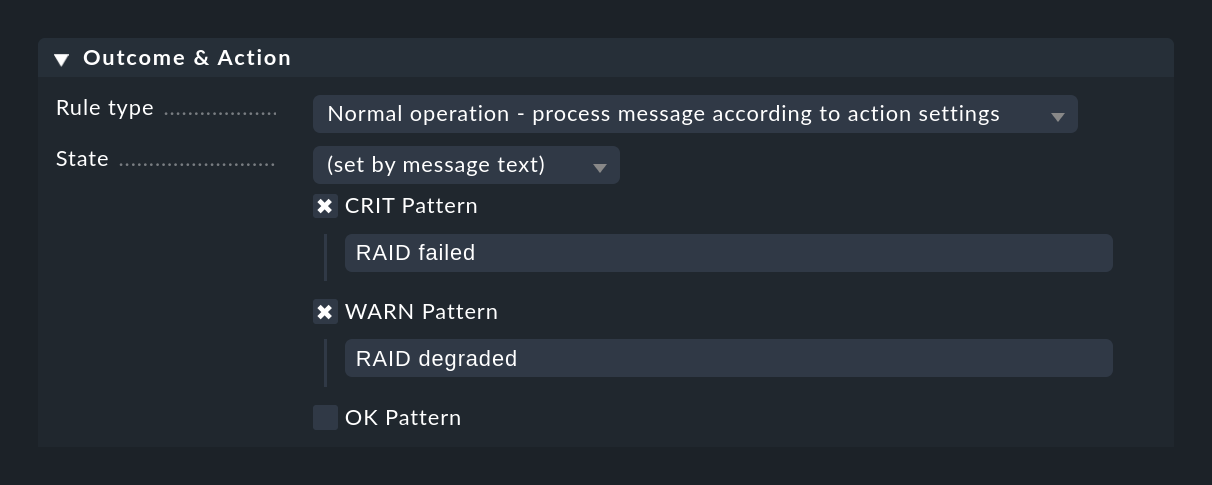
The match to the texts configured here happens only after checking for Text to match and the other rule conditions have been checked, so that you do not have to repeat those checks.
If none of the configured patterns is found, the event returns the UNKNOWN state.
Service levels
The idea behind the Service Level field is that every host and every service in an organization has a certain level of importance. This can be associated with a specific service agreement for the host or service. In Checkmk, you can use rules to assign such service levels to your hosts and services and then, for example, make the notification or self-defined dashboards depend on it.
Since events do not necessarily correlate with hosts or services, the Event Console allows you to assign a service level to an event using a rule. You can then later filter the event views using this level.
By default, Checkmk defines four levels: 0 (no level), 10 (silver), 20 (gold), and 30 (platinum). You can change this selection as required in the Global settings > Notifications > Service Levels. Decisive are the numbers designating the levels, since the levels are sorted by these numbers and also compared according to the relative importance.
Contact groups
The contact groups used for the visibility will also be used for the notification of events. Here you can use rules to assign contact groups explicitly to events. Details can be found in the chapter on monitoring.
Actions
Actions are very similar to Alert Handlers for hosts and services. Here you can have a self-defined script executed when an event is opened. Full details describing the actions can be found below in a separate section.
Automatic deletion (archiving)
Automatic deletion (= archiving), which you can set with Delete event immediately after the actions ensures that an event is not visible in the monitoring at all. This is useful if you only want to trigger some actions automatically or if you only want to archive certain events so that you can search for them later.
5.3. Automated rewriting of texts
With the Rewriting function, an EC rule can automatically rewrite text fields in a message and add annotations. This is configured in a separate box:
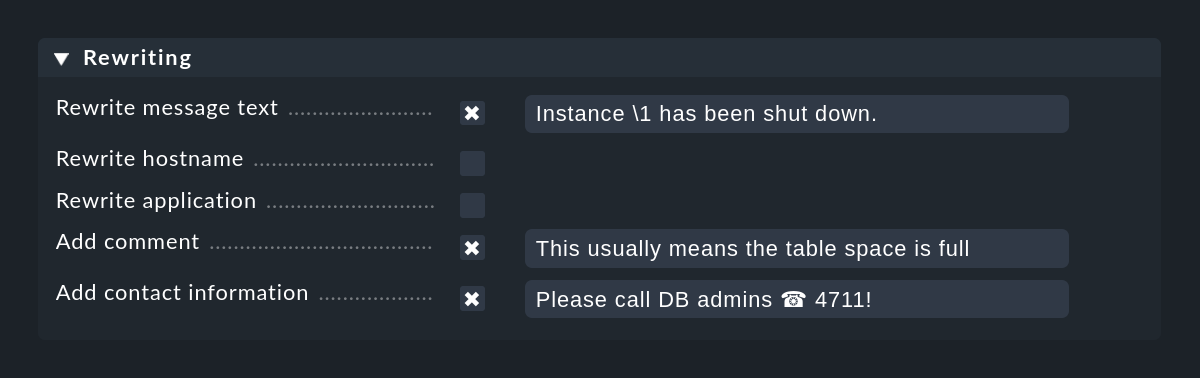
When rewriting, the match groups are particularly important. These allow you to include parts of the original message in the new text. You can access the groups when rewriting as follows:
|
Will be replaced by the first match group in the original message. |
|
Will be replaced by the second match group in the original message (etc.). |
|
Will be replaced by the complete original message. |
In the above screenshot the new message text will be coded as Instance \1 has been shut down.
Of course, this only works if the Text to match in the same rule of the regular search expression also has at least one parenthesis expression.
An example of this would be e.g.:
Some further notes on rewriting:
Rewriting is done after matching and before performing actions.
Match, rewrite and actions are always performed in the same rule. It is not possible to rewrite a message and then process it with a later rule.
The expressions
\1,\2etc. can be used in all text fields, not only in Rewrite message text.
5.4. Automated canceling of events
Some applications or devices are kind enough to later send a suitable OK message as soon as the problem has been solved. You can configure the EC in such a way that in such a case the event opened by the error will be automatically closed. This is referred to as canceling.
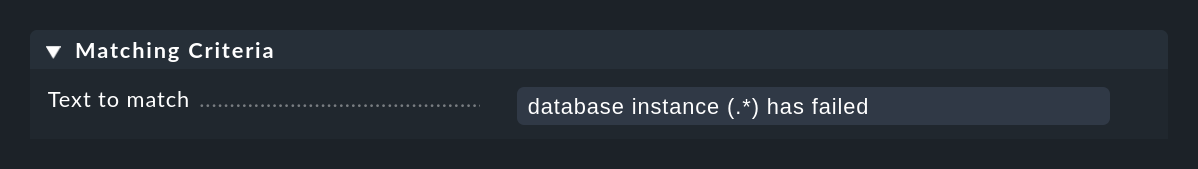
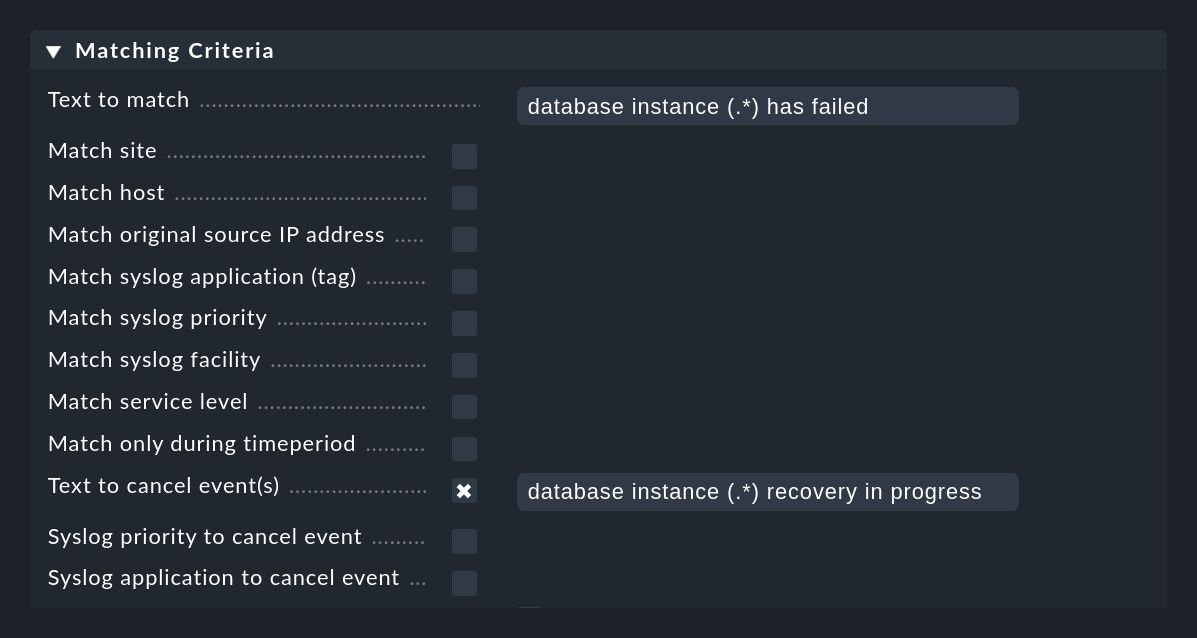
The following figure shows a rule with which messages containing the text database instance (.*) has failed are searched.
The expression (.*) represents an arbitrary string that is trapped in a match group.
The expression database instance (.*) recovery in progress, which is in the Text to cancel event(s) field in the same rule, will automatically close events created with this rule when a matching message is received:
Automatic cancellation works as long as
a message is received whose text matches Text to cancel event(s),
the value captured here in the
(.*)group is identical to the match group from the original message,both messages came from the same host, and
it is the same application (the Syslog application to cancel event field).
The match group principle is very important here.
After all, it would not make much sense if the message database instance TEST recovery in progress would cancel an event that had been generated by the message database instance PROD has failed, would it?
Please don’t make the mistake of using the placeholder \1 in Text to cancel events(s).
This does NOT work!
These placeholders only work for rewriting.
In some cases it happens that a text is used both to create and to cancel an event. In such a case, canceling has priority.
Perform actions when canceling
You can also have actions executed automatically when an event is canceled. It is important to know that when an event is canceled, a number of data fields in the event are overwritten by values from the OK message before any actions are executed. In this way the full data of the OK message is then available in the action script. Additionally, during this phase the event’s state is flagged as OK. In this way an action script can detect an override and you can use the same script for error and OK messages (e.g. when connecting to a ticket system).
The following fields are overwritten from OK message data:
The message text
The timestamp
The time of the last occurrence
The syslog priority
All other fields remain unchanged — including the event ID.
Cancellation in combination with rewriting
If you are using rewrite and cancel in the same rule, you should be careful when rewriting the host name or the application. When canceling, the EC always checks whether the canceling message matches the host name and application of the open event. But if these were rewritten the cancellation would never work.
Therefore, before canceling the event, the Event Console simulates a rewrite of the host name and application to compare the relevant texts. This is probably what you would expect.
You can also take advantage of this behavior if the application field in the error message and the later OK message do not match. In this case, simply rewrite the application field to a known fixed value. This in fact leads to the result that this field will be ignored.
Cancellation based on syslog priority
There are (unfortunately) situations where the text of the error and OK messages is absolutely identical. In most cases the actual status is not coded in the text, but in the in the syslog priority.
For this purpose there is the Syslog priority to cancel event option.
Here enter the range debug … notice for example.
All priorities in this range are normally considered to have an OK status.
When using this option you should still enter a suitable text in the Text to cancel event(s) field, otherwise the rule will match on all OK messages that affect the same application.
5.5. Counting messages
In the Counting & Timing box you will find options for counting similar messages. The idea is that some messages are only relevant if they occur too frequently or too rarely within specified time periods.
Too frequent messages
You can activate the check for messages that occur too often with the Count messages in interval option:
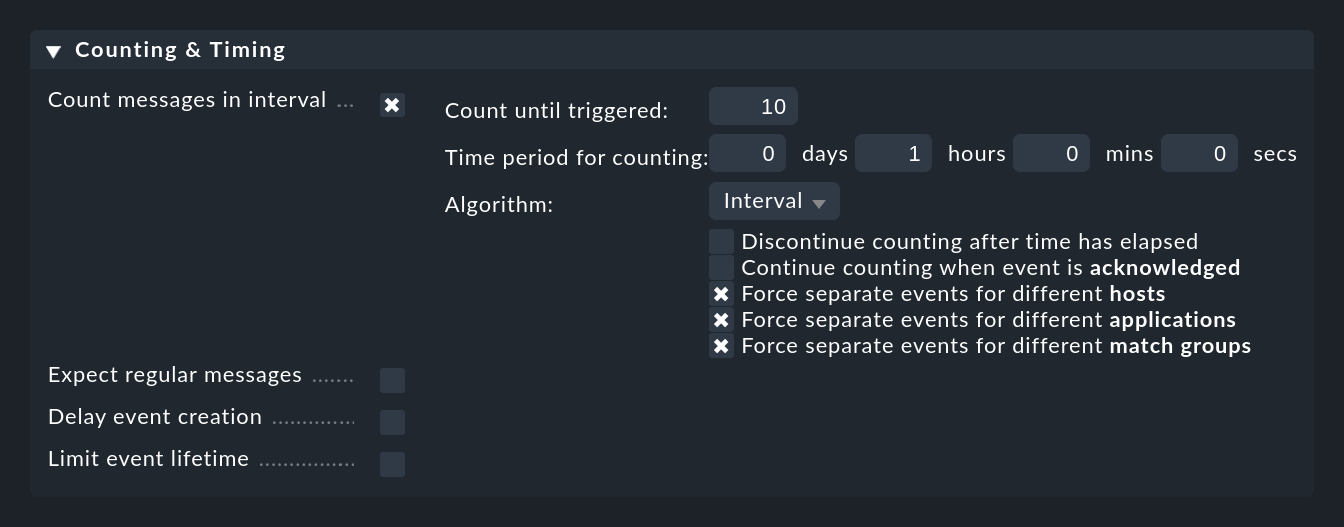
Here you first specify a time period at Time period for counting and the number of messages which should lead to the opening of an event at Count until triggered. In the example above this is set to 10 messages per hour. Of course these are not 10 arbitrary messages, rather messages that are matched by the rule.
Normally it makes sense not to count all matching messages globally, but only those which refer to the same 'cause'. To control this, there are the three checkboxes for options prefixed by Force separate events for different …. These are preset in such a way that messages are only counted together if they match in:
host
application
This allows you to formulate rules such as 'If more than 10 messages are received per hour from the same host, the same application and there the same site, then…'. Due to the rule this can result in multiple differing events being generated.
If, for example, you deselect all three checkboxes, then the counting will be done only globally and the rule will be able to generate only one event in total!
By the way, it can make sense to enter 1 as the count. In this way you can effectively get a grip on 'event storms'. If, for example in a short time frame 100 messages of the same kind are received, then nevertheless only one event will be created. You will then see in the event details
the time the first message occurred,
the time the most recent message occurred, and
the total number of messages combined in this event.
When the case is then closed, via two checkboxes you can define when a new event should be opened. Normally an acknowledgement of the event creates a situation that if further messages are received, a new count is started and a new event is triggered. You can disable this function with Continue counting when event is acknowledged.
The Discontinue counting after time has elapsed option ensures that a separate event is always opened for each comparison period. In the above example a threshold of 10 messages per hour was specified. If this option is enabled, a maximum of 10 messages of one hour will be added to an already opened event. As soon as the hour has elapsed, if a sufficient number of messages have been received a new event will be opened.
For example, if you set the number to 1 and the time interval to one day, you will only see a maximum of one event of this message type per day.
The Algorithm setting may be a bit surprising at first sight. But let’s be realistic: What do you actually mean by '10 messages per hour'? Which hour is meant by that? Always full hours of the time of day? It could be that in the last minute an one hour nine messages are received, and nine more in the first minute of the next hour. That then makes 18 messages in only two minutes of elapsed time, but still less than 10 per hour, and so the rule would not apply. That doesn’t sound very reasonable …
Since there is no single solution to this problem, Checkmk provides three different definitions of exactly what '10 messages per hour' should mean:
| Algorithm | Functionality |
|---|---|
Interval |
Counting interval starts at the first incoming matching message. An event in the counting phase is generated. If the specified time elapses before the count is reached, the event is silently deleted. However, if the count is reached before the time expires, the event is opened immediately (and any configured actions are triggered). |
Token Bucket |
This algorithm does not work with fixed time intervals, but implements a method that is often used in networks for traffic shaping. Suppose you have configured 10 messages per hour. That’s an average of one every 6 minutes. The first time a matching message is received, an event is generated in the counting phase and the count is set to 1. For each subsequent message, this is increased by 1. And every 6 minutes, the counter is decreased by 1 again — regardless of whether a message has come or not. If the counter drops to 0 again, the event is deleted. So the trigger is fired when the rate of messages on average is permanently above 10 per hour. |
Dynamic Token Bucket |
This is a variant of the Token Bucket algorithm, where the smaller the counter is at any given time, the slower it decreases. In the above example, if the counter was 5, it would only decrease every 12 minutes instead of every 6 minutes. The overall effect of this is that notification rates just above the allowed rate will open an event (and thus be notified) much faster. |
So which algorithm should you choose?
Interval is the simplest to understand and easier to follow if you later want to perform an exact count in your syslog archive.
Token Bucket on the other hand is smarter and 'softer'. There are fewer anomalies at the edges of the intervals.
Dynamic Token Bucket makes the system more reactive and generates notifications faster.
Events that have not yet reached the set number, are latent but not automatically visible to the operator. They are in the counting phase. You can make such events visible with the phase filter in the event view:

Too infrequent or missing messages
Just as the arrival of a particular message can mean a problem, so too the absence of a message can also mean a problem. You may expect at least one message per day from a particular job. If this message does not arrive, the job is probably not running and should be fixed urgently.
You can configure something like this under Counting & Timing > Expect regular messages:
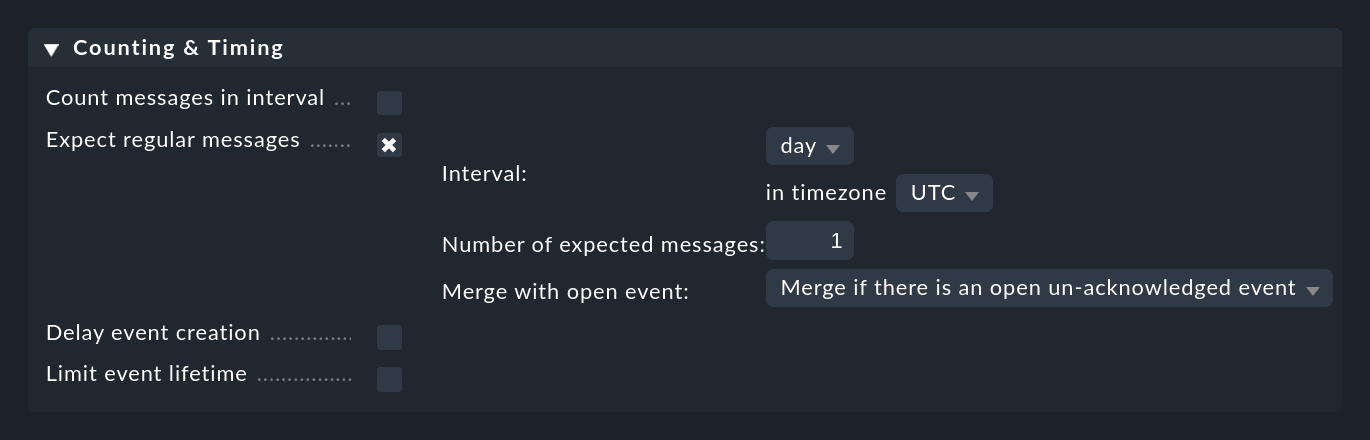
As with counting, you need to specify a time period in which you expect the message(s) to appear. Here, however, a completely different algorithm is used, which makes much more sense at this point. The time period is always aligned exactly to defined positions. For example, the interval hour always starts at minute and second zero. You have the following options:
| Interval | Alignment |
|---|---|
10 seconds |
On a number of seconds divisible by 10 |
minute |
On the full minute |
5 minutes |
At 0:00, 0:05, 0:10, etc. |
15 minutes |
At 0:00, 0:15, 0:30, 0:45, etc. |
hour |
At the beginning of every full hour |
day |
Exactly at 00:00, but in a configurable time zone. This also allows you to say that you expect a message between 12:00 and 12:00 the next day. For example, if you are in the UTC +1 time zone yourself, specify UTC -11 hours. |
two days |
At the beginning of a full hour. You can specify a time zone offset from 0 to 47 here, referring to 1970-01-01 00:00:00 UTC. |
week |
At 00:00 on Thursday morning in the UTC time zone plus the offset, which you can output in hours. Thursday because 1/1/1970 — the start of the "epoch", was on a Thursday. |
Why is this so complicated? This is to avoid false alarms. Do you expect one message from a backup per day for instance? Surely there will be slight differences in the runtime of the backup, so that the messages are not received exactly 24 hours apart. For example, if you expect the message to arrive around midnight, give or take an hour or two, an interval from 12:00 to 12:00 will be much more realistic than one from 00:00 to 00:00. However, should the message fail to appear you will only receive a notification at 12:00 o’clock midday.
Multiple occurrences of the same problem
The Merge with open event option is preset in such a way that in the case of the same message appearing repeatedly, the existing event will be updated. You can alter this so that a new event is opened each time.
5.6. Timing
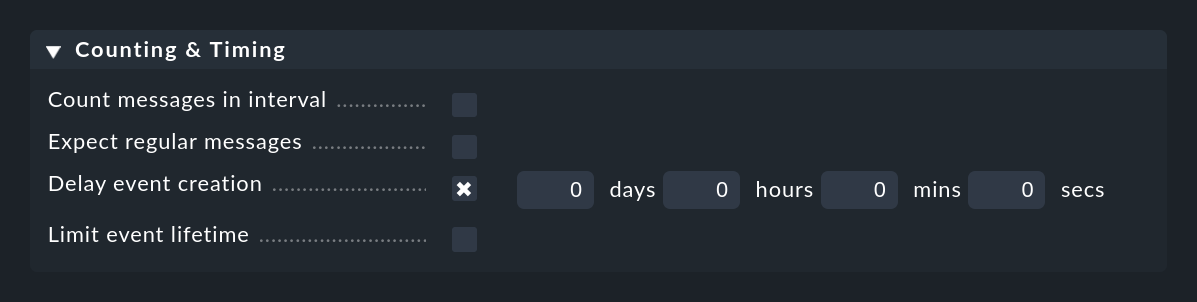
Under Counting & Timing there are two options which affect the opening and/or automatic closing of events.
The Delay event creation option is useful if you are working with the automatic canceling of events. Set e.g. a delay of 5 minutes, then in the case of an error message the event created will remain in the delayed state for 5 minutes — in the hope that the OK message will arrive within this time. If this is the case, the event is closed automatically and without fuss, and does not appear in the monitoring. If the time expires, however, the event will be opened and any of its possibly defined actions will be executed:
More or less the opposite is done by Limit event lifetime. With this you can cause events to close automatically after a certain time. This is useful, for example, for informational events with an OK status that you would like to display, but for which you do not want the monitoring to generate any activity. By automatically 'switching out' you save yourself the manual deletion of such messages:
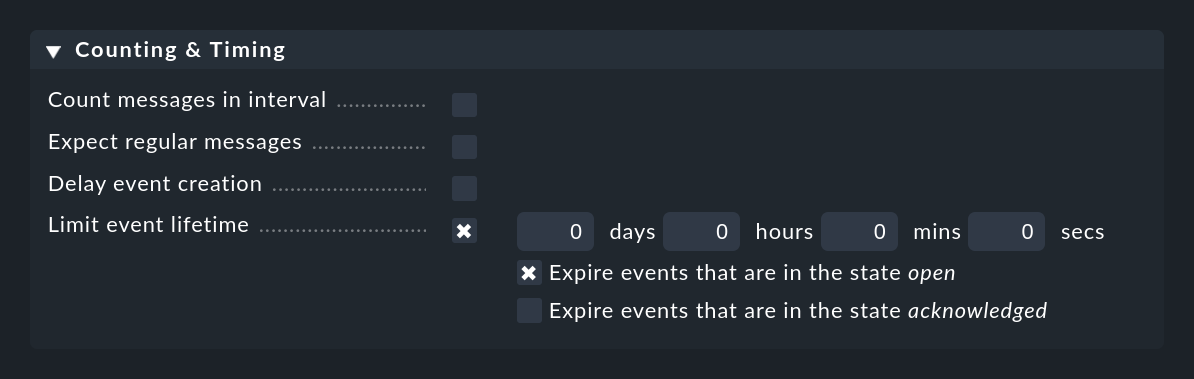
Acknowledging the message will stop the switching out for the time being. This behavior can be controlled with the two checkboxes.
5.7. Rule packages
Rule packages not only have the benefit of making things more manageable, but they can also simplify the configuration of multiple similar rules and at the same time speed up the evaluation.
Suppose you have a set of 20 rules that all revolve around the Windows Event Log Security. All of these rules have in common that they check in the condition for a certain text in the application field (the name of this log file is used in the messages from the EC as Application). In such a case, proceed as follows:
Create your own rule package.
Create the 20 rules for Security in this package or move them there (selection list Move to pack… on the right side of the rules table).
Remove the condition on the application from all of these rules.
Create as the first rule in the package a rule by which messages leave the package immediately if the application is not Security.
This exclusion rule is structured as follows:
Matching Criteria > Match syslog application (tag) on
Security.Matching Criteria > Invert matching on Negate match: Execute this rule if the upper conditions are not fulfilled.
Outcome & Action > Rule type on Skip this rule pack, continue rule execution with next rule pack
Any message that does not come from the security log will be 'rejected' by the first rule in this package. This not only simplifies the rest of the rules in the package, but also speeds up the processing, since in most cases the other rules do not have to be checked at all.
6. Actions
6.1. Types of actions
The Event Console includes three types of actions, which you can execute either manually or when opening or canceling events:
Executing self-written shell scripts.
Sending self-defined emails
Generating Checkmk notifications
6.2. Shell scripts and emails
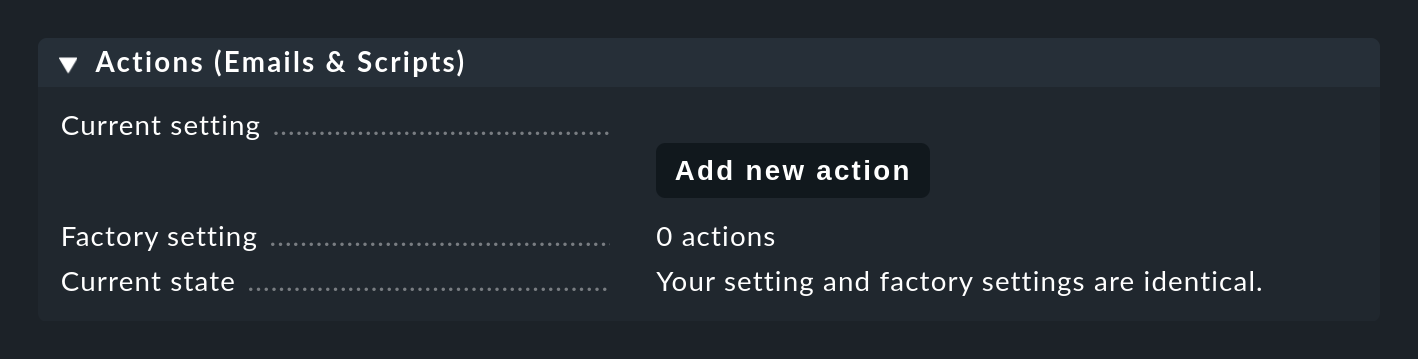
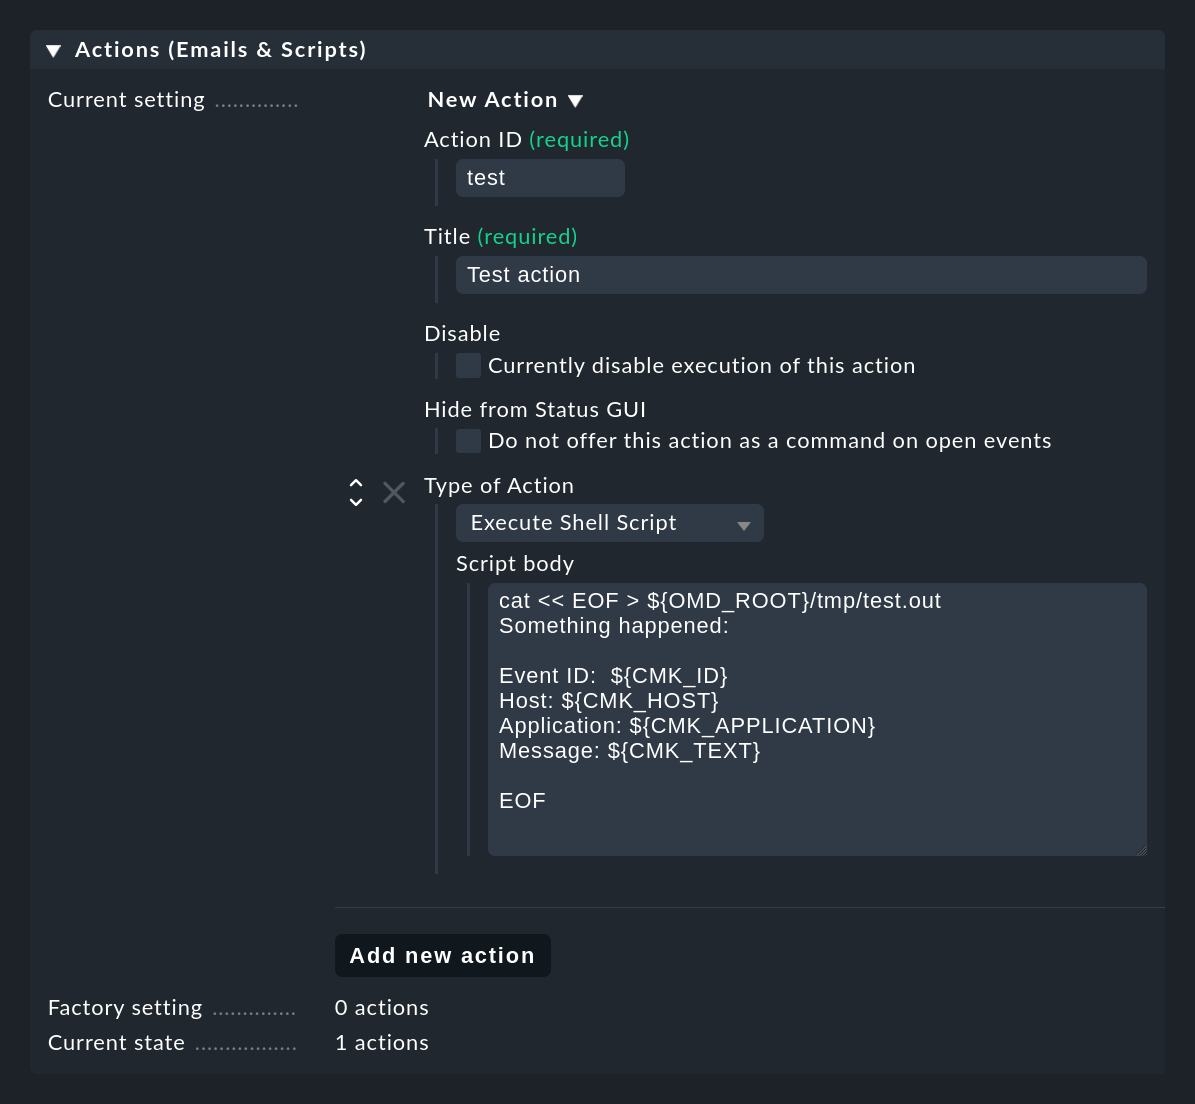
You must first define emails and scripts in the Event Console settings. You can find these under the Actions (Emails & Scripts) entry:
Executing shell scripts
With the Add new action button you can create a new action.
The following example shows how to create a simple shell script as an action of the Execute Shell Script type.
Details for the events are available to the script via environment variables,
for example the $CMK_ID of the event, the $CMK_HOST, full text $CMK_TEXT or the first match group as $CMK_MATCH_GROUP_1.
For a complete list of available environment variables, see the ![]() inline help.
inline help.
Older versions of Checkmk allowed environment variables as well as macros such as $TEXT$ which were replaced before the script was executed.
Because of the danger that an attacker could inject commands via a specially crafted UDP packet that is executed with the privileges of the Checkmk process, you should not make use of macros.
Macros are currently still supported for for compatibility reasons, but we reserve the right to remove them in a future version of Checkmk.
The sample script shown in the screenshot creates the file tmp/test.out in the site directory in which it writes a text containing the concrete values for the variables for the respective last event:
cat << EOF > ${OMD_ROOT}/tmp/test.out
Something happened:

Event-ID: $CMK_ID
Host: $CMK_HOST
Application: $CMK_APPLICATION
Message: $CMK_TEXT
EOF
The scripts are executed under the following environment:
/bin/bashis used as the interpreter.The script runs as the site user with the site’s home directory (e.g.
/omd/sites/mysite).While the script is running processing of other events is stopped!
If your script possibly contains wait times, you can make it run asynchronously using the at Linux spooler.
To do this, create the script in a separate local/bin/myaction file and start it with the at command, e.g.:
echo "$OMD_ROOT/local/bin/myaction '$HOST$' '$TEXT$' | at nowSending emails
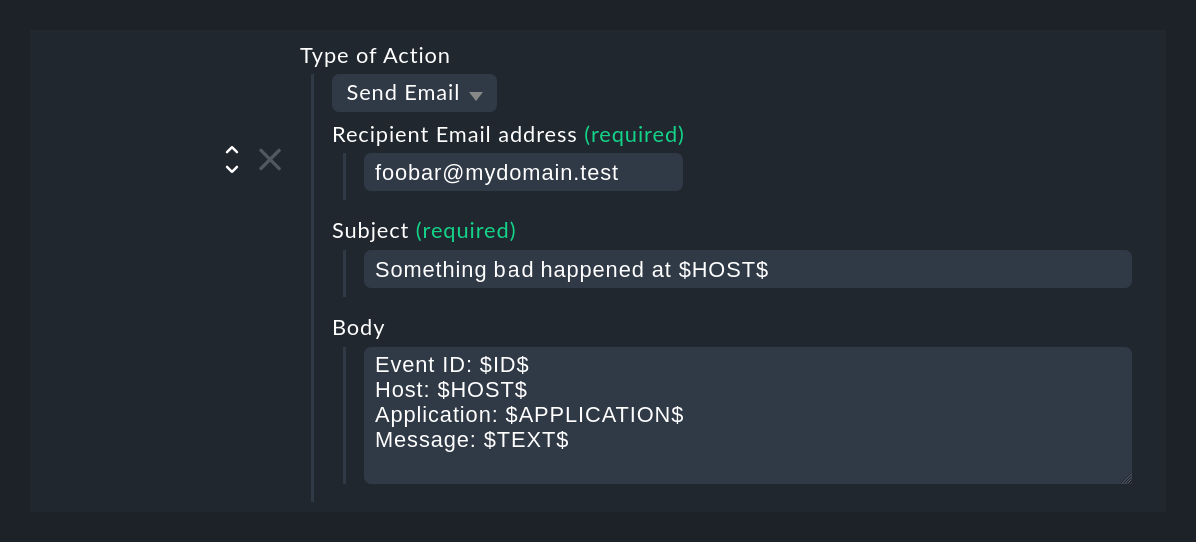
The Send Email action type sends a simple text email.
You could actually also do this with a script, for instance by using the mail command line command.
But this way it is more convenient.
Please note that placeholders are also allowed in the Recipient email address and Subject fields.
6.3. Notifications through Checkmk
In addition to executing scripts and sending (simple) emails, the EC has a third type of action: sending notifications via the Checkmk notification system. Notifications can be generated by the EC in the same way as the host and service notifications from the active monitoring. The advantages compared to the simple emails as described above are obvious:
Notification is configured for active and event-based monitoring together in a central location.
Features such as bulk notifications, HTML emails and other useful functions are available.
Custom notification rules, turning off notifications and the like work as usual.
The Send monitoring notification action type always processes automatically and does not need to be configured.
Since events differ somewhat from the 'normal' hosts or services, there are some peculiarities in their notifications, which you can learn about in more detail in the following section.
Assignment to existing hosts
Events can come from any host — regardless of whether they are configured in the active monitoring or not. After all, the syslog and SNMP ports are open to all hosts on the network. As a result the extended host attributes such as alias, host tags, contacts, etc. are initially not available. This in particular is why conditions in notification rules do not necessarily work as you would expect them to.
For example, when notifying, the EC attempts to find a host within the active monitoring that matches the event. This is done using the same procedure is used as that for visibility of events. If such a host can be found, the following data is taken from this host:
The correct spelling of the host name.
The host alias
The primary IP address configured in Checkmk.
The host tags
The folder in the Setup GUI
The list of contacts and contact groups
As a result, the host name in the processed notification may not exactly match the host name in the original message. The coding of notification texts that conform with those from the active monitoring, however, simplifies the formulation of uniform notification rules which include conditions that apply to the host name.
The mapping is done in real time by sending an Livestatus query to the monitoring core which runs in the same site as the EC that received the message. Of course this only works if the syslog messages, SNMP traps etc. are always sent to the Checkmk site on which the host is being actively monitored!
If the query does not work or the host cannot be found, substitute data will be accepted:
Host name |
The host name from the event. |
Host alias |
The host name will be used as alias. |
IP address |
The IP address field contains the address of the original sender of the message. |
Host tags |
The host will not receive a host tag. If you have host tag groups with empty tags, the host adopts those tags, but otherwise it has no tags from the group. Please keep this in mind when you define conditions referring to host tags in the notification rules. |
Setup GUI folder |
No folder. All conditions that go to a specific folder are thus unfulfillable — even in the case of the main folder. |
Contacts |
The list of contacts is empty. If fallback contacts are present, they will be entered. |
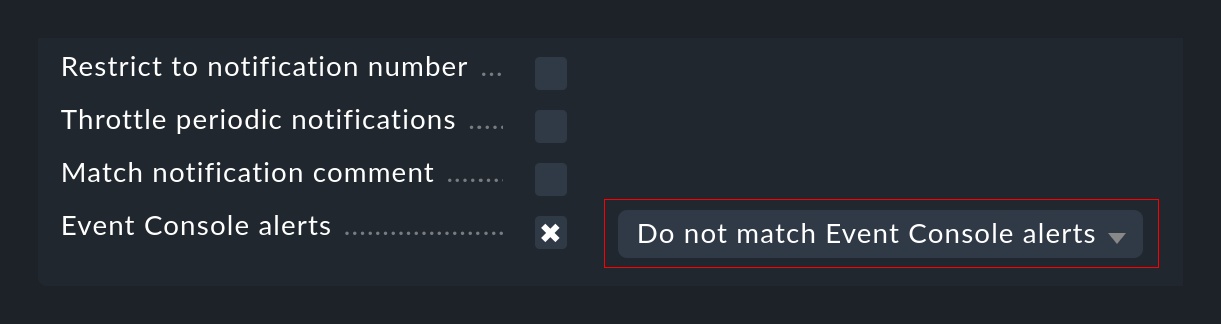
If the host cannot be assigned in the active monitoring, this can of course lead to problems with the notifications. On the one hand because of the conditions, which may then no longer apply, and also because of the contact selection. For such cases you can modify your notification rules so that notifications from the Event Console are handled specifically using their own rules. For this purpose there is a separate condition with which you can either match positively only to EC notifications, or vice versa exclude them:
Remaining notification fields
In order for notifications from the EC to pass through the active monitoring’s notification system, the EC must be adapted to to conform to its scheme. In the process the typical data fields for a notification are filled as effectively as possible. We have just described how the host’s data is determined. Further fields are:
Notification type |
EC notifications are always considered to be Service messages. |
Service description |
This is the content of the event’s Application field. If this field is empty, |
Notification number |
This is fixed to |
Date/Time |
For events that are counted, this is the time of the latest occurrence of a message associated with the event. |
Plug-in output |
The text content of the event. |
Service state |
State of the event, i.e. OK, WARN, CRIT or UNKNOWN. |
Previous state |
Since events have no previous state, OK is always entered here for normal events, and CRIT is always entered here when canceling an event. This rule is closest to what is needed for notification rules that have a condition on the exact state change. |
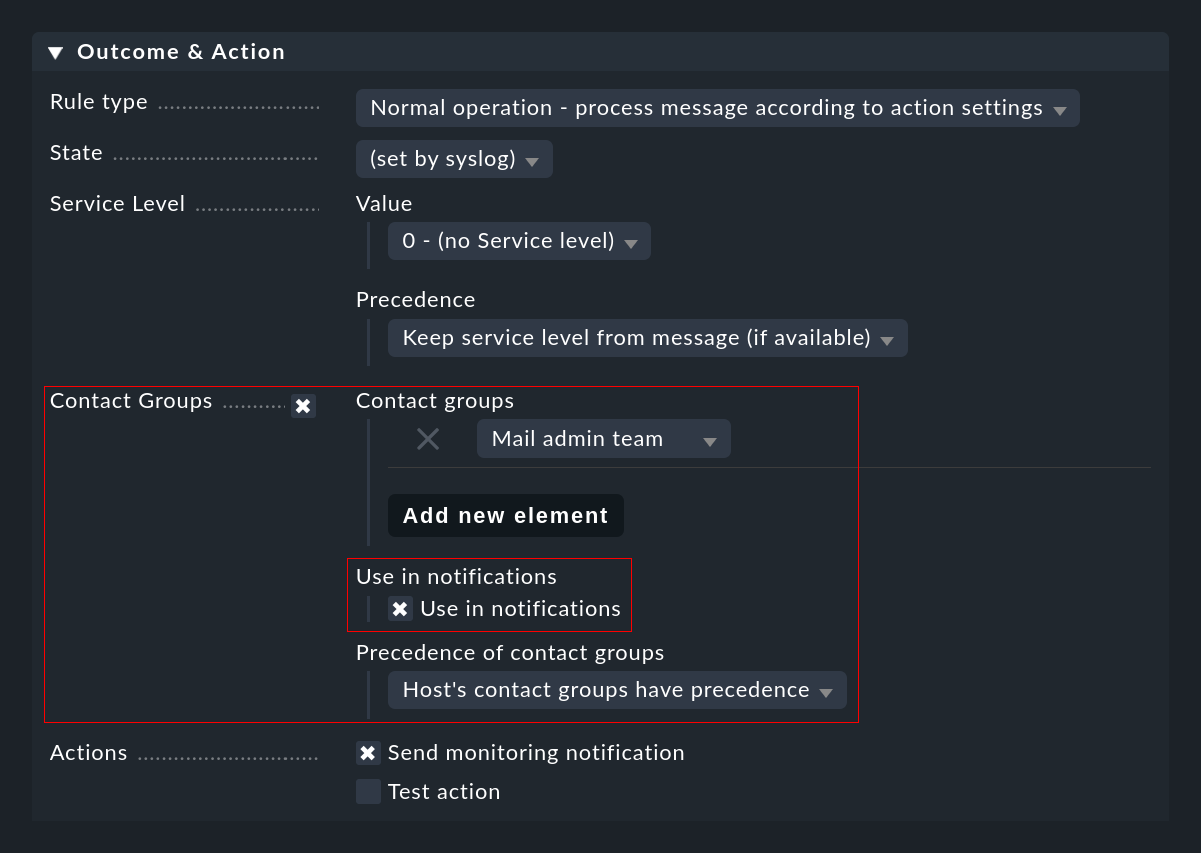
Manually defining contact groups
As described above, it may not be possible to determine the contacts for an event automatically. In such cases you can specify contact groups directly in the EC rule which is to be used for the notification. It is important that you do not forget to check the Use in notifications box:
Global switch for notifications
There is a central switch for notifications in the Master control snap-in. This also applies to notifications forwarded by the EC:

Just as with the host assignment, querying the switch by the EC requires Livestatus access to the local monitoring core. A successful query can be seen in the log file from the Event Console:
[1482142567.147669] Notifications are currently disabled. Skipped notification for event 44Host scheduled downtimes
The Event Console is able to detect hosts that are currently in a scheduled downtime and does not send notifications in such situations. In the log file it will look like this:
[1482144021.310723] Host myserver123 is currently in scheduled downtime. Skipping notification of event 433.Of course, this also requires the host to be successfully found in the active monitoring. If this is not successful, it is assumed that the host is not in downtime and a notification will in any case be generated.
Additional macros
When you write your own notification scripts, especially for notifications coming from the Event Console a number of additional variables will be available that describe the original event (accessed as usual with the prefix NOTIFY_):
|
Event ID. |
|
ID of the rule that created the event. |
|
Syslog priority as a number from |
|
Syslog facility — also as a number. The value range is from |
|
Phase of the event. Since only open events trigger actions, this should be |
|
The comment field of the event. |
|
The Owner field. |
|
The comment field with the event-specific contact information. |
|
The ID of the process which sent the message (for syslog events). |
|
The match groups from matches in the rule. |
|
The optional manually defined contact groups in the rule. |
6.4. Executing actions
Above in Commands you have already learned about the manual execution of actions by the operator. More exciting is the automatic execution of actions, which you can configure with EC rules in the Outcome & Action section:
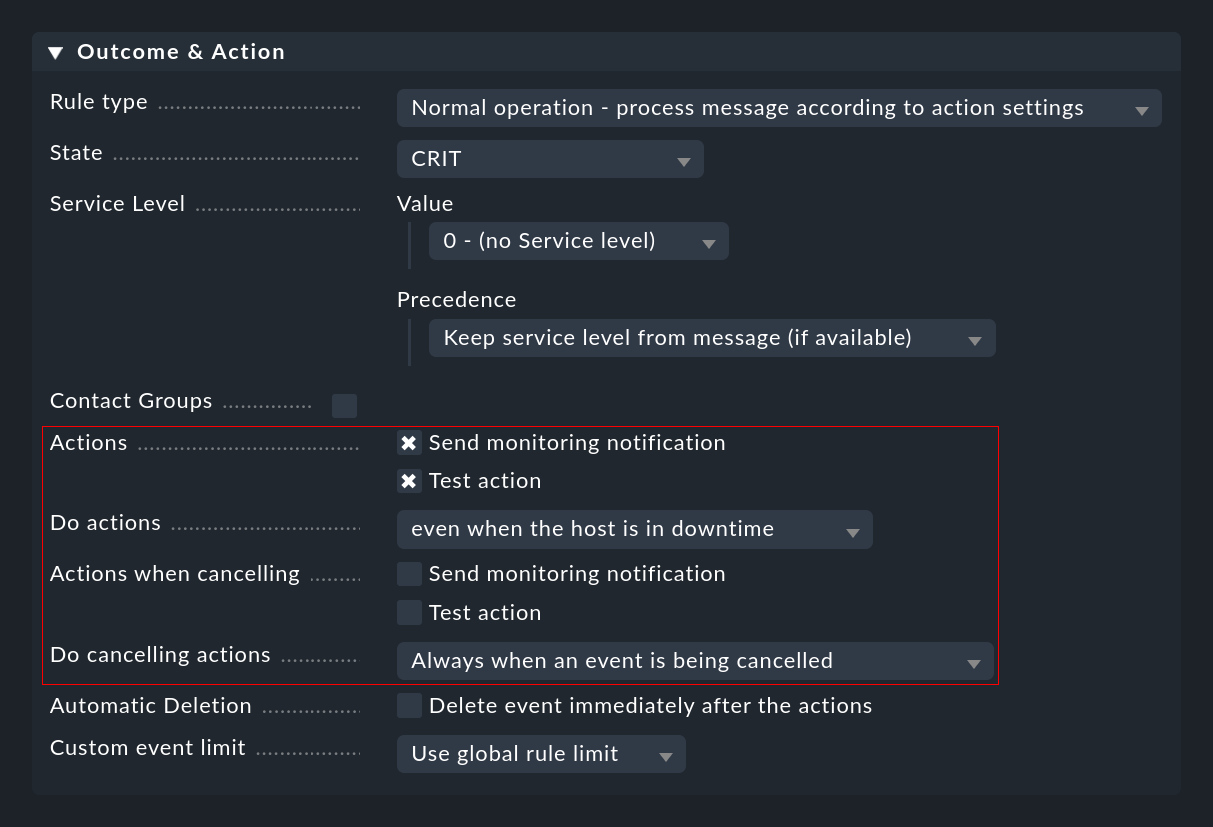
Here you can select one or more actions that will be executed whenever an event is opened or canceled based on the rule. For the latter you can use the Do cancelling actions list to specify whether the action should only be executed if the canceled event has already reached the open phase. When using counting or delay it can happen that events that are still in the waiting state and not yet visible to the user are canceled .
The execution of actions is recorded in the log file var/log/mkeventd.log:
[1481120419.712534] Executing command: ACTION;1;cmkadmin;test
[1481120419.718173] Exitcode: 0
These are also written in the archive.
7. SNMP traps
7.1. Setting up SNMP trap reception
Since the Event Console has its own built-in SNMP engine, setting the reception of SNMP traps is very simple.
You do not need snmptrapd from the operating system!
If you already have this running, please stop it.
As described in the section about the setup of the Event Console, use omd config to enable the trap receiver in this site:
Since on each server the UDP port for the traps can be used by only one process, this may only be done in one Checkmk site per computer.
When starting the site, in the line containing mkeventd you can check whether the trap reception has been enabled:
OMD[mysite]:~$ omd start
Creating temporary filesystem /omd/sites/mysite/tmp...OK
Starting mkeventd (builtin: snmptrap)...OK
Starting liveproxyd...OK
Starting mknotifyd...OK
Starting rrdcached...OK
Starting cmc...OK
Starting apache...OK
Starting dcd...OK
Starting redis...OK
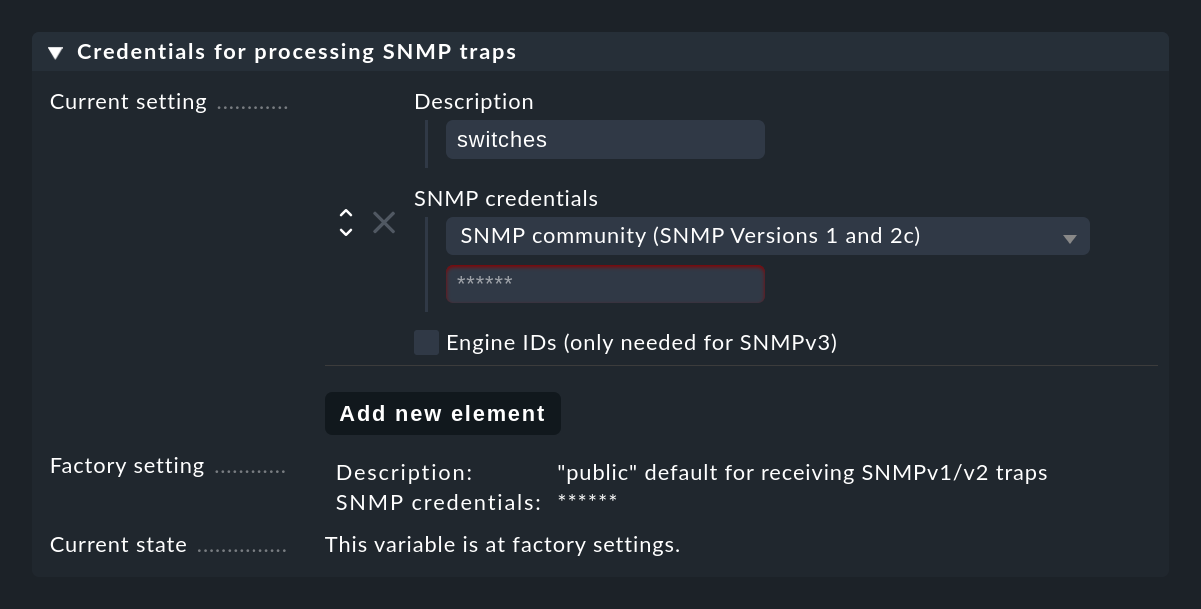
Initializing Crontab...OKFor SNMP traps to work, the sender and receiver must agree on certain credentials. In the case of SNMP v1 and v2c this is a simple password, which is known as a 'Community'. With Version 3 you need a few more credentials. You configure these credentials in the Event Console settings under Credentials for processing SNMP traps. You can use the Add new element button to set up several different credentials which can be used as alternatives by the devices:
The much more complex part is now, of course, to specify the target address for all the devices that are to be monitored and to configure the credentials here as well configure the credentials.
7.2. Testing
Unfortunately very few devices offer meaningful testing capabilities.
At least you can easily test the reception of traps manually using the Event Console itself by sending a test trap — preferably from another Linux system.
This can be done with the snmptrap command.
The following example sends a trap to 192.168.178.11.
The sender’s own host name is specified after .1.3.6.1 and must be resolvable or be specified as an IP address (here 192.168.178.30):
user@host:~$ snmptrap -v 1 -c public 192.168.178.11 .1.3.6.1 192.168.178.30 6 17 '' .1.3.6.1 s "Just kidding"If you have set the Log level to Verbose logging in the settings, you will be able to see the reception and evaluation of the traps in the EC’s log file:
[1482387549.481439] Trap received from 192.168.178.30:56772. Checking for acceptance now.
[1482387549.485096] Trap accepted from 192.168.178.30 (ContextEngineId "0x80004fb8054b6c617070666973636816893b00", ContextName "")
[1482387549.485136] 1.3.6.1.2.1.1.3.0                        = 329887
[1482387549.485146] 1.3.6.1.6.3.1.1.4.1.0                    = 1.3.6.1.0.17
[1482387549.485186] 1.3.6.1.6.3.18.1.3.0                     = 192.168.178.30
[1482387549.485219] 1.3.6.1.6.3.18.1.4.0                     =
[1482387549.485238] 1.3.6.1.6.3.1.1.4.3.0                    = 1.3.6.1
[1482387549.485258] 1.3.6.1                                  = Just kidding
In the event of incorrect credentials, you will only see a single line:
[1482387556.477364] Trap received from 192.168.178.30:56772. Checking for acceptance now.And this is how an event generated by such a trap looks like:

7.3. Turning numbers into text: Translating traps
SNMP is a binary protocol and it is very sparing with its textual descriptions of the messages.
The trap type is communicated internally by a sequence of numbers in the so-called OIDs.
These are displayed as sequences of numbers separated by points (e.g. 1.3.6.1.6.3.18.1.3.0).
With the help of so-called MIB files the Event Console can translate these numeric sequences into texts.
So, for example, 1.3.6.1.6.3.18.1.3.0 becomes the text SNMPv2-MIB::sysUpTime.0.
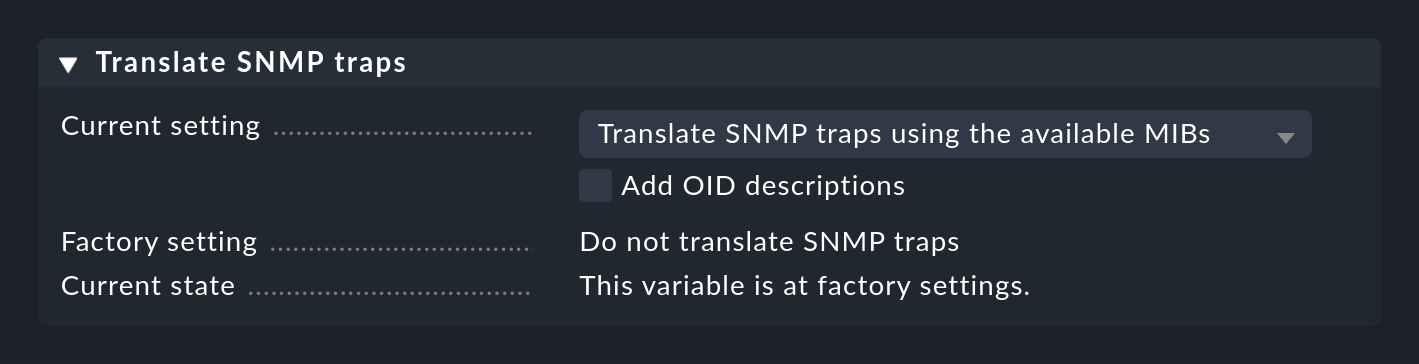
The translation of the traps can be enabled in the Event Console settings:
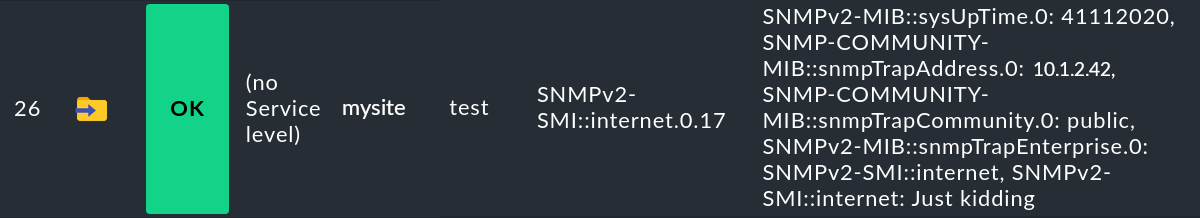
The test trap from above now generates a slightly different event:
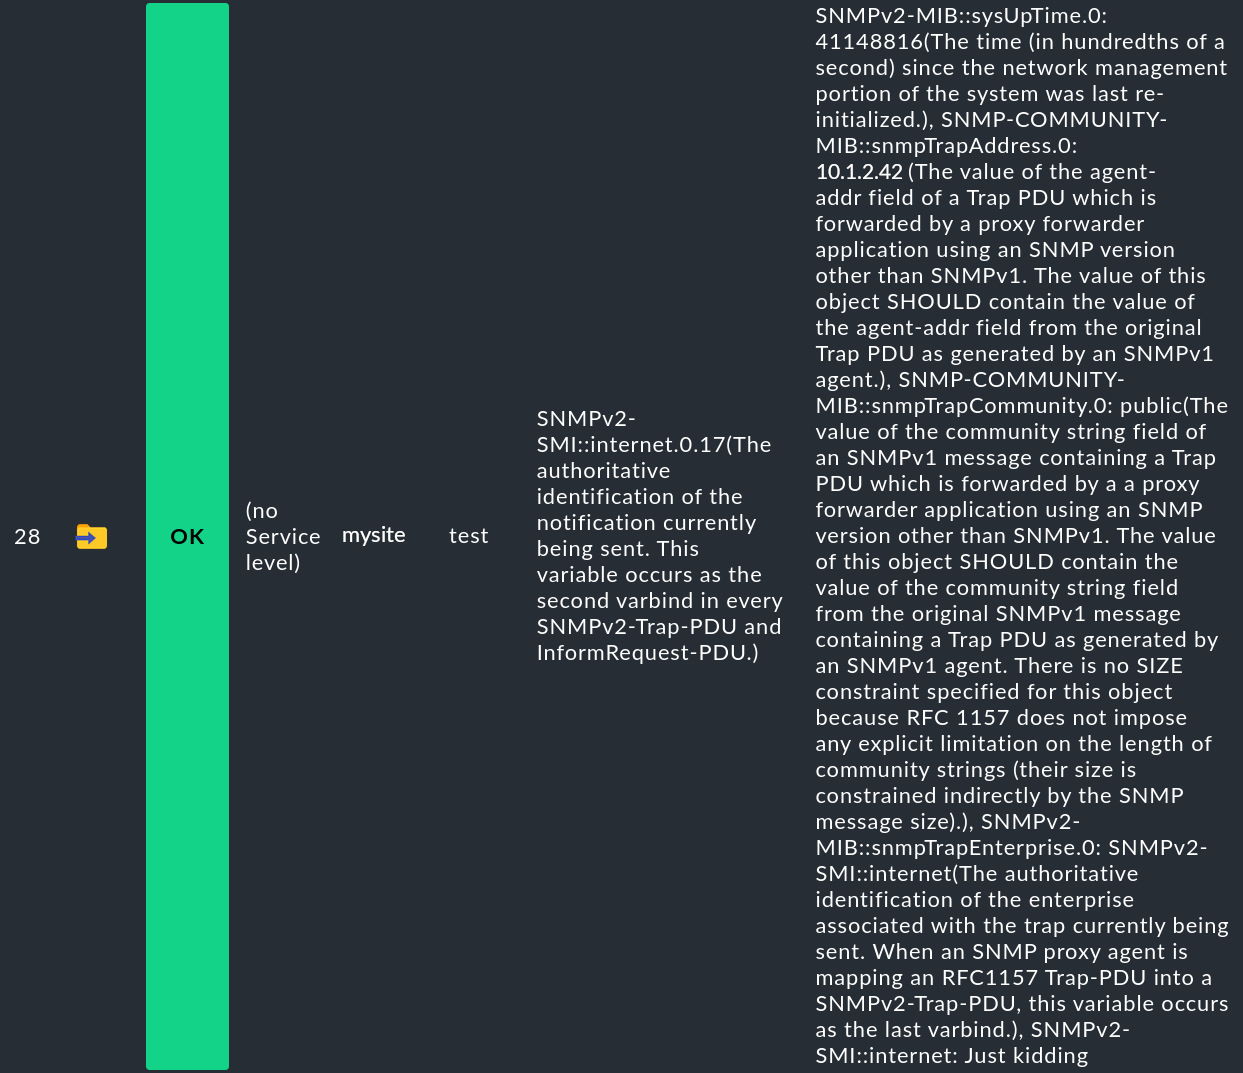
If you have activated the Add OID descriptions option, the whole thing gets much more detailed — and more confusing. It does however help to better understand what a trap actually does:
7.4. Uploading your own MIBs
Regrettably, the advantages of open source have not yet spread to the authors of MIB files, and so we from the Checkmk project are unfortunately not able to deliver vendor specific MIB files.
Only a small collection of free basic MIBs is preinstalled, which for example provides for a translation of sysUpTime.
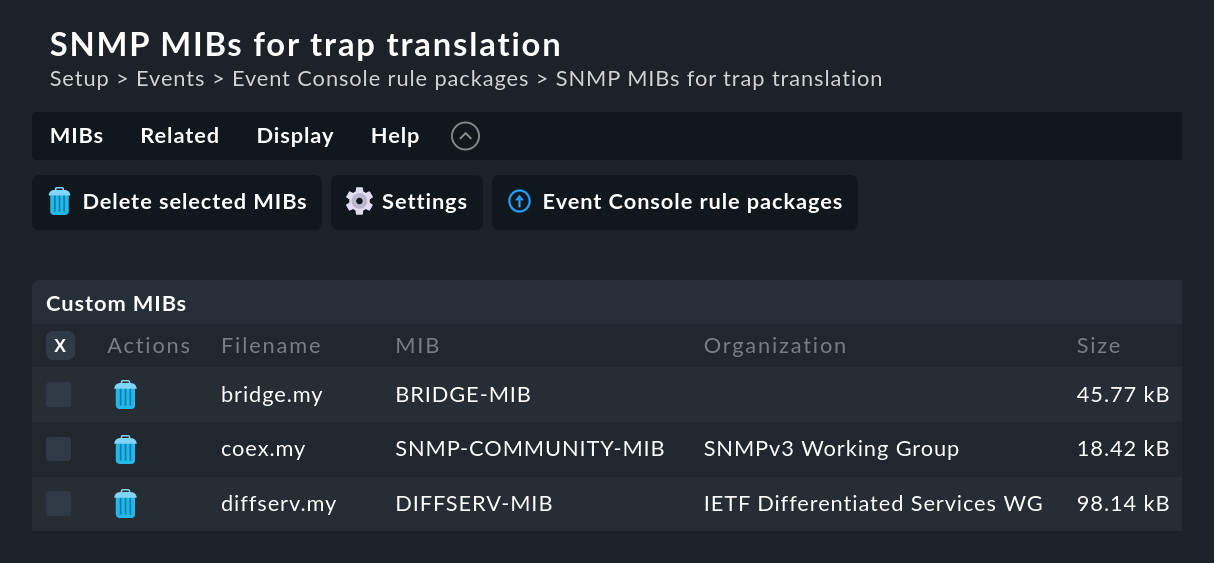
You can however add these files to the Event Console in the SNMP MIBs for trap translation module via the menu entry ![]() Add one or multiple MIBs to upload your own MIB files, as the following has done with some MIBs from Netgear Smart Switches:
Add one or multiple MIBs to upload your own MIB files, as the following has done with some MIBs from Netgear Smart Switches:
Notes on the MIBs:
The uploaded files are stored under
local/share/snmp/mibs. You can also store them there manually if the method via the GUI is too cumbersome for you.Instead of single files you can also upload ZIP files with MIB collections in a single action.
MIBs have dependencies amongst each other. Missing MIBs will be shown to you by Checkmk.
The uploaded MIBs are also used on the command line by
cmk --snmptranslate.
8. Monitoring log files
The Checkmk agent is able to analyze log files via the Logwatch plug-in. This plug-in first of all provides its own monitoring of log files independently of the Event Console — including the possibility of acknowledging messages directly in the monitoring. There is also the possibility of transferring the messages found by the plug-in 1:1 into the Event Console.
In the Windows agent, the log file monitoring is permanently integrated — in the form of a plug-in for the evaluation of text files and one for the evaluation of Windows Event Logs.
The Python-coded plug-in mk_logwatch is available or Linux and Unix.
All three can be accessed via the Agent Bakery for their set up or configuration.
Use the following rule sets to do so:
Text logfiles (Linux, Solaris, Windows)
Finetune Windows Eventlog monitoring
The precise configuration of the Logwatch plug-in is not the subject of this article. What is important, however, is that you still perform the best possible pre-filtering of the messages in the Logwatch plug-in itself and do not just send the complete contents of the text files to the Event Console.
Please don’t confuse this with the subsequent reclassification via the Logfile patterns rule set. This can only change the status of messages that have already been sent by the agent. However, if you have already set up these templates and want to simply switch from Logwatch to the Event Console, you can keep the patterns. For this purpose, the forwarding rules (Logwatch Event Console Forwarding) include the option Reclassify messages before forwarding them to the EC.
In this case, all messages pass through a total of three rule chains: on the agent, through reclassification and in the Event Console!
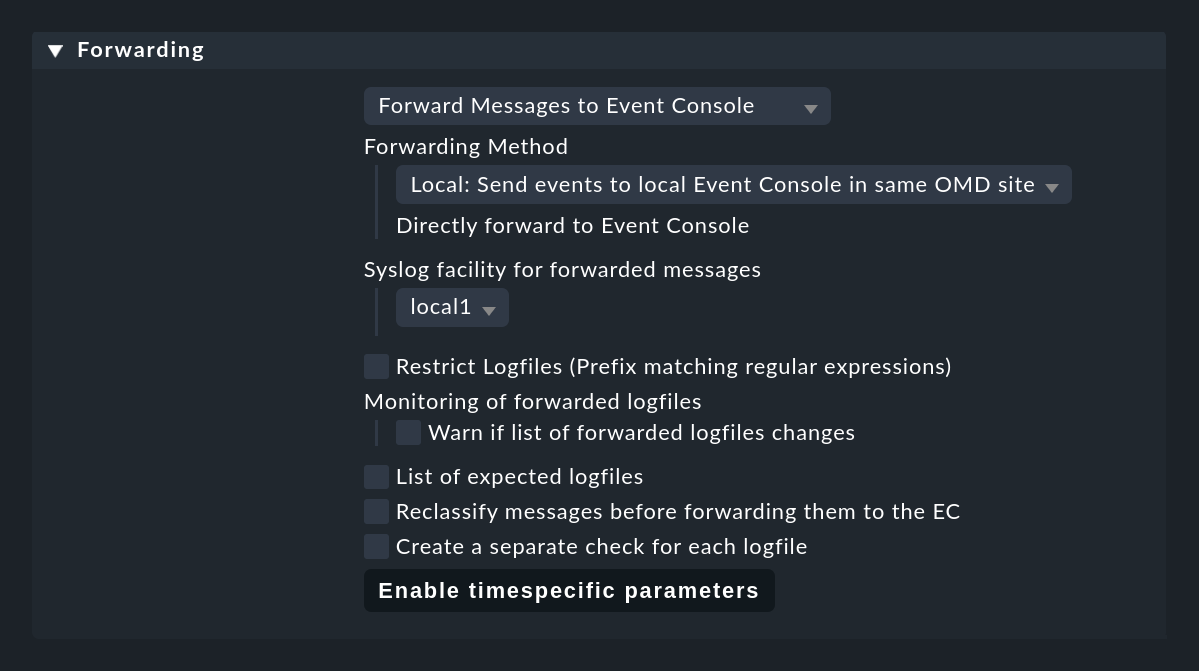
Now change Logwatch in a way that the messages found by the plug-ins are no longer monitored with the normal Logwatch check, instead simply forwarded 1:1 to the Event Console and processed there. This is done with the Logwatch Event Console Forwarding rule set:
A few notes in this regard:
If you have a distributed environment where each site does not have its own Event Console, the remote sites must forward their messages to the central site via syslog.
The default for this is UDP, however, this is not a secure protocol.
A better solution is to use syslog via TCP, but you will have to enable this in the central site (omd config).
When forwarding, specify any Syslog facility.
By means of this you can easily recognize the forwarded messages in the EC.
Well suited for this are local0 to local7.
With List of expected logfiles you can monitor the list of expected logfiles and be warned if certain files are not found as expected.
Important: Saving the rule alone does not accomplish anything. This rule only becomes active during a service discovery. Only when you run it again, will the previous Logwatch services be removed, and instead one new service named Log Forwarding is created for each host.
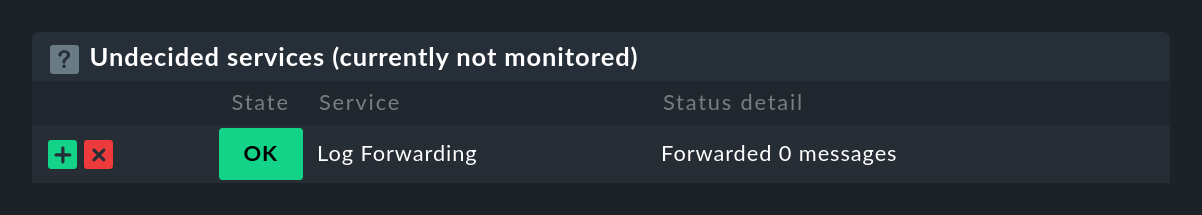
This check will also later show you should any problems occur when forwarding to the Event Console.
8.1. Service level and syslog priorities
Since forwarded log files often lack syslog classification depending on the format used, you can define the reclassification in the Logwatch Event Console Forwarding rule set under Log Forwarding. Additionally, in the rule sets you define as a part of the Rule packs it is always possible to set the status and service levels individually.
9. Event status in active monitoring
If you also want to see which hosts in the active monitoring currently have open problematic events, you can add an active check for each host which summarizes the host’s current event status. For a host with no open events, it will look like this:

If there are only events in the OK state, the check shows their number, but remains green:

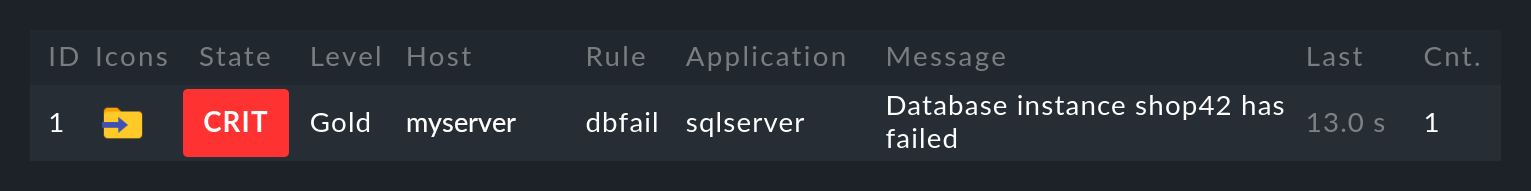
Here is an example of a case with open events in the CRIT state:

You create this active check using a rule in the Check event state in Event Console rule set. You can also specify whether or not events that have already been acknowledged should still contribute to the status:
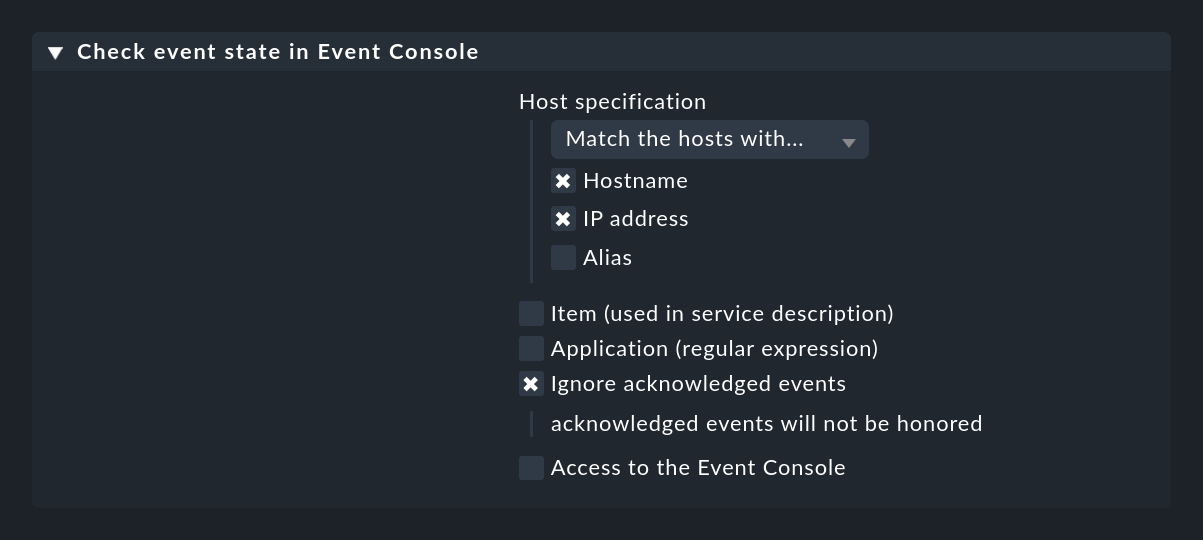
With the Application (regular expression) option you can restrict the check to events that have a specific text in the application field. In this case it may make sense to have more than one event check on a host and to separate the checks by application. So that these are distinguished by name, you also need the Item (used in service description) option, which adds a text you specify to the service name.
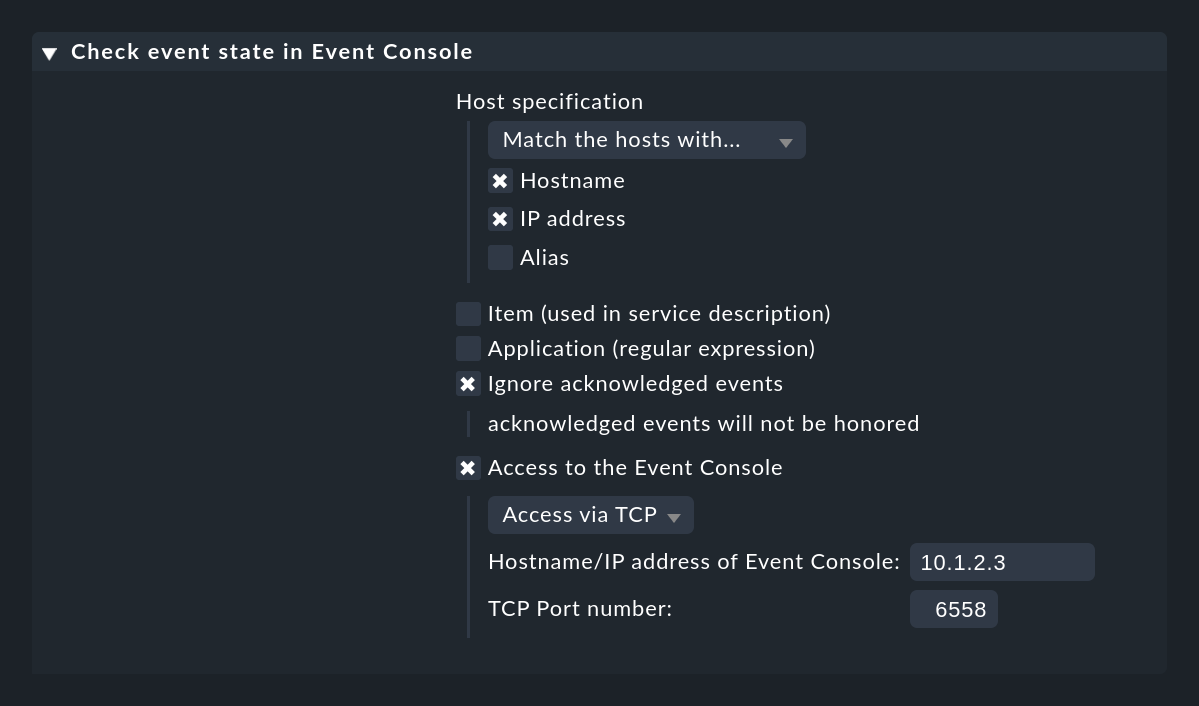
If your Event Console is not running on the same Checkmk site as the one that is also monitoring the host, you need to set Access to Event Console for a remote access via TCP:
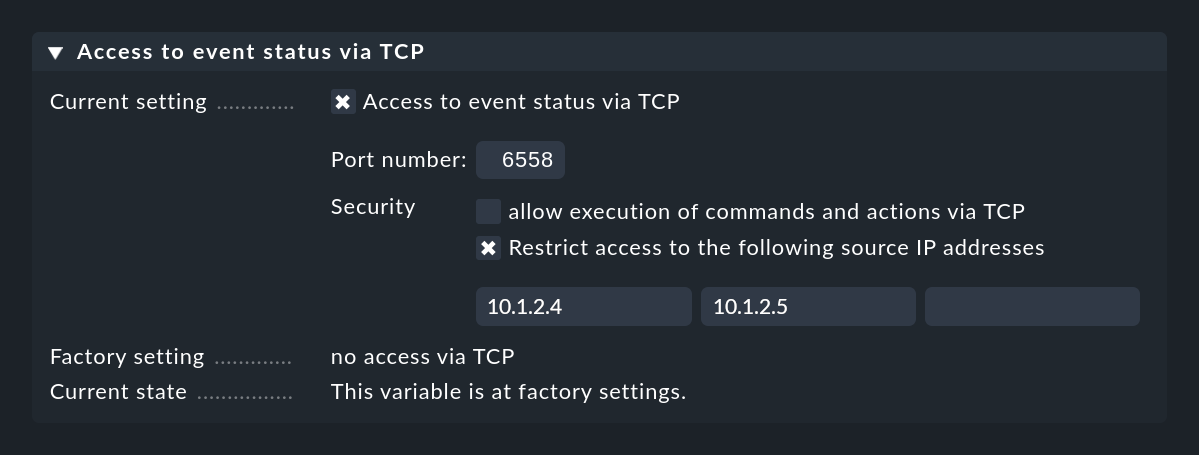
For this to work, the Event Console must allow access via TCP. You can configure this in the Event Console settings that is to be accessed:
10. The archive
10.1. How the archive functions
The Event Console keeps a log of all changes that an event undergoes. This log can be found in two ways:
In the Recent event history global view, which you can find in Monitor > Event Console.
In the details of an event via the Event Console Event > History of Event menu item.
In the global view there is a filter that only shows the events of the last 24 hours. However, as usual you can customize the filters.
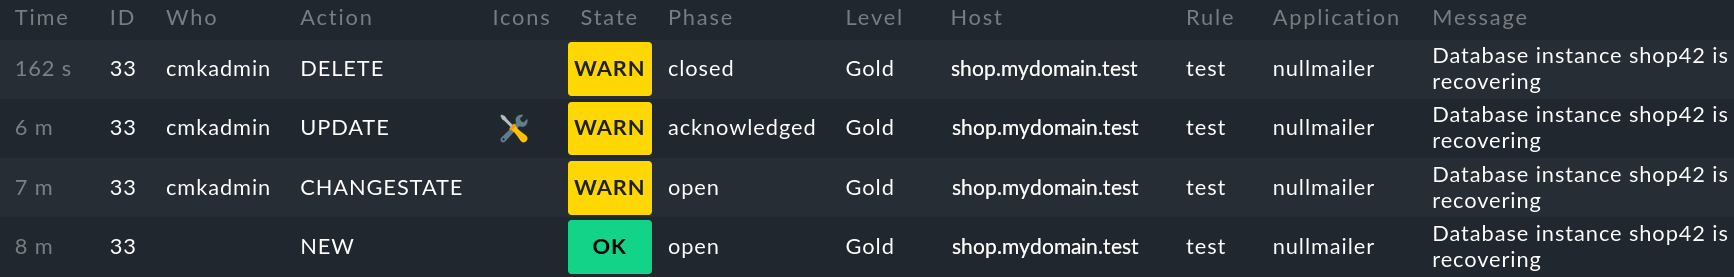
The following figure shows the history of event 33, which has undergone a total of four changes.
First the event was created (NEW),
then the state was manually changed from OK to WARN (CHANGESTATE),
then acknowledged with an added comment (UPDATE), and
finally the event was archived/deleted (DELETE):
The archive contains the following action types which are displayed in the Action column:
| Action type | Description |
|---|---|
|
The event was newly created (due to a message received or due to a rule expecting a message that failed to appear). |
|
The event was edited by the operator (change to comment, contact info, acknowledgement). |
|
The event was archived. |
|
The event was automatically canceled by an OK message. |
|
The state of the event was changed by the operator. |
|
The event was automatically archived because no rule was applied and Force message archiving was enabled in the global settings. |
|
The event was automatically archived because while it was in the counting phase, its associated rule was deleted. |
|
The event was moved from counting to open because the configured number of messages was reached. |
|
The event was automatically archived because the required number of messages was not reached in counting. |
|
The event was automatically archived because while it was in the counting phase, its associated rule was changed to 'do not count'. |
|
The event was opened because the delay configured in the rule expired. |
|
The event was automatically archived because its configured lifetime had expired. |
|
An email was sent. |
|
An automatic action (script) was executed. |
|
The event was automatically archived immediately after opening, because this was configured in its corresponding rule. |
10.2. Location of the archive
As mentioned above, the Event Console archive has not been designed as a fully-fledged syslog archive.
To keep the implementation and especially the administration as simple as possible, a database back-end has been omitted.
Instead the archive is written to simple text files.
Each entry consists of one line of text, which contains columns separated by tabs.
You can find the files in ~/var/mkeventd/history:
OMD[mysite]:~$ ll var/mkeventd/history/
total 1328
-rw-rw-r-- 1 stable stable 131 Dec 4 23:59 1480633200.log
-rw-rw-r-- 1 stable stable 1123368 Dec 5 23:39 1480892400.log
-rw-rw-r-- 1 stable stable 219812 Dec 6 09:46 1480978800.log
By default, a new file is started automatically every day. In the Event Console settings you can customize the rotation of the file. The Event history logfile rotation setting allows you to switch to a weekly rotation.
The file names conform to the Unix timestamp from the time of of the file creation (seconds since 1/1/1970 UTC).
The files are kept for 365 days unless you change this in the Event history lifetime setting. In addition, the files are also recorded by the central disk space management of Checkmk, which can be configured in the Global settings under Site management. In this case, the shorter time limit set in each case applies. The global management has the advantage that should free disk space become marginal it automatically deletes Checkmk’s historical data consistently, starting with the oldest.
If you run into space problems, you can also simply delete the files in the directory manually or swap them out. Do not put zipped or any other files in this directory.
10.3. Automatic archiving
Despite the limitations of the text files, it is theoretically possible to archive a large number of messages in the Event Console. Writing to the archive’s text files is very performant — but at the cost of a less efficient later search. Since the files have only the request period as their index, for any request all relevant files have to be read and searched fully.
Normally the EC will only write such messages to the archive, for which an event has actually been opened. You can do this in two different ways to extend this to all events:
You create a rule that matches all (further) events and in Outcome & actions activate the Delete event immediately after the actions option.
You activate the Force message archiving switch in the Event Console settings.
The latter ensures that messages which are not subject to any rule are nevertheless written into the (action type ARCHIVED) archive.
11. Performance and tuning
11.1. Message processing
Even in times when servers have 64 cores and 2 TB of main memory, the performance of software still plays a role. Especially in the processing of events, incoming messages can be lost in extreme situations.
The reason is that none of the protocols used (Syslog, SNMP traps, etc.) provides for flow control. If thousands of hosts are simultaneously sending messages every second, the receiver has no chance of slowing them down.
Therefore, in somewhat larger environments, it is important that you keep an eye on the processing times for messages. This depends on how many rules you have defined and how these are structured.
Measuring the performance
To measure your performance there is a separate snap-in for the sidebar with the name Event Console Performance.
You can include this as usual with ![]() :
:
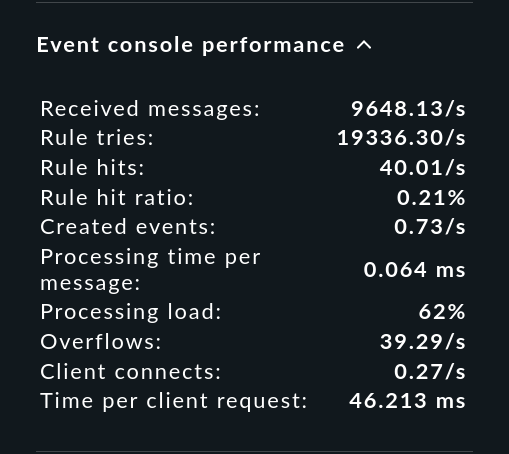
The values shown here are averages over about the last minute. An event storm that lasts only a few seconds cannot be read here directly, but the numbers have been somewhat smoothed out and are thus easier to read.
To test the maximum performance, you can artificially generate a storm of unclassified messages (please only in the test system!), for example, in a shell loop by continuously writing the contents of a text file into the events pipe.
OMD[mysite]:~$ while true ; do cat /etc/services > tmp/run/mkeventd/events ; doneThe most important readings from the snap-in have the following meaning:
| Value | Meaning |
|---|---|
Received messages |
Number of messages currently received per second. |
Rule tries |
Number of rules that are tried. This provides valuable information about the efficiency of the rule chain — especially together with the next parameter. |
Rule hits |
Number of rules per second that are currently hitting. These can also be rules that discard messages or which simply count. Therefore not every rule hit results in an event. |
Rule hit ratio |
The ratio of Rule tries and Rule hits. In other words: How many rules does the EC have to try before one (finally) takes effect. In the example from the screenshot the rate is alarmingly small. |
Created events |
Number of new events created per second. Since the Event Console should only show relevant problems (comparable to host and service problems from monitoring), the number |
Processing time per message |
Here you can read how much time it took to process a message. Caution: In general this is not the inverse of Received messages. Because the times in which the Event Console had nothing to do are still missing, simply because no messages came in. Here you really measure the pure real elapsed time between the arrival of a message and the final completion of processing. You can see approximately how many messages the EC can handle in a given time. Note also that this is not CPU time, but real time. On a system with enough free CPUs, these times are about the same. But as soon as the system is so under load that not all processes always get a CPU, the real time can become much higher. |
Tuning tips
You can see how many messages the Event Console can process per second from the Processing time per message. This time is generally related to the number of rules that have to be tried before a message is processed. You have several options for optimization here:
Rules that exclude very many messages should be placed as far as possible at the beginning of the rule chain.
Work with rule packs to group sets of related rules together. The first rule in each package should leave the package immediately if the common base condition is not met.
Furthermore, there is an optimization in the EC based on the syslog priority and facility. For each combination of priority and facility, a separate rule chain is created internally in which only such rules that are relevant for messages of this combination are included.
Each rule that contains a condition on the priority, the facility or preferably both, will not be included in all of these rule chains, instead optimally only in one. This means that the rule does not need to be checked for messages with a different syslog classification.
Following a restart, in ~/var/log/mkeventd.log you will see an overview of the optimized rule chains:
[8488808306.233330]  kern        : emerg(112) alert(67) crit(67) err(67) warning(67) notice(67) info(67) debug(67)
[8488808306.233343]  user        : emerg(112) alert(67) crit(67) err(67) warning(67) notice(67) info(67) debug(67)
[8488808306.233355]  mail        : emerg(112) alert(67) crit(67) err(67) warning(67) notice(67) info(67) debug(67)
[8488808306.233367]  daemon      : emerg(120) alert(89) crit(89) err(89) warning(89) notice(89) info(89) debug(89)
[8488808306.233378]  auth        : emerg(112) alert(67) crit(67) err(67) warning(67) notice(67) info(67) debug(67)
[8488808306.233389]  syslog      : emerg(112) alert(67) crit(67) err(67) warning(67) notice(67) info(67) debug(67)
[8488808306.233408]  lpr         : emerg(112) alert(67) crit(67) err(67) warning(67) notice(67) info(67) debug(67)
[8488808306.233482]  news        : emerg(112) alert(67) crit(67) err(67) warning(67) notice(67) info(67) debug(67)
[8488808306.233424]  uucp        : emerg(112) alert(67) crit(67) err(67) warning(67) notice(67) info(67) debug(67)
[8488808306.233435]  cron        : emerg(112) alert(67) crit(67) err(67) warning(67) notice(67) info(67) debug(67)
[8488808306.233446]  authpriv    : emerg(112) alert(67) crit(67) err(67) warning(67) notice(67) info(67) debug(67)
[8488808306.233457]  ftp         : emerg(112) alert(67) crit(67) err(67) warning(67) notice(67) info(67) debug(67)
[8488808306.233469]  (unused 12) : emerg(112) alert(67) crit(67) err(67) warning(67) notice(67) info(67) debug(67)
[8488808306.233480]  (unused 13) : emerg(112) alert(67) crit(67) err(67) warning(67) notice(67) info(67) debug(67)
[8488808306.233498]  (unused 13) : emerg(112) alert(67) crit(67) err(67) warning(67) notice(67) info(67) debug(67)
[8488808306.233502]  (unused 14) : emerg(112) alert(67) crit(67) err(67) warning(67) notice(67) info(67) debug(67)
[8488808306.233589]  local0      : emerg(112) alert(67) crit(67) err(67) warning(67) notice(67) info(67) debug(67)
[8488808306.233538]  local1      : emerg(112) alert(67) crit(67) err(67) warning(67) notice(67) info(67) debug(67)
[8488808306.233542]  local2      : emerg(112) alert(67) crit(67) err(67) warning(67) notice(67) info(67) debug(67)
[8488808306.233552]  local3      : emerg(112) alert(67) crit(67) err(67) warning(67) notice(67) info(67) debug(67)
[8488808306.233563]  local4      : emerg(112) alert(67) crit(67) err(67) warning(67) notice(67) info(67) debug(67)
[8488808306.233574]  local5      : emerg(112) alert(67) crit(67) err(67) warning(67) notice(67) info(67) debug(67)
[8488808306.233585]  local6      : emerg(112) alert(67) crit(67) err(67) warning(67) notice(67) info(67) debug(67)
[8488808306.233595]  local7      : emerg(112) alert(67) crit(67) err(67) warning(67) notice(67) info(67) debug(67)
[8488808306.233654]  snmptrap    : emerg(112) alert(67) crit(67) err(67) warning(67) notice(67) info(67) debug(67)
In the above example you can see that in any case there are 67 rules that must be checked.
For messages from the daemon facility 89 rules are relevant, only for the combination daemon/emerg 120 rules have to be checked.
Each rule which gets a condition on priority or facility further reduces the number from 67.
Of course you can set these conditions only if you are sure that they are fulfilled by the relevant messages!
11.2. The count of current events
The number of events currently present can also affect the performance of the EC — that is, when it gets seriously out of control. As mentioned earlier, the EC should not be seen as a substitute for a syslog archive, rather only for displaying 'current problems'. The Event Console can certainly handle several thousand problems, but that is not its real purpose.
As soon as the number of current events exceeds about 5 000, the performance begins to deteriorate noticeably. On the one hand, this can be seen in the GUI, which reacts more slowly to requests. On the other hand, the processing also becomes slower, since in some situations, messages have to be compared with all current events. The memory requirements can also become problematic.
For performance reasons, the Event Console always keeps all current events in RAM.
These are written to the ~/var/mkeventd/status file once per minute (adjustable) and on a clean completion of processing.
If this becomes very large (e.g. over 50 megabytes), this process also becomes slower and slower.
You can quickly check the current size with ll. (alias for ls -alF):
OMD[mysite]:~$ ll -h var/mkeventd/status
-rw-r--r-- 1 mysite mysite 386K Dez 14 13:46 var/mkeventd/status
If you have too many current events due to a clumsy rule (e.g. one that matches on everything), a manual deletion via the GUI is not reasonably possible. In this case simply deleting the status file will help:
OMD[mysite]:~$ omd stop mkeventd
Stopping mkeventd...killing 17436......OK
OMD[mysite]:~$ rm var/mkeventd/status
OMD[mysite]:~$ omd start mkeventd
Starting mkeventd (builtin: syslog-udp)...OK
Attention: Of course, all current events will be lost as well as the stored counter and other states. In particular new events will start with ID 1 again.
Automatic overflow protection
The Event Console has an automatic protection against an 'overflow'. This limits the number of current events per host, per rule and globally. Not only open events are counted, but also events in other phases, such as delayed or counting. Archived events are not counted.
This will protect you in situations where, due to a systematic problem on your network, thousands of critical events are flooding in and the Event Console would 'shut down'. On the one hand, this prevents a performance degradation of the Event Console, which would have to hold too many events in its main memory. On the other hand the overview for the operator is (somewhat) protected and events that are not part of the storm remain visible.
Once a limit is reached, one of the following actions will occur:
Creation of new events is stopped (for this host, rule or globally).
The same, but in addition an 'overflow event' is created.
The same, but in addition appropriate contacts are notified.
As an alternative to the above three variants, you can also have the oldest event deleted to make room for the new one.
The limits as well as the associated effect on reaching them are defined in the Event Console settings with Limit amount of current events. The following figure shows the default setting:
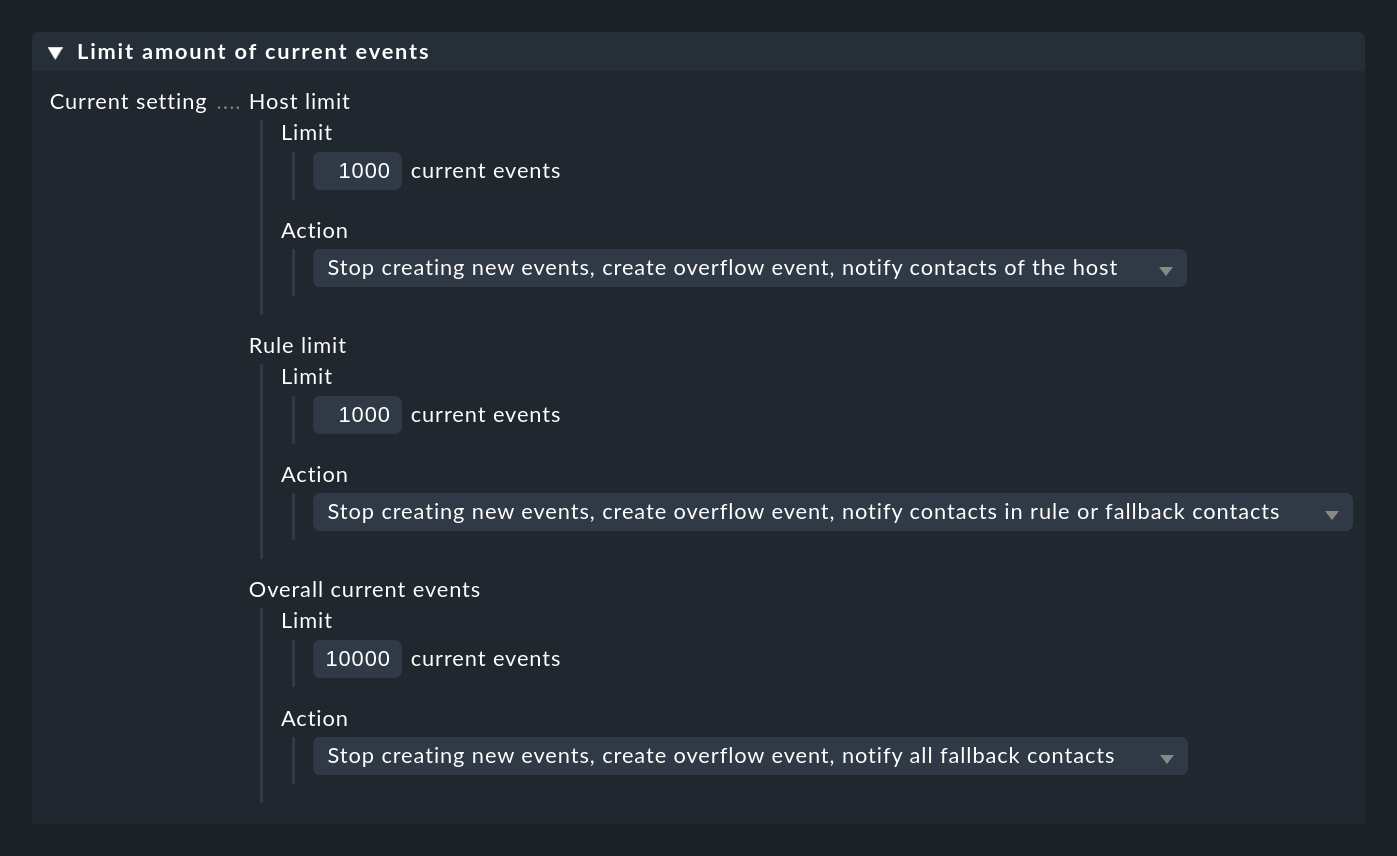
If you have enabled a value with …create overflow event, when the limit is reached, a single artificial event will be created, informing the operator of the error situation:
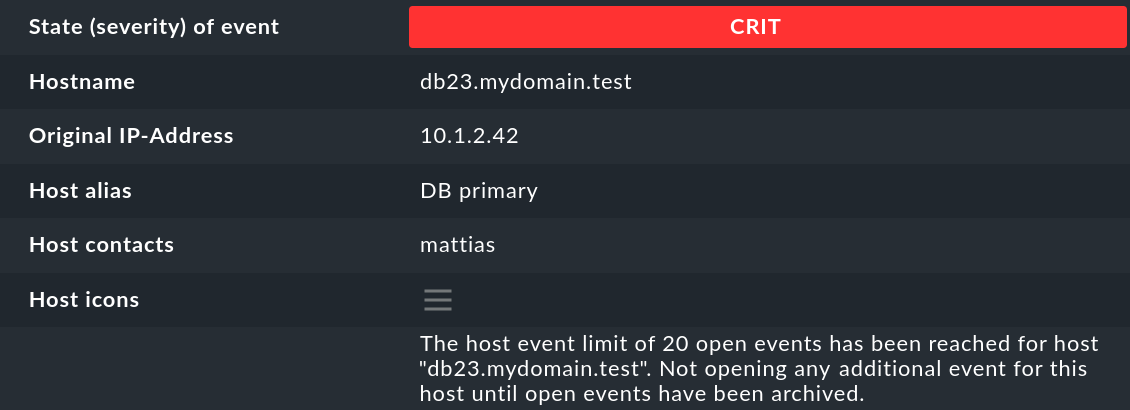
If you have additionally enabled a value with …notify contacts, the appropriate contacts will be notified via Checkmk notification. That notification will go through the Checkmk notification rules. These rules do not have to follow the Event Console’s contact selection, but can modify it. The following table shows which contacts are selected if you have set Notify all contacts of the notified host or service (which is the default):
| Limit | Contact selection |
|---|---|
per host |
The contacts to the host, which are determined in the same way as for notification of events via Checkmk. |
per rule |
Leave the host name field empty. If contact groups are defined in the rule, they will be selected, otherwise the fallback contacts will apply. |
Global |
The fallback contacts. |
11.3. Archive too large
As above shows, the Event Console has an archive of all the events and their processing steps. This is stored in text files for ease of implementation and administration.
Text files are hard to beat in terms of performance when writing data — by using databases, for example, only with enormous optimization effort. This is due to, among other factors, the optimization of this type of access by Linux and the complete memory hierarchy of disks and SANs. However, this is at the expense of read accesses. Since text files do not have an index, a complete read is necessary when searching in the files.
At its simplest the Event Console uses the filenames of the log files its index for the time of the events. The further you limit the query period, the faster the search will be.
Nevertheless, it is very important that your archive does not become too large. If you use the Event Console only to process real error messages, this can’t really happen. If you try to use the EC as a replacement for a real syslog archive, this can lead to very large files.
If you run into a situation where your archive has become too large, you can simply delete older files in ~/var/mkeventd/history/.
Additionally, in Event history lifetime you can generally limit the lifetime of data so that deletion is the default in the future.
By default 365 days are stored.
Maybe you can get by with significantly less.
11.4. Measuring performance over time
Checkmk automatically starts a service for each Event Console site, which records its performance data in curves and also warns you if overflows occur.
Provided you have installed a Linux agent on the monitoring server, the check will be automatically found and set up as usual:
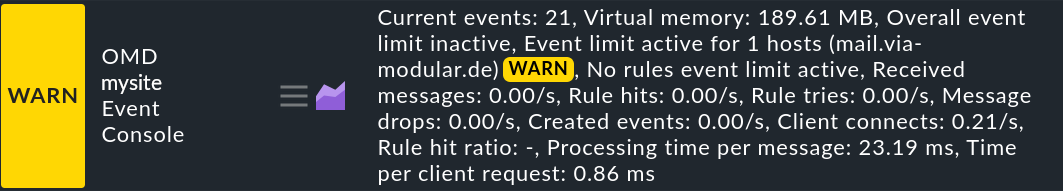
The check comes with very many interesting measurement types, e.g. the number of of incoming messages for each period of time and how many of them were discarded:
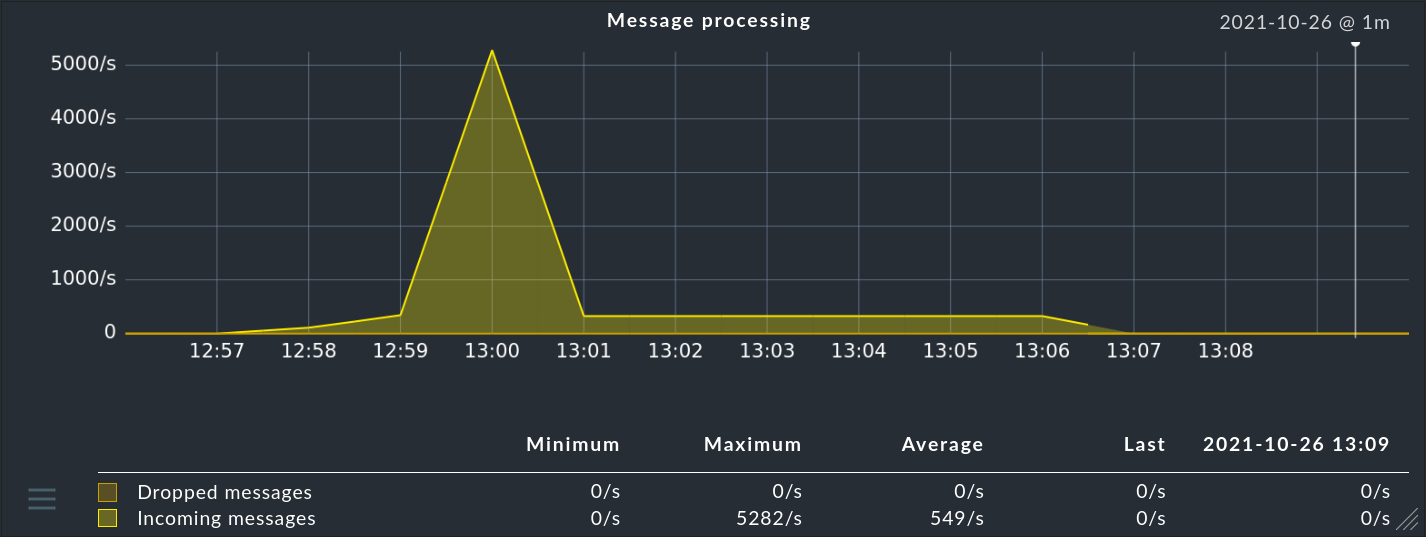
The efficiency of your rule chain is represented by a comparison of the rules tested to those that worked:
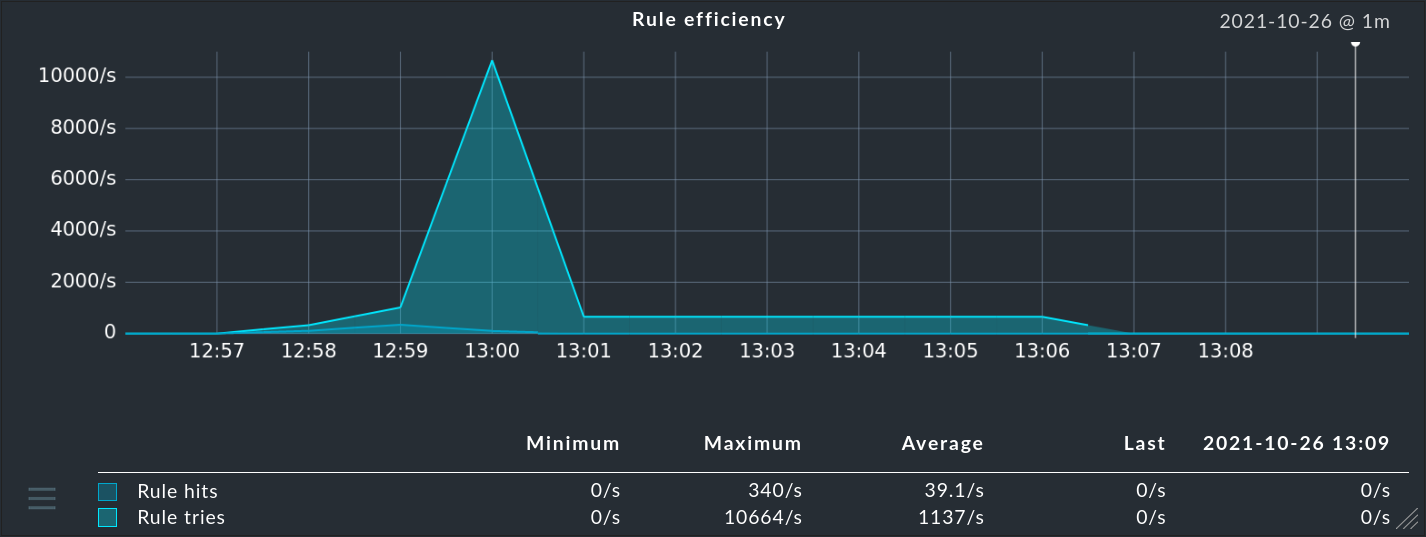
This graph shows the average time it takes to process a message:
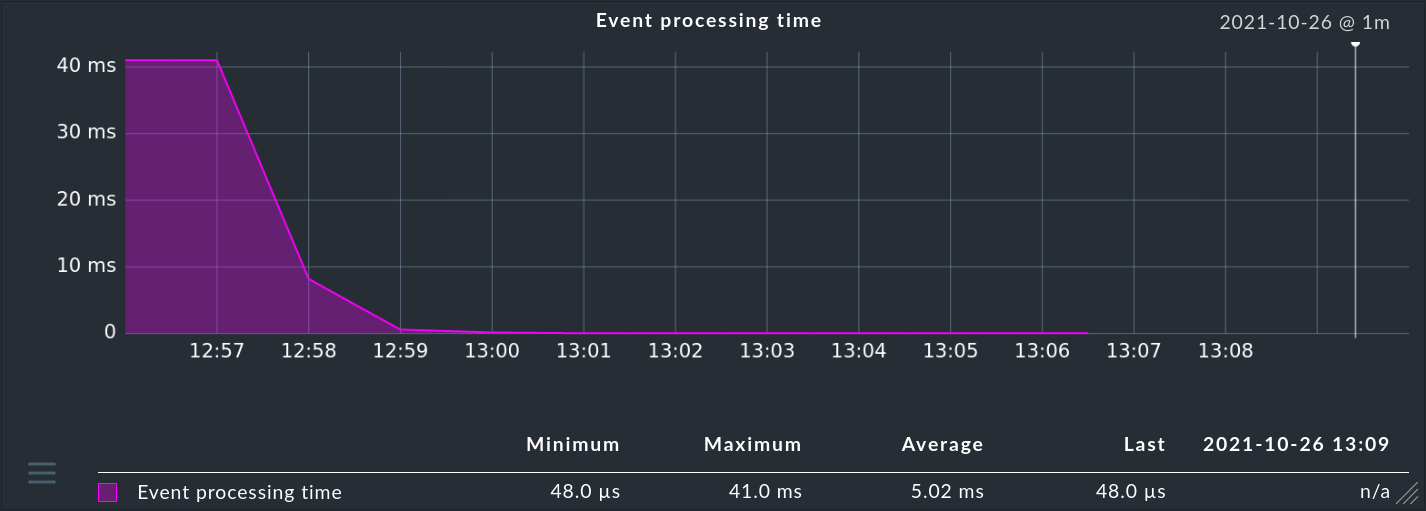
There are also quite a few additional graphs.
12. Distributed monitoring
How to use the Event Console in an installation with multiple Checkmk sites, see the article on distributed monitoring.
13. The status interface
The Event Console via the Unix socket ~/tmp/run/mkeventd/status provides both access to the internal status and the facility to execute commands.
The protocol used here is a tightly-restricted subset of Livestatus.
This interface is accessed by the monitoring core and passes the data through to the GUI in order to provide a distributed monitoring for the Event Console as well.
The following restrictions apply to the simplified Livestatus of the Event Console:
The only headers allowed are
Filter:andOutputFormat:.Therefore no KeepAlive is possible, only one request can be made per connection.
The following tables are available:
|
List all current events. |
|
Access to the archive. A query on this table will access the text files of the archive. Be sure to use a filter over the time of the entry to avoid full access to all files. |
|
Status and performance values of the EC. This table always has exactly one row. |
Commands can be written into the socket using unixcat with a very simple syntax:
OMD[mysite]:~$ echo "COMMAND RELOAD" | unixcat tmp/run/mkeventd/statusThe following commands are available:
|
Archives an event. Arguments: event ID and user abbreviation. |
|
Reload the configuration. |
|
Exits the Event Console. |
|
Reopens the log file. This command is required by the log file rotation. |
|
Deletes all current and archived events. |
|
Initiates an immediate update of the |
|
Resets the rule hit counters (corresponds to the Event Console > Reset counters menu item in the Setup GUI). |
|
Executes an update from an event. The arguments are in order event id, user abbreviation, acknowledgement (0/1), comment and contact info. |
|
Changes the OK / WARN / CRIT / UNKNOWN states of an event. Arguments are event ID, user abbreviation and status digit ( |
|
Executes a user-defined action on an event. Arguments are event ID, user abbreviation and action ID. The special ID |
14. Files and directories
| File path | Description |
|---|---|
|
Working directory of the event daemon. |
|
Complete current state of the Event Console. This mainly includes all currently open events (and those in transition phases like counting etc.). In the case of a misconfiguration that leads to a lot of open events, this file can become huge and drastically reduce the performance of the EC. In such a situation you can stop the |
|
File location of the archive. |
|
Log file of the Event Console. |
|
The global settings of the Event Console in Python syntax. |
|
All your configured rule packages and rules in Python syntax. |
|
A named pipe where you can write messages directly with |
|
A Unix socket that does the same job as the pipe, but allows multiple applications to write to it simultaneously. To write to it, you need the |
|
The current process ID of the event daemon while it is running. |
|
A Unix socket that allows querying the current status and sending commands. GUI requests first go to the monitoring core, which then accesses this socket. |
|
MIB files uploaded by you for SNMP trap translation. |